http://dx.doi.org/10.1590/1413-70542016406010416
Hydrodynamic behavior of a combined anaerobic-aerobic system
employed in the treatment of vinasse
Comportamento hidrodinâmico de um sistema combinado anaeróbio/aeróbio empregado no tratamento da vinhaça
Fátima Resende Luiz Fia1*, Ronaldo Fia1, Cláudio Milton Montenegro Campos1,
Luiz Fernando Coutinho de Oliveira1 1Universidade Federal de Lavras/UFLA, Departamento de Engenheira, Lavras, MG, Brasil *Corresponding author: fatimarlf@deg.ufla.br
Received in March 15, 2016 and approved in July 29, 2016
ABSTRACT
The understanding of reactor hydrodynamics is essential for improving the performance of a reactor and biogas production. This study sought to evaluate the hydrodynamic behavior of a combined anaerobic-aerobic system at a laboratory scale for treating vinasse. The experiment was conducted in a system using two UASB reactors connected in series, followed by an Aerated Submerged Biological Filter (ASBF). The flow rates applied to the system and the corresponded theoretical HRTs in the UASB1, UASB2 and ASBF were respectively:
15.6 L d-1 and 1.2 d, 1.2 d and 1.0 d (Phase I - first year); 8.5 L d-1 and 2.1 d; 2.1 d and 1.8 d (Phase II - first year), 14.6 L d-1 and 1.1 d, 1.1 d
and 1.0 d (Phase III - second year); 29.5 L d-1 and 0.6 d, 0.6 d and 0.5 d (Phase IV - second year). The hydrodynamic studies were carried
out using pulse type stimulus-response tests, employing LiCl as a tracer. The coefficients of determination for the dispersion models (R2)
indicate a close approximation of a continuous stirred tank reactor in series (multi-CSTR) model, with an average of 2.5, 2.3 and 1.2 (first year), and 1.1, 1.4 and 0.9 (second year) multi-CSTR for UASB1, UASB2 and ASBF, respectively. Results of the hydrodynamic tests carried out in UASB1, UASB2 and ASBF indicated strong tendency for flow in the complete mixture hydraulic regime, detecting a wide dispersion
in the units, in addition to the presence of short circuits and dead zones. Index terms: Hydrodynamic study; tracers; biological treatment.
RESUMO
O entendimento sobre a hidrodinâmica dos reatores é essencial para melhorar o desempenho e produção de biogás destas unidades. O objetivo deste estudo foi avaliar o comportamento hidrodinâmico de um sistema combinado anaeróbio-aeróbio em escala laboratorial no tratamento da vinhaça. O experimento foi conduzido em um sistema utilizando dois reatores UASB em série seguidos por um biofiltro biológico aerado submerso (FBAS). As vazões aplicadas no sistema e os correspondentes TRHs teóricos nos reatores UASB1, UASB2 e
FBAS foram respectivamente: 15,6 L d-1 e 1,2 d; 1,2 d e 1,0 d (Fase I - Primeiro ano); 8,5 L d-1 e 2,1 d; 2,1 d e 1,8 d (Fase II- Primeiro ano); 14,6 L d-1 e 1,1 d; 1,1 d e 1,0 d (Fase III- Segundo ano); 29,5 L d-1 e 0,6 d; 0,6 d e 0,5 d (Fase IV- Segundo ano). Os perfis hidrodinâmicos foram
realizados por meio de testes tipo pulso estímulo-resposta empregando como traçador LiCl. Os coeficientes de determinação (R2) dos
modelos de dispersão indicam uma maior aproximação do modelo de tanques de mistura completa em série (multi-CSTR), com uma média de 2,5; 2,3 e 1,2 (primeiro ano) e 1,1; 1,4 e 0,9 (segundo ano) reatores de mistura completa (multi-CSTR) em série para UASB1, UASB2 e FBAS, respectivamente. Os resultados realizados nos reatores UASB1, UASB2 e FBAS indicaram forte tendência do escoamento ao regime hidráulico de mistura completa, sendo detectada grande dispersão nas unidades, além da presença de curtos-circuitos e zonas mortas. Termos para indexação: Estudo hidrodinâmico; traçadores; tratamento biológico.
INTRODUCTION
For industries that use huge amounts of water, such as the sugar-ethanol sector, it is essential to treat and reuse
the liquid effluents. Therefore, the application of vinasse to the soil as a source of nutrients for crops has been suggested. However, the inappropriate provision can lead
to contamination of soils and groundwater. In association with this fact, it turns out that the discharge standards
applied to agro-industries are often strict and below the
levels that can be achieved with conventional biological treatment technologies.
these processes enables the construction of models that are more compact, with lower power consumption by aerators due to the reduced dissolved oxygen demand and lower production of biomass (sludge). However, in order to ensure greater performance wastewater treatment, knowledge on the hydrodynamic characteristics of these reactors is of fundamental importance (Renuka et al., 2016). The hydrodynamics and the degree of mixing that occur in a biological reactor can strongly influence the degree of contact between the substrate and the bacteria, thus controlling mass transfer, the biological kinetics and the performance potential of the reactors (Liu et al., 2007; Liu; Tian; Chen, 2010; Mansouri et al., 2012).
The importance of studying the hydrodynamic behavior of biological reactors has also been demonstrated by different authors including Carvalho et al. (2008); Ji et al. (2012); Jiang et al. (2014); Levenspiel (2000); Liu et al. (2007); Lourenço and Campos (2009); Matangue et al. (2016); Méndez-Romero et al. (2011); Metcalf Eddy (2003); Peña, Mara and Vella (2006); Renuka et al. (2016); Sarathai, Koottatep and Morel (2010), and others.
Based on knowledge of hydrodynamics, the flow regime can be determined (piston, complete mixing, dispersive or a combination of them). Also, it is possible to detect the presence of anomalies within the reactors, such as preferential paths, dead zones and short circuits, which can reduce the efficiency of these units (Metcalf; Eddy, 2003). These anomalies may affect the performance of
the reactors in wastewater treatment due to the decreased
useful volume and consequently the hydraulic residence time required for performance of microbial activity (Carvalho et al., 2008).
The study of hydrodynamic behavior is fundamental to analyze the flow regime and to confirm its relationship with the treatment efficiency, comparing factors that may represent deviations between the non-optimal regime (real) and ideal outlets. Thus, the objective of this work was to evaluate the hydrodynamic behavior of the proposed system using lithium chloride as a tracer (LiCl) and determine the flow regime by application of theoretical uniparametric models of low-intensity dispersion (PD), high-intensity dispersion (GD) and continuous stirred tank reactor in series (multi-CSTR), and to determine the hydraulic characteristics of the experimental units.
MATERIAL AND METHODS
System configuration and monitoring
The two upflow anaerobic sludge blanket (UASB) reactors were constructed of acrylic and with identical
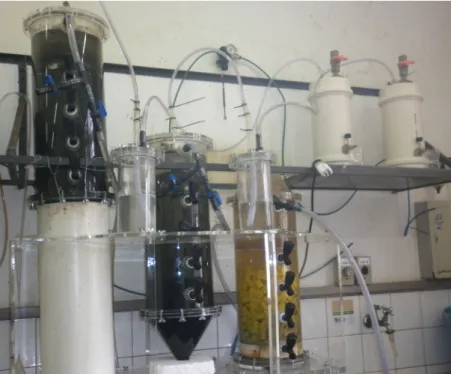
characteristics, measuring 0.18 m in inner diameter, 0.8 m in overall height and useful volume of 16 liters, possessing a three-phase separator device on the top. In sequence, an Aerated Submerged Biological Filter (ASBF) reactor was installed, also constructed of acrylic, with a diameter of 0.18 m, overall height of 0.5 m and 13.5 liter useful volume (Figure 1). The support material employed was corrugated conduit with 13 mm internal diameter, cut into 2 cm slices, and the unit was filled to a height of 28 cm. The effluent of the UASB reactors was the influent of ASBF reactor. All three reactors were fed via upward flow, therefore the liquid influent passed continually through the sludge blanket inside the UASB reactors and then through the support material until the outlet of the ASBF.
The vinasse liquid effluent originated from an alembic still referred to as the Cachaça Bocaina, located in the municipality of Lavras-MG. The wastewater was diluted and applied to UASB reactor 1 using the solenoid metering pump of the brand ProMinet®, model: CONCEPT Plus; then the liquid effluent was gravity-fed into the second UASB reactor 2, and finally also gravity-fed into the ASBF reactor.
Due to the seasonality of the vinasse wastewater, the system was monitored during two years, and each year the system was evaluated with two different hydraulic residence times (HRTs), which resulted in two phases of monitoring. In the first year, the system started-up on August 10th, 2012 and monitoring was extended until March 8th, 2013, totaling 211 days of monitoring. At the beginning, the HRT applied to UASB 1 was 1.2 days and upon performance stabilization of the units, the HRT was gradually reduced by increasing the flow rate. However, this HRT was very low to allow acclimatization of microorganisms and resulted in system imbalance. Therefore, it was opted to increase the HRT. This first phase was conducted from August 10th, 2012 until October 25th, 2012, totaling 77 days of monitoring. On October 26th the system was stopped for maintenance and adjustment of reactors which were emptied and cleaned. Phase II was conducted from November 1st, 2012, until March 8th, 2013, when the wastewater supply ran out, totaling 123 days of system monitoring.
Figure 1: Treatment system on a laboratory scale – UASB reactors in series with one ASBF.
Table 1: Flow rates and HRT(s) applied in UASB1, UASB2 and ASBF during the two phases that lasted two years
of monitoring.
Year Phase Flow rate (L d-1) HRT (days)
UASB1 UASB2 ASBF
I (211 days) I 15.6 ± 3.5 1.2 ± 0.7 1.2 ± 0.7 1.0 ± 0.6
II 8.5 ± 2.6 2.1 ± 1.2 2.1 ± 1.2 1.8 ± 1.0
II (190 days) III 14.6 ± 2.9 1.1 ± 0.3 1.1 ± 0.3 1.0 ± 0.3
IV 29.5 ± 4.5 0.6 ± 0.1 0.6 ± 0.1 0.5 ± 0.1
Hydrodynamic Tests
At the end of each experimental year hydrodynamic tests were carried out in order to characterize the flow patterns of the units. All tests were performed using lithium chloride (LiCl) as a tracer. This selection was made because it is a highly water-soluble salt, shows good diffusibility and can be detected in low concentrations; it is rare in nature and widely used for this purpose. Some authors have used the lithium chloride tracer in response to stimulus tests for determining the distribution curves of hydraulic residence time of bioreactors in wastewater treatment (Peña; Mara; Vella, 2006; Lourenço; Campos, 2009; Sarathai; Koottatep; Morel, 2010; Rincón; Galindo; Pérez, 2011; Zheng et al., 2012).
The amount of tracer used was calculated based on the useful volume of the UASB reactors and ASBF; moreover, the theoretical detection range of the device was observed. The tracer was injected in the three reactors using the pulse methodology. After introduction of the tracer in UASB 1, UASB 2 and ASBF, respectively, samples were collected at 15 minute intervals, of equal times, stored and subsequently concentration readings were obtained using a flame photometer. During the hydrodynamic test pump was employed for each reactor. The operating conditions of the reactors, the lithium chloride mass injected and the recovered mass can be found in Table 2.
(area under the curve equal to 1), according to Levenspiel (2000), resulting in distribution curves of the hydraulic residence time (Cθ) as a function of dimensionless time
(θ). After normalization, it was possible to calculate the variance for each test (σθ2). A summary of the definitions of the variables employed for obtaining the hydraulic residence time distribution curve (Cθ) as a function of dimensionless time (θ) can be observed in Table 3.
Adjust of the experimental hydraulic residence time distribution curves as a function of dimensionless time
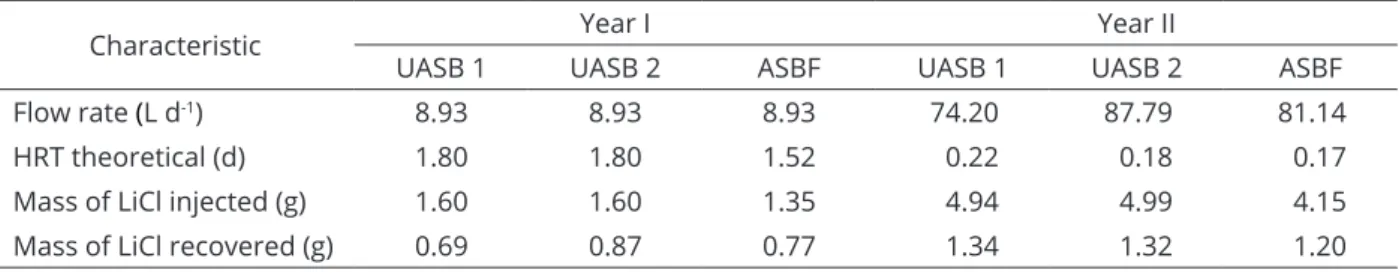
Table 2: Characteristics of Hydrodynamic tests.
Characteristic Year I Year II
UASB 1 UASB 2 ASBF UASB 1 UASB 2 ASBF
Flow rate (L d-1) 8.93 8.93 8.93 74.20 87.79 81.14
HRT theoretical (d) 1.80 1.80 1.52 0.22 0.18 0.17
Mass of LiCl injected (g) 1.60 1.60 1.35 4.94 4.99 4.15
Mass of LiCl recovered (g) 0.69 0.87 0.77 1.34 1.32 1.20
HRTtheoretical calculated by the equation: theoretical
ReactorVolume HRT
Flowrate
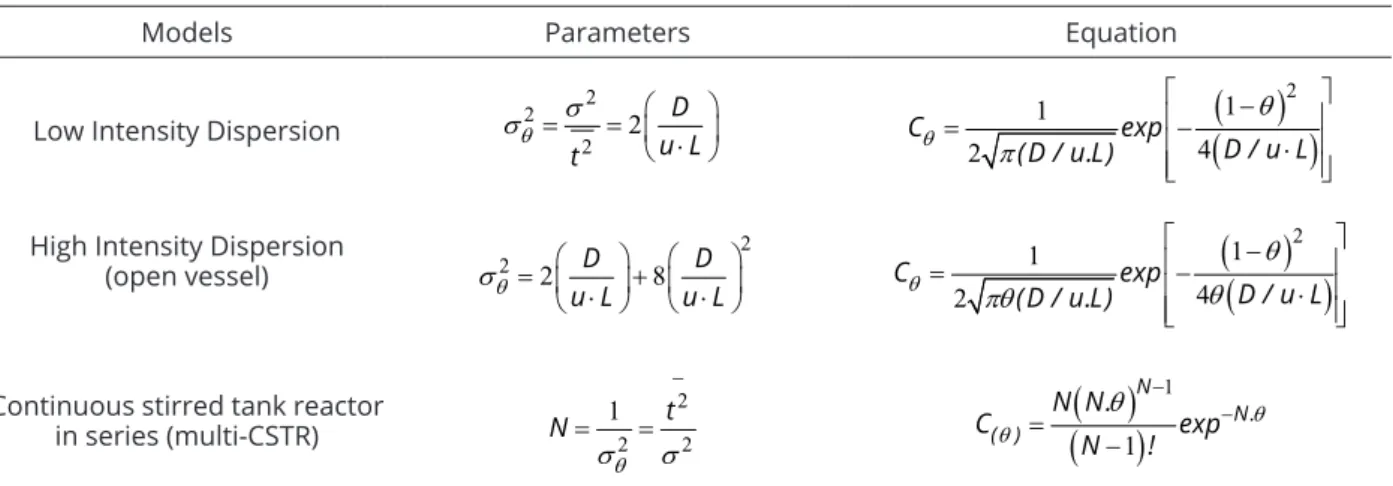
was performed based on the theoretical uniparametric models of low-intensity dispersion (PD), high-intensity dispersion (GD) and continuous stirred tank reactor in series (multi-CSTR) according to Levenspiel (2000) (Table 4). These characteristics can be verified by the dispersion number (d = D/uL) for models of low and high-intensity dispersion or by the number of tanks in series (N) for the multi-CSTR model. The estimation of these parameters was carried out by the variance of the response data presented in Table 4.
Table 3: Equations used to obtain the hydraulic residence time distribution curve as a function of dimensionless time.
Equation Variables
i ii C E(t )
C t
E (t): residence time distribution of the fluid inside the unit;
t
: average hydraulic residence time (h);t: elapsed time during parsing with the tracer (h);
C(t): output concentration of the tracer at time (t) (mg L-1);
E: standard residence time distribution of the fluid;
σ2: variance of the residence time distribution of the fluid (h2).
σ2
θ: normalized variance of the average residence time distribution;
θ: normalized average hydraulic residence time (dimensionless);
i i i i reali i i
t C t t HRT
C t
t t
2
2 2
i i i i
i i i
t C t t C t
2 2
2
Table 4: Variables used to obtain the hydraulic residence time distribution curve (Cθ) as a function of dimensionless
time (θ).
Models Parameters Equation
Low Intensity Dispersion
2 2 2 2 D u L t
2 1 1 4 2 C expD / u L (D / u.L)
High Intensity Dispersion
(open vessel) 2 2 2 8 D D
u L u L
2 1 1 4 2 C expD / u L (D / u.L)
Continuous stirred tank reactor
in series (multi-CSTR)
2 2 2 1
t
N
1 1 N N. ( ) N N. C exp N !
C (θ): standard residence time distribution of the fluid inside the unit; D: Dispersion coefficient (m2 h-1); u: average speed (m h-1); L: unit path length (m); D/uL: Dispersion number (d) (dimensionless); t: average hydraulic residence time (h); σ2
θ: normalized variance of the average residence time distribution; σ2: variance of the average residence time distribution; N: number of tanks in series.
Table 5: Parameters of hydraulic system performance assessment.
Index Definition Interpretation
Volumetric efficiency (λ) HRTreal/HRTtheoretical The value of 1 indicates full volume use of treatment; greater or less than 1 indicates the existence of short circuits and dead zones.
Index of modal retention
time HRTpeak/HRTtheoretical
Values close to 1 indicate plug flow behavior and 0 indicates complete mixing. Values that deviate from 1, more or less, indicate non-uniform distribution Those much less than 1 indicate short circuits or low effective
volume.
Short circuit index HRTi / HRTtheoretical
For system with ideal plug flow behavior, the ratio is 1, and approximately 0 for systems with complete mixing behavior.
Index deviation of the Residence time distribution
curve (RTD) in relation to
the normal curve
HRT50%/HRTreal
Values less than 1 can indicate stagnant areas in the
reactor (dead zones)
Morril dispersion Index
(MDI) HRT90%/HRT10% Under ideal conditions, plug flow reactors must assume IDM equal to 1.0; and for complete mixing a flow equal to 22.0. λ volumetric efficiency assessment Index; HRTpeak / HRTtheoretical time index modal of residence; HRTi / HRTtheoretical short circuit Index (SCI); HRT50%/HRTreal Index of the RTD curve deviation in relation to the normal curve; MDI - HRT90%/HRT10% Morril dispersion index for estimation of the index of dispersion; HRTreal-Real hydraulic residence time; HRTtheoretical theoretical hydraulic residence time; HRTpeak-time at which the tracer concentration peak is recorded in the output; HRTi-time in which the tracer was detected for the first time; HRT10%, HRT50% and HRT90%-time 10%, 50% and 90% tracer undergoing mass output of the unit.
Some indexes are used for more careful evaluation of the hydraulic performance of the units and liquid effluent treatment systems, since they evaluate the type, extent and
RESULTS AND DISCUSSION
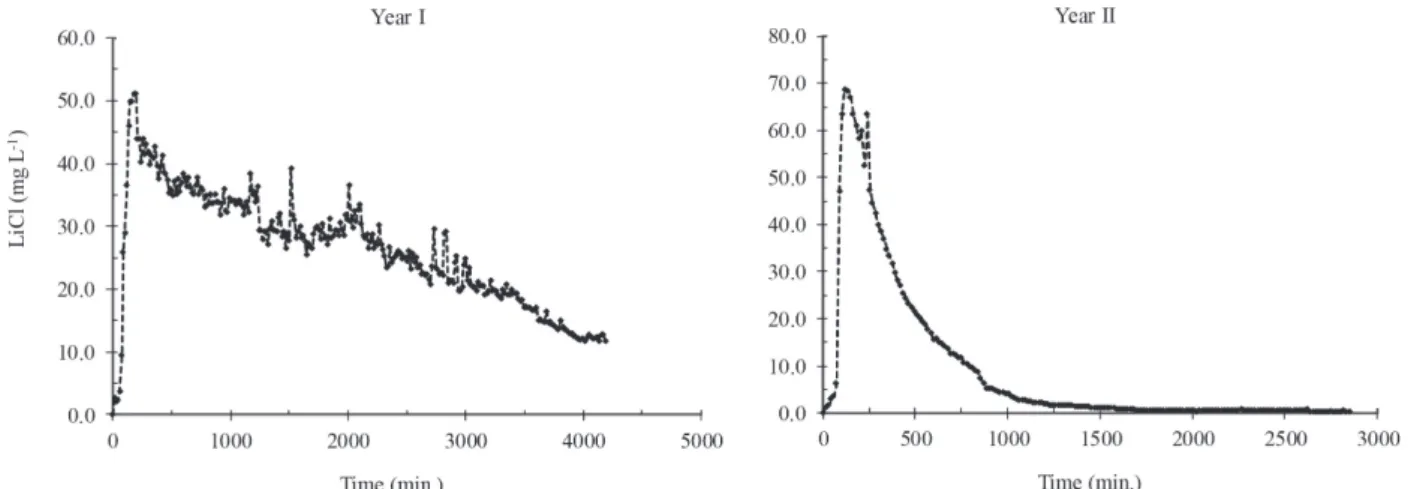
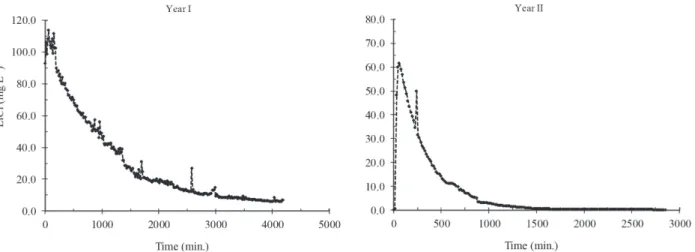
The variation curves of lithium chloride concentrations over time in wastewater from the UASB1, UASB2 and ASBF reactors, and hydrodynamic tests carried out in the first and second experimental year are presented in Figures 2, 3 and 4.
During the assays, the output of Li+ was observed during the entire collection period from the UASB1, UASB2 and ASBF, and the concentrations declined over time. The tests were terminated after approximately 2.92 and 1.98 days for assays performed in the first and second year, respectively, even without having reached a concentration value equal to zero in the latest reading. Also noted was the discharge of Li+ in the effluent of
the UASB1, UASB2 and FBAS reactors during the first few hours of testing, indicating the occurrence of short-circuits (Figures 2, 3 and 4).
An accentuated “tail” can be observed in the experimental response curve for the assays conducted in the second experimental year (Figures 2, 3 and 4). This “tail” may represent diffusion of the tracer in dead zones inside the reactor or retention due to interactions between the Li+, the biomass and/or support material of the ASBF. In addition to advance of the peaks observed in all assays, also noted was the occurrence of small intermediate peaks, which may represent the existence of internal recirculation in all units evaluated (Levenspiel, 2000).
Figure 2: Variation of lithium chloride concentrations over time in effluent samples from UASB1 – First and
Second experimental year.
Figure 3: Variation of lithium chloride concentrations over time in effluent samples from UASB2 – First and
Carvalho et al. (2008), when working with a UASB reactor using eosin Y as a tracer, also observed the slow decay of the tracer concentration as a function of time, relating it to diffusion phenomena in dead zones of the reactor, adsorption of the tracer by the reactor biomass or hydraulic short circuits.
Peña, Mara and Vella (2006) studied, by means of pulse-type stimulus-response tests, with a lithium chloride tracer, the hydrodynamic behavior of a UASB reactor with 296 m3 volume. The authors observed the occurrence of
the “tail” phenomenon, attributing the effect to stagnation of some areas inside the reactor. Ji et al. (2012), Lourenço and Campos (2009), Sarathai, Koottatep and Morel, (2010) also observed the same phenomenon.
The mass recovery values obtained for the tracer injected in the UASB1, UASB2 and ASBF reactors, for assays carried out in the first and second year, were: 43%, 54% and 57%, and 27%, 26% and 29%, respectively.
The tracer mass recovered by Sarathai, Koottatep and Morel, (2010) varied in all experimental conditions, from 50% to 97% of the injected mass. The authors considered the values low when compared to values observed in literature (>95%). However, the indicated that greater attention should be given to the RTD trend curve, since the shape of the curve allows for interpreting important information regarding predominant mechanisms, such as stagnant areas, short circuits and others.
Table 6 presents the results obtained with adjustment of the distribution curves of residence time to uniparametric models of low-intensity dispersion (PD), high-intensity (GD) and continuous stirred tank reactor in series (multi-CSTR) for the UASB1, UASB2 and ASBF
reactors, obtained in the first and second experimental years (Levenspiel, 2000).
It is observed in the test performed in the first experimental year that the real HRT, obtained by means of the RTD curve, was below the theoretical HRT, which was probably due to formation of preferential paths. In the test carried out during the second experimental year, it was noted that the HRT real was greater than the HRT theoretical by 36%, 100% and 41% for UASB1, UASB2 and ASBF, respectively. These results show delay in the response of the tracer, which may be linked to adsorption of the tracer by the biomass, or the existence of internal recirculation zones or dead zones inside the UASB reactors and ASBF, characterized by isolated or inaccessible regions where the imprisoned fluid does not interact with active regions. The tracer potentially diffused in these dead zones, being released gradually, which caused delay in its response in the output of the experimental units and generated the long tail phenomenon, as was observed in the experimental curves (Figures 2, 3 and 4).
Méndez-Romero et al. (2011) evaluated the hydrodynamic behavior of an anaerobic fixed bed reactor at the laboratory scale, with volume of 5.5 L, operated with varying flow rate and HRT ranging from 0.5 d to 2 d. The reactor was fed with poultry slaughterhouse wastewater and stimulus-response tests were performed with the pulse-type tracer rhodamine B. The authors observed delay in the response of the tracer, with values of real HRT (0.5 d, 1.67 d, 4.17 d and 7.5 d) greater than the theoretical HRT (0.5 d, 1 d, 1.5 d, 2 d), attributed to tracer adsorption on the biomass.
Figure 4: Variation of lithium chloride concentrations over time in effluent samples from ASBF-First and Second
Lourenço and Campos (2009), when studying the hydrodynamic behavior of a UASB reactor on a bench scale (12.1 L), operated with flow rate of 24.72 L d-1 and HRT of 0.5 and using a pulse-type stimulus-response test with lithium chloride (LiCl), also observed delays in response by the tracer and found a real HRT of 1.58 d, greater than the theoretical HRT (0.5 d). They also attributed the incident to adsorption of the tracer by the biomass.
Sarathai, Koottatep and Morel, (2010) found that the values of real HRT (0.83 d, 1.29 d and 1.75 d) were lower than those of the theoretical HRT (1 d, 1.5 d, 2 d), indicating the existence of preferential channels within the reactor. The authors used lithium chloride (LiCl) as a tracer to assess the hydrodynamic behavior of an anaerobic baffled reactor (ABR) with volume of 92.4 L, operated with the HRTs of 1 d, 1.5 d and 2 d.
Observing the data in Table 6, it is noted that the theoretical model of the multi-CSTR provided results of number tanks in series (N) for UASB1, UASB2 and ASBF reactors equal to 2.5, 2.3 and 1.2 (first year) and 1.1, 1.4 and 0.9 (second year), respectively. Values of the dispersion number (D/uL) verified in low and high-intensity dispersion models were high, indicating large longitudinal dispersion of the fluid and high degree of mixing within the experimental units. The dispersion number of the PD model obtained for the experimental units, with the exception of UASB1 and UASB2 (first year), was greater than 0.25, indicating flow with high-intensity dispersion. For the reactors UASB1 and UASB2, in the first experimental year, the dispersion intensity may be regarded as average (moderate), because it was between 0.05 and 0.25 (Metcalf; Eddy, 2003). The number of cells in series (N) reinforces this concept, where the lower this value the greater the degree of mixing.
The higher values of average effluent flow rate in the second year compared to the first experimental year, resulted in a reduced N for UASB and ASBF reactors and increased value of D/uL for low and high intensity dispersions. It was noted that for an average flow rate of approximately 72 L d-1 and taking into account the low height/diameter ratio, the hydrodynamic behavior of the UASB and FBAS reactors approached the complete mixing reactor.
When observing the variables, dispersion coefficients (d) and number of tanks in series (N), it is noted that increasing the flow in the second year had an influence on the flow pattern of the UASB reactors. The increased flow results in an increased velocity range, which may have resulted in greater mixing within these units. For the FBAS no difference was observed, since the flow regime in this unit tends to be of complete mixing, due to aeration. According to Arceivala (1981), Levenspiel (2000) and Di Iaconi et al. (2005), the biogas production rate, the liquid velocity, the geometry of the reactor, the depth of the sludge blanket, among other factors can influence the mixing pattern and consequently its hydrodynamic behaviour in the UASB reactor. Therefore, different reactor designs and operating conditions can result in different flow patterns (Ren et al., 2009).
Lourenço and Campos (2009) also observed a hydrodynamic behavior trending toward flow with high-intensity dispersion to a UASB reactor, with dispersion coefficient of 0.2675. Peña, Mara and Vella (2006) found hydrodynamic behavior trending toward complete mixing flow to a UASB, with dispersion coefficients ranging from 0.15 to 0.66.
Carvalho et al. (2008), observed for a UASB reactor behavior similar to complete mixing with 4 and 5 complete Table 6: Results obtained with adjustment of the distribution curves of residence time to uniparametric models
of low dispersion (PD), high dispersion (GD) and continuous stirred tank reactor in series (multi-CSTR) for the UASB1, UASB2 and ASBF reactors, obtained in the first and second experimental year.
Year Reactor HRT
theoretical (d)
HRT
real (d)
multi-CSTR
(N) (D/uL)PD
GD (D/uL)
Determination Coefficient (R2)
multi-CSTR PD GD
I
UASB1 1.80 1.23 2.5 0.2027 0.1331 0.6025 0.2388 0.0260
UASB2 1.80 1.16 2.3 0.2180 0.1398 0.8623 0.3226 0.0926
ASBF 1.52 0.77 1.2 0.4134 0.2200 0.9898 0.3760 0.0868
II
UASB1 0.22 0.30 1.1 0.4425 0.2303 0.8346 0.5295 0.4495
UASB2 0.18 0.36 1.4 0.3452 0.1942 0.7228 0.4344 0.4998
mixing reactors (multi-CSTR) in series. The low-intensity dispersion coefficients were 0.112 and 0.121, and 0.075 and 0.079 for high intensity. Rincón, Galindo and Pérez, et al. (2011) obtained a dispersion number ranging from 0.140 to 0.270 for the PD model and 0.102 to 0.163 for GD. Thus, it should be noted that the values found in this work are within the range of values observed in literature.
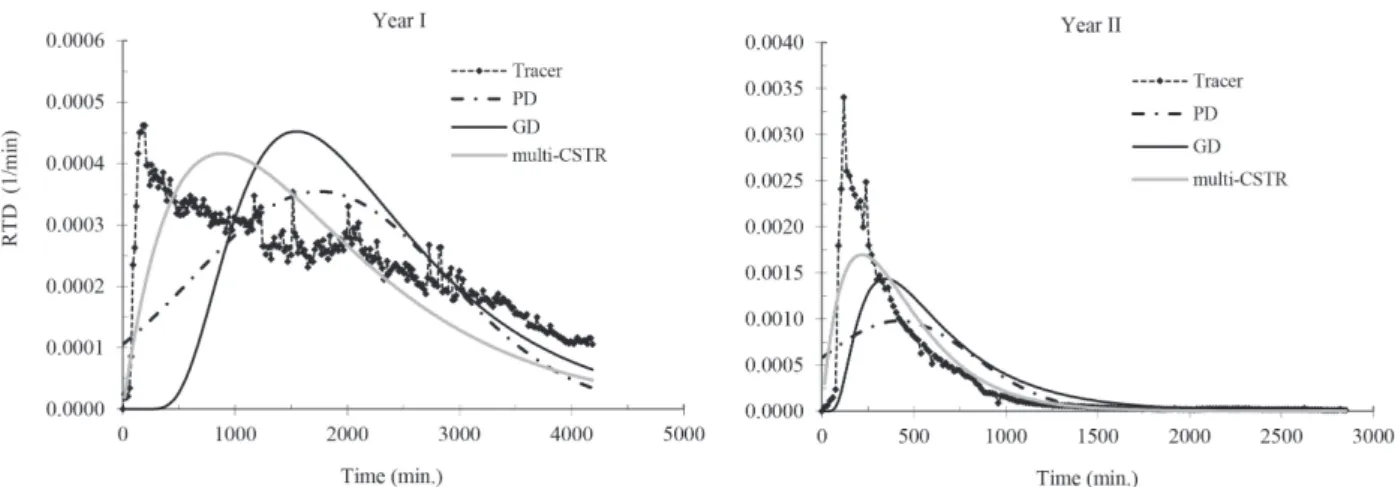
From examination of the RTD curves (Figures 5, 6 and 7) and the determination coefficients (Table 6), one can observe that the uniparametric model multi-CSTR presented the best fit to the experimental data. The uniparametric dispersion models of PD and GD did not adjusted well to the experimental data, due to the low R2 values. Although
the fit of these models was not satisfactory in relation to the experimental values due to the wide dispersion in relation to the experimental values, the assays also did not meet one of the premises for the application of the dispersion models (D/uL < 0.01 and identical dispersion within and outside the control volume) (Levenspiel, 2000).
The high longitudinal dispersion (D/uL) observed in the units evaluated by application of the PD and GD models and the best fit of the experimental data by the multi-CSTR model compared to the other models, in addition to reducing the height/diameter ratio, reinforces that the predominant flow regime in the UASB1, UASB2 and FBAS reactors was complete mixing.
Figure 5: Results of statistical adjustments of tracer data to uniparametric low-intensity dispersion (PD), high-intensity dispersion (GD) and continuous stirred tank reactor in series (multi-CSTR) models for the UASB1 – First
and Second experimental year.
Figure 6: Results of statistical adjustments of tracer data to uniparametric low-intensity dispersion (PD), high-intensity dispersion (GD) and continuous stirred tank reactor in series (multi-CSTR) models for the UASB2 – First
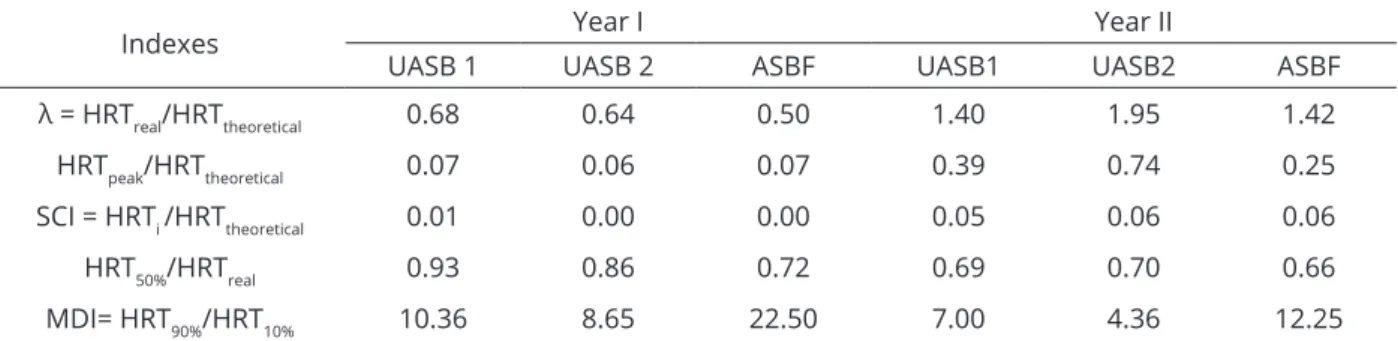
Some indexes used for careful assessment of the hydraulic performance of the experimental units, according to Metcalf and Eddy (2003), as well as interpretation of results, can be found in Table 7.
From the index that evaluates the volumetric efficiency (λ), it can be observed that in the UASB1, UASB2 and ASBF reactors both short circuits and dead zones occurred, since the values were different from 1, which according to Metcalf and Eddy (2003) would indicate the integral use of the treatment volume.
The relationship between the time modal (time at which the peak concentration of the tracer is logged), and the theoretical residence time (HRTpeak/HRTtheoretical) was
less than 1, which suggests non-uniform flow distribution, with a tendency to complete mixture.
The SCI values less than 1 confirm the presence of short circuits on all evaluated units with mixing tending toward completely mixed flow, since the SCI obtained was close to zero (Table 7).
The presence of stagnant areas was detected in all units (HRT50%/HRTreal < 1). It is also observed that the presence of dead zones was higher in all the units evaluated in the second year, since the values were lower than those obtained in the first year, which reinforces the “tail” phenomenon especially observed in the second year (Figures 2, 3 and 4).
Figure 7: Results of statistical adjustments of tracer data to uniparametric low-intensity dispersion (PD), high-intensity dispersion (GD) and continuous stirred tank reactor in series (multi-CSTR) models for the ASBF-first and
second experimental year.
Table 7: Summary of the results for indexes used to complement the hydrodynamic evaluation of experimental units.
Indexes Year I Year II
UASB 1 UASB 2 ASBF UASB1 UASB2 ASBF
λ = HRTreal/HRTtheoretical 0.68 0.64 0.50 1.40 1.95 1.42
HRTpeak/HRTtheoretical 0.07 0.06 0.07 0.39 0.74 0.25
SCI = HRTi /HRTtheoretical 0.01 0.00 0.00 0.05 0.06 0.06
HRT50%/HRTreal 0.93 0.86 0.72 0.69 0.70 0.66
MDI= HRT90%/HRT10% 10.36 8.65 22.50 7.00 4.36 12.25
Based on the MDI value, it was noted that in the test carried out in the first year only the ASBF presented a MDI value exceeding 22 (Table 7), indicating a tendency toward completely mixed flow. The values obtained for the other units, in the two experimental years, varied between 1 and 22, which suggests a tendency to dispersed flow with high intensity. It was noted that the highest values were obtained for the ASBF, which was already expected due to aeration conditions imposed upon it.
In evaluation of the data, the occurrence of high intensity dispersed flow for UASB1 and UASB2 was observed in the first year, along with a flow regime tending toward completely mixed to the ASBF. With increasing flow applied in the second year, there was the occurrence of complete mixture to all units evaluated.
The multi-CSTR model with some degree of short circuit, dead zones and flow deviations seems to describe the hydrodynamics of the UASB reactors. Studies on the hydrodynamics of UASB reactors have shown that these are best described by the model of multi-CSTR (Ren et al., 2009; Zheng et al., 2012), with some short circuits, dead zones and flow diversions (bypass). However, there are few reports in literature concerning ASBF hydrodynamic
models, requiring further studies to consolidate the model
that best fits this reactor type.
CONCLUSIONS
The RTD curves show peak tracer concentrations at the beginning of the curves, indicating the presence of preferential paths. With the hydrodynamic tests it was possible to conclude that the predominant flow regime in UASB1, UASB2 and FBAS was complete mixing. The dispersion coefficients for PD, GD and number of tanks in series for multi-CSTR models obtained for UASB1, UASB2 and ASBF were 0.20, 0.13 and 2.5; 0.22, 0.14 and 2.3, 0.41; 0.22 and 1.2 (first year), and 0.44, 0.23 and 1.1; 0.34, 0.19 and 1.4; 0.53, 0.26 and 0.9 (second year), respectively. The dispersion number values (D/uL) recorded for the low-intensity dispersion and high-low-intensity dispersion models were elevated, indicating large longitudinal dispersion of the fluid and a high degree of mixing within the units. Finally it was noted that the multi-CSTR model showed the best fit with the experimental data. With regard to the anomalies, the presence of dead zones and short circuits was reported in all units of the system.
AKNOWLEDGMENT
The authors gratefully acknowledge the financial support of this project, especially the agencie CNPq.
REFERENCES
ARCEIVALA, S. J. Wastewater Treatment and Disposal. New York and Basel: Marcel Dekker Inc. 1981. 892 p.
CARVALHO, K. Q. et al. Avaliação hidrodinâmica de reator UASB submetido à variação cíclica de vazão. Engenharia Sanitária e Ambiental. 13(2):226-235, 2008.
DI IACONI, C. et al. Hydraulic shear stress calculation in a sequencing batch biofilm reactor with granular biomass. Environmental Science and Technology. 39:889-894, 2005.
JIANG, J. et al. Multiscale hydrodynamic investigation to intensify the biogas production in upflow anaerobic reactors. Bioresource Technology. 155:1-7, 2014.
JI, J. et al. Hydraulic characteristics and their effects on working performance of compartmentalized anaerobic reactor. Bioresource Technology. 116:47-52, 2012.
LEVENSPIEL, O. Engenharia das Reações Químicas. 3.ed. São Paulo: Ed. Edgard Blücher Ltda, 2000, 563 p.
LIU, R.; TIAN, Q.; CHEN, J. The developments of anaerobic baffled reactor for wastewater treatment: A review. African Journal of Biotechnology. 9(11):1535-1542, 2010. LIU, X. et al. Hydrodynamic characteristics of a
four-compartment periodic anaerobic baffled reactor. Journal of Environmental Sciences. 19:1159-1165, 2007.
LOURENÇO, A. M. P.; CAMPOS, C. M. M. Hydrodynamic behavior of a lab-scale upflow anaerobic sludge blanket reactor (UASB) operated with an adopted hydraulic retention time (HRT) of 12 hours. Ciência e Agrotecnologia. 33(4):1139-1144, 2009.
MANSOURI, Y. et al. Hydraulic characteristics analysis of an anaerobic rotatory biological contracto (AnRBC) using tracer experiments and response surface methodology (RSM). Korean Journal of Chemical Engineering. 28(7):891-902, 2012.
MATANGUE, M. T. et al. Hydrodynamic behaviour of a pilot scale anaerobic baffled reactor treating SWINE wastewater from farming. Journal of Soil Science and Environmental Management. 7(1):1-9, 2016.
MÉNDEZ-ROMERO, D. C. et al. Hydrodynamic and kinetic assessment of an anaerobic fixed-bed reactor for slaughterhouse wastewater treatment. Chemical Engineering and Processing. 50:273-280, 2011.
PEÑA, M. R.; MARA, D. D.; AVELLA, G. P. Dispersion and treatment performance analysis of an UASB reactor under different hydraulic loading rates. Water Research. 40(85):445-452, 2006.
REN, T. et al. Hydrodynamics of upflow anaerobic sludge blanket reactors. AIChE Journal. 55(2):516-528, 2009. RENUKA, R. et al. Hydrodynamic behaviour and its effects
on the treatment performance of panelled anaerobic baffle-cum filter reactor. International Journal of Environmental Science and Technology. 13:307-318, 2016.
RINCÓN, N.; GALINDO, A.; PÉREZ, J. Evaluación del comportamiento hidráulico en un reactor anaerobio de doble cámara (RADCA). Revista Facultad de Ingeniería Universidad de Antioquia. 61:53-63. 2011.
SARATHAI, Y.; KOOTTATEP, T.; MOREL, A. Hydraulic characteristics of an anaerobic baffled reactor as onsite wastewater treatment system. Journal of Environmental Sciences. 22(9):1319-1326, 2010.