1
Universidade Federal da Paraíba, Departamento de Nutrição, Programa de Pós-Graduação em Modelos de Decisão e Saúde. Campus Universitário I, 58051-900, João Pessoa, PB, Brasil. Correspondência para/Correspondence to: RLFC LIMA. E-mail: <[email protected]>.
2
Universidade Federal da Paraíba, Departamento de Morfologia, Programa de Pós-Graduação em Modelos de Decisão e Saúde. João Pessoa, PB, Brasil.
3
Universidade Federal da Paraíba, Centro de Ciências da Saúde, Programa de Pós-Graduação em Enfermagem. Paraíba, PB, Brasil.
4
Universidade Federal da Paraíba, Departamento de Estatística, Programa de Pós-Graduação em Modelos de Decisão e Saúde. João Pessoa, PB, Brasil.
Self-reported and measured weight,
height and body mass index for the
diagnosis of the nutritional status in
people living with HIV/AIDS
Medidas de peso, altura e índice de massa
corporal referidos e aferidos para diagnóstico
de estado nutricional em pessoas
vivendo com HIV/AIDS
Rafaela Lira Formiga Cavalcanti de LIMA1
Amira Rose Costa MEDEIROS2
Leidyanny Barbosa de MEDEIROS3
Amanda Amaiy Pessoa SALERNO1
Ronei Marcos de MORAES4
Rodrigo Pinheiro de Toledo VIANNA1
A B S T R A C T
Objective
To validate self-reported weight and height data for people living with HIV/AIDS. Methods
height measured. The intraclass correlation coefficient was calculated to determine the relationship between the self-reported and measured weight, height and body mass index values, and linear regression analysis was used to generate equations to predict weight and height. It were significant p-value under 5% for statistic tests applied.
Results
In the sample with measured values, 57.6% of men, with a mean age of 44 years old and a mean income per capita equivalent to US$145.50, high correlations (r>0.90) between the self-reported and measured values for weight, height and body mass index were observed. The accuracy was 92.6%, and the Kappa coefficient was greater than 0.85. Women tended to underestimate weight and overestimate height. The men overestimated weight and underestimated height. The intraclass correlation coefficients were greater than 0.95.
Conclusion
The use of self-reported measures of weight, height and body mass index for nutritional assessment of people living with HIV/AIDS is valid and must be considered for similar populations when time and resources are limiting factors.
Keywords: Body mass index. Body weights and measures. HIV.
R E S U M O
Objetivo
Validar dados autorreferidos de peso e altura de pessoas vivendo com HIV/AIDS. Métodos
Estudo seccional envolvendo 481 pessoas vivendo com HIV/AIDS atendidas em serviço de referência de João Pessoa, Paraíba, entre setembro a dezembro de 2015, dos quais 99 (20,5%) tiveram seu peso e altura aferidos. Calculou-se o coeficiente de correlação intraclasse para medir a relação entre as medidas referidas e aferidas de peso, altura e índice de massa corporal e utilizou-se regressão linear para construção de equações de predição do peso e altura. Foi significativo o valor de p menor que 5,0% para os testes estatísticos aplicados.
Resultados
Na amostra com medidas aferidas 57,6% homens, com idade média de 44 anos e renda per capita média equivalente a US$145,50. Observou-se alta correlação (r>0,90) entre as medidas referidas e aferidas de peso, altura e índice de massa corporal. A acurácia foi de 92,6% e a estatística Kappa foi superior a 0,85. As mulheres tendem a subestimar o peso e a superestimar a altura. Os homens superestimaram o peso e subestimaram a altura. Os coeficiente de correlação intraclasse foram superiores a 0,95.
Conclusão
A utilização de medidas autorreferidas de peso, altura e índice de massa corporal para avaliação nutricional em pessoas vivendo com HIV/AIDS é válida, e deve ter a sua utilização considerada quando a economia de tempo e recursos forem fatores limitantes, em populações semelhantes.
Palavras-chave: Índice de massa corporal. Pesos e medidas corporais. HIV.
I N T R O D U C T I O N
Self-reported measures of weight and height have been increasingly used owing to their simplicity, low cost and speed, but bias that may occur according to the characteristics of the individuals [1-6]. Therefore, the validation of self-reported anthropometric data constitutes an important academic discussion [7].
meet socially valued body aesthetics [10]. Sociocultural [17] and health characteristics, including household income [9], education level [18], gender, ethnicity, age, size of the individual [4], smoking status and anthropometric aspects [19], may also influence the quality of the self-reported data [20].
While the self-reported weight and height method is appropriate for adults, it cannot be used for elderly individuals over 60 years old, since they demonstrably tend to overestimate their height [21]. A wrong weight and height estimate leads to a variation in the resulting Body Mass Index (BMI), used as a parameter for anthropometric classification, thus leading to errors in prevalence estimates of overweight and obesity in population studies. To address this bias, it is necessary to validate the self-reported measures of weight and height [8,10,22,23].
The positive and promising point is that a high sensitivity and specificity have been observed for classifications based on BMIs calculated using self-reported measures when compared to BMIs calculated from measured values [10,24]. However, these validations must take into account characteristics such as age, education level, income and the BMI of the population studied [8,10,24].
A specific vulnerable population group includes People Living With HIV/AIDS (PLWHA), and nutritional assessment constitutes a fundamental tool for decisions related to treatment and follow-up of these individuals [25], particularly because overweight has become the new nutritional problem in this group, surpassing low weight [26].
The possibility of using measures self-reported by PLWHA is an alternative that simplifies and saves time and resources and enables more frequent monitoring, but it requires validation, despite studies using these measures in their methodologies without concern for their validation [27-29]. The validation work conducted by Duran et al. [30]. in a sample of PLWHA in the state of São
Paulo constitutes an exception, showing good reliability and validity between the self-reported measures of weight and height when compared to their respective measured values. Authors recommend generating predictive equations based on the measured values of a subsample to increase the reliability and accuracy of the self-reported measures [4,30].
Therefore, the objectives of this study were to evaluate the validity of the weight and height data that are self-reported by PLWHA living in the Northeast region of Brazil, to determine the agreement and validity of the self-reported and measured values and to evaluate the sensitivity, specificity and predictive values of the individuals’ nutritional status diagnoses
obtained from self-reported measures, from measures corrected with their own (sample-specific) equations and from measures corrected with equations proposed by Duran et al. [30], all compared to the calculations made using the measured values.
M E T H O D S
A cross-sectional study, with prospective data colection was conducted with a sample of 481 PLWHA receiving antiretroviral therapy and followed up at the Clementino Fraga Infectious Diseases Hospital Complex in João Pessoa (PB), a reference unit in the care of these patients in the state of Paraíba. Patient selection was conducted through recruitment of all individuals who were seen at the unit from September 2, 2015 to December 23, 2015. This time period was selected independently of any department planning, representing a routine activity period at the hospital.
All patients were interviewed face-to-face by previously trained students and completed a structured questionnaire covering the following sociodemographic information: (a) sex: female and male; (b) age on the day of the interview in full years; (c) occupation: has an occupation/ active (employed, self-employed, student), has no occupation (unemployed, homemaker, retired or pensioner); (d) affective status: lives with partner, does not live with partner; (e) education level: incomplete elementary school, complete elementary school or higher; (f) household income, estimated as an absolute value; (g) number of people in the household in absolute value or categories: up to three residents in the household or more than three residents in the household, (h) income per capita (obtained as the household income divided by the number of individuals in the household) in absolute value and categories: up to half the minimum wage or more than half the minimum wage. The durations of disease and receiving antiretroviral therapy use were also obtained from the respective medical records, and weight and height were self-reported. Self-reported data were obtained through the questions: “What is your weight?” and “What is your height?”. Thirty-three patients (6.9%) were excluded from the total sample because they did not know their weight and height.
Two of every 10 recruited individuals, starting from the first eleventh who came in the hospital, were systematically selected from the total sample included in the study. The sample size was based on the minimum sensitivity or specificity expected for the diagnostic test, as 80% and 5% precision, at 95% confidence interval. For this parameters it was necessary at least 163 measures. Forming a subgroup of 99 people who had their weight and height measured properly, we analyzed 198 measures. Each person in the sub sample did not know that he/she will be measured after self-answered his/ her height and weight. An electronic scale with a maximum capacity of 150kg and a sensitivity
of 100g (Filizola®, São Paulo, SP, Brazil) was used to measure weight. The individuals were weighed wearing light clothes and no shoes, standing and with their feet parallel, entirely supported on the scale’s platform, and with
their arms along their bodies [31]. Height was measured using the scale-coupled stadiometer, which consists of a steel tube with an anodized aluminum ruler, measuring from 97cm to 192cm with 0.5cm increments. The individuals were standing, with their feet together and their heels touching the wall. The ear tip and the external eye corner were parallel to the floor, forming an angle of 90° with the stadiometer bar; the horizontal stadiometer bar was then lowered and supported by the head, allowing readings in centimeters [31].
The body mass index was calculated by dividing weight, in kg, by height squared, in meters. The values obtained were categorized as underweight, normal weight, overweight or obese according to the cutoff values established by the World Health Organization [32].
The study was approved by the Research Ethics Committee of the Health Sciences Center, Universidade Federal de Paraíba, under Protocol nº 0284/15. All of the ethical considerations established in Resolution nº 466/12 [33] were followed, and all of the participants consented to participate in the study by signing an Informed Consent Form.
The sample was described using central tendency and dispersion measures. The Kolmogorov-Smirnov test was used to confirm the normality of the continuous variables weight, height and BMI.
[34]. The Lin’s Concordance Coefficients were
calculated to estimate of how well a new measurement reproduces a gold standard test. It quantifies the agreement between these two measures of the same variable [35].
The agreement between the self-reported and measured values was evaluated through analysis of the mean differences between the methods with their limits of agreement, according to the method proposed by Bland & Altman [36]. A plot of agreement between the mean and the difference between the measures was generated, enabling the evaluation of the magnitude of the differences and the respective 95% Confidence Intervals [37].
The predictive equations for weight and height were generated from the self-reported values using the linear regression method, using as a response variable the referred measures, and as an explanatory variable the measures measure [38]. Sensitivity, specificity and positive and negative predictive values were calculated for validation by comparing the values measured against the following datasets: (a) self-reported measures; (b) measures corrected with their own predictive equation and, (c) measures corrected with the predictive equation by Duran et al. [30]. The degree of agreement between measures was evaluated using the Kappa coefficient. All of the statistical analyses were performed using the statistical package Stata SE (College Station, Texas, United States), version 14 and it were significant p-value under 5% for statistic tests applied.
R E S U L T S
A total of 99 PLWHA were evaluated, with the majority being men (57.6%), with a mean age of 44 years old and a mean income per capita of R$538.50 (equivalent to US$145.50). The mean time since diagnosis for these individuals was 6.9 years (Standard Deviation [SD]=5.57), and the mean duration of receiving antiretroviral therapy use was 6 years (SD=5.33). There were no statistically significant differences
(Chi-square test) between the total sample and the subsample, which had their values measured, for the variables sex, age, income per capita, affective status, time since diagnosis and duration of receiving antiretroviral therapy. The only statistically significant difference (p=0.035) between these two groups was the fact that the subsample presented a lower frequency of individuals with higher education level.
The continuous variables, weight, height and BMI, measured and self-reported, showed normal distribution according Kolmogorov-Smirnov test.
Upon calculating the linear regression, the following predictive equations for weight and height were generated for the sample according to sex (57 men and 42 women), with their respective coefficients of determination:
Predictive equations for women:
Measured weight=0.713 + (0.998 * Self-reported
weight) r2=0.985
Measured height=0.431 + (0.719 * Self-reported
height) r2=0.621
Predictive equations for men:
Measured weight = 1.814 + (0.975 * Self-reported
weight) r2=0.979
Measured height = 0.083 + (0.945 * Self-reported
height) r2=0.855
High correlations were observed (r>0.90) between the self-reported and measured values for weight, height and BMI since the ICCs presented values very close to 1, indicating high reliability between these measures. The ICC values for the self-reported measures, the measures corrected with the predictive equations obtained with the sample itself and the measures corrected using the equations proposed by Duran et al. [30], when comparing with the measured values, are almost similar.
In the Bland & Altman [36] analyses (Figure 1), a good agreement was observed between the self-reported and measured values; practically all of the data points in the scatter plots are within the limits of agreement for the weight, height and BMI measures. People showing the highest weights have a greater tendency to underestimate weight than other individuals, which partly has effects on the BMI.
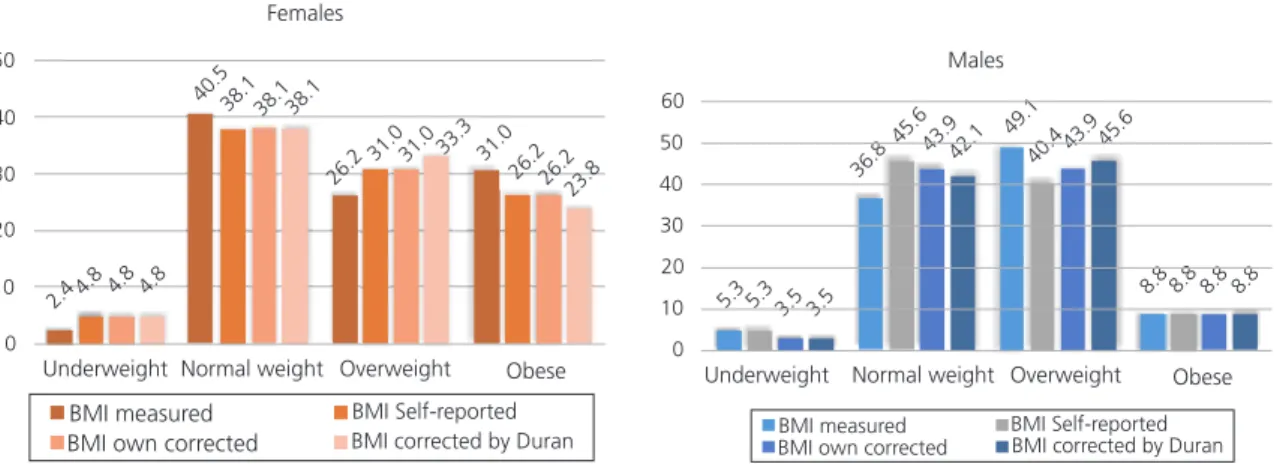
Nutritional status was diagnosed using the self-reported measures, the measures corrected
based on the predictive equations generated with the sample partitioned by sex and the correction equations proposed by Duran et al. [30] (Figure 2). Based on the self-reported measures, the prevalence of low weight in the sample was small, approximately 4.0%. This value precluded the calculations of sensitivity, specificity and predictive values for those individuals. The prevalence rates of overweight and obesity were 26.2% and 31.0% for women and 49.1% and 8.8% for men, respectively.
For individuals diagnosed as normal and overweight, the diagnostic test evaluation measures were calculated (Table 3). The four underweight patients, based on the self-reported measures, were excluded from the calculation. The sensitivity, which represents the proportion of individuals effectively with normal weight or overweight who were diagnosed using the self-reported and the corrected measures as such, was high-namely, higher than 90.0% for
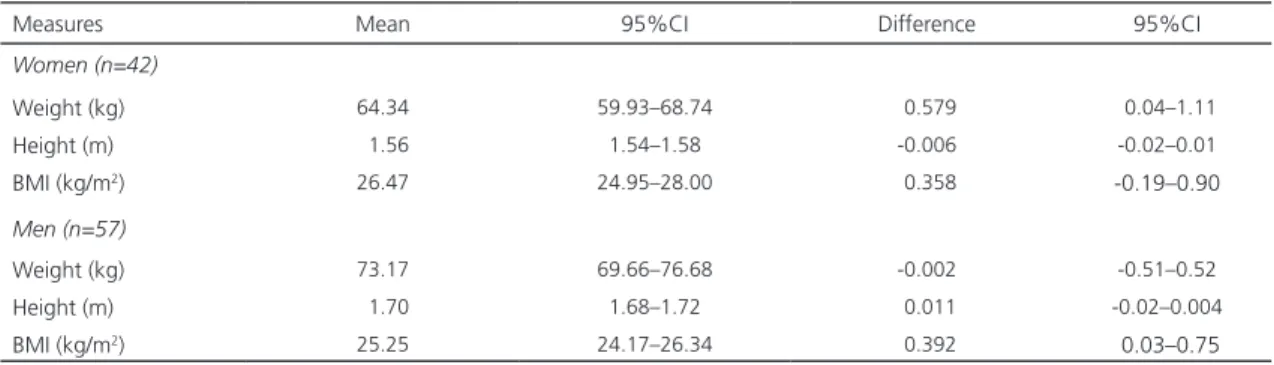
Table 1. Means and confidence intervals for all values (measured and self-reported) of differences between self-reported and measured values among People Living With HIV/AIDS (PLWHA), by sex. João Pessoa (PB) Brazil, 2015.
Measures Mean 95%CI Difference 95%CI
Women (n=42)
Weight (kg) 64.34 59.93–68.74 0.579 0.04–1.11
Height (m) 1.56 1.54–1.58 -0.006 -0.02–0.01
BMI (kg/m2) 26.47 24.95–28.00 0.358 -0.19–0.90
Men (n=57)
Weight (kg) 73.17 69.66–76.68 -0.002 -0.51–0.52
Height (m) 1.70 1.68–1.72 0.011 -0.02–0.004
BMI (kg/m2) 25.25 24.17–26.34 0.392 0.03–0.75
Note: BMI: Body Mass Index; 95%CI: 95% Interval de Confiance.
Table 2. Intraclass Correlation Coefficients (ICCs) and Lin’s Concordance Coefficients (LC) between the self-reported values and measured values, corrected with their own equation and the equation by Duran in People Living With HIV/AIDS (PLWHA).
João Pessoa (PB) Brazil, 2015 (N=99).
Measures Weight Height BMI
ICCs LC ICCs LC ICCs LC
Self-reported 0.996 0.991 0.964 0.930 0.969 0.940
Own correction 0.996 0.992 0.969 0.933 0.974 0.945
Figure 1. Bland and Altman plots for the limits of agreement of self-reported and measured weight, height and Body Mass Index (BMI) in People Living With HIV/AIDS (PLWHA). João Pessoa (PB), Brazil (2015; N=99).
Figure 2. Diagnosis of the nutritional status in People Living With HIV/AIDS (PLWHA) according to the values self-reported, measured and corrected with their own equation or the Duran equation. João Pessoa (PB), Brazil (2015; N=99).
40,00 60,00 80,00 100,00
Measur
ed weight minus self-r
eported
body weight (kg)
10,00
7,50
5,00
2,50
00
-2,50
Mean body weight
,20
,10
,00
-,20
-,30 -,10
1,40 1,50 1,60 1,70 1,80 1,90
Mean height
Measur
ed height minus self-r
eported weight (m)
Measur
ed BMI minus self-r
eported BMI (kg/m
)
15,00 20,00 25,00 30,00 35,00 40,00
Mean BMI (kg/m )
5,00
2,50
,00
-2,50
-5,00
-7,50
2
2
50
40
30
20
10
0
Underweight Normal weight Overweight Obese
BMI measured BMI Self-reported
BMI own corrected BMI corrected by Duran
2.44.8 4.8 4.8
Females
40.538.1
26.2
31.0 33.3 31.0 26.226.2
23.8 38.1 38.1
31.0
5.3 5.3 3.5 3.5 36.8
45.643.942.1 49.1 40.443.9 45.6
8.8 8.8 8.8 8.8
60
50
40
30
20
10
0
Males
Underweight Normal weight Overweight Obese
BMI measured
normal weight and overweight for all measures (reported, corrected based on the sample-specific equations and corrected using the equations generated by Duran et al. [30]).
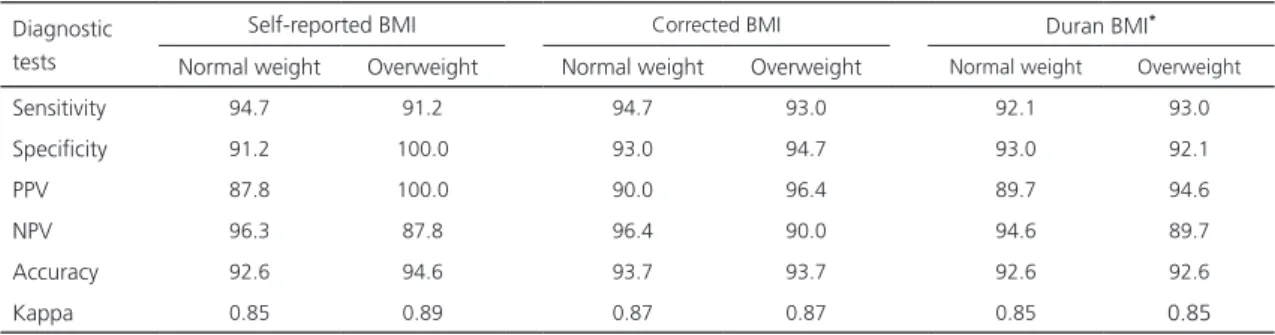
Specificity represents the proportions of individuals classified as not having normal weight or being overweight using the self-reported measures and who in fact do not have the classified condition. All of the values were higher than 90.0%, and the self-reported BMI classification for overweight individuals was perfect (100.0%). The positive and negative predictive values were all higher than 85.0%. Accuracy presented equal values (92.6%) for all measures, except for overweight diagnosed from the self-reported BMI, which showed a higher value (94.6%). The degrees of agreement of the measures, evaluated using the Kappa coefficient, presented the same accuracy trend and were considered to be very good, all equal to 0.85, except overweight diagnosed by the self-reported BMI, which showed a higher value of 0.89.
D I S C U S S I O N
The results presented in this study suggest that weight and height data self-reported by PLWHA are valid for the diagnosis of nutritional status and thus corroborate the
Table 3. Sensitivity, specificity, positive predictive value, negative predictive value, accuracy and Kappa coefficient of the BMIs calculated from self-reported and self-reported and corrected values of weight and height in People Living With HIV/AIDS (PLWHA), compared with the Body Mass Index (BMI) calculated from measured values. João Pessoa (PB) Brazil, 2015.
Diagnostic tests
Self-reported BMI Corrected BMI Duran BMI*
Normal weight Overweight Normal weight Overweight Normal weight Overweight
Sensitivity 94.7 91.2 94.7 93.0 92.1 93.0
Specificity 91.2 100.0 93.0 94.7 93.0 92.1
PPV 87.8 100.0 90.0 96.4 89.7 94.6
NPV 96.3 87.8 96.4 90.0 94.6 89.7
Accuracy 92.6 94.6 93.7 93.7 92.6 92.6
Kappa 0.85 0.89 0.87 0.87 0.85 0.85
Note: *BMI corrected with the equations proposed by Duran et al. [30]. PPV: Positive Predictive Value; NPV: Negative Predictive Value.
validation of BMI use in the identification and monitoring of the nutritional status of these individuals, as reported in a prior study [30]. Therefore, the recognition of the use of these data as a valid tool for the nutritional assessment of these individuals may constitute an important indicator in the clinical follow-up of PLWHA, in addition to be rapid, convenience and low cost. When incorporated into the follow-up routine, this assessment can promote empowerment and self-care among these individuals.
Although there have been few studies conducted for this purpose, the results obtained in this study can fortunately be compared to those obtained in the study by Duran et al. [30] since the samples presented similar sociodemographic and clinical characteristics. Therefore, it was possible to apply and compare the equations generated in the first study together with the new equations proposed in this study. An important methodological approach adopted in this study, and which did not add much complexity from the practical point of view and regarding the use of mathematical equations, was to build two models stratified by sex. This approach improved the sensitivity of the normal weight classification and the specificity of the overweight classification.
Despite the improvement in the corrected data, the ICCs observed, which evaluate the relationship between the groups by comparing two paired measures, suffered few changes and presented good results for both the self-reported measures and the measures corrected using the equation proposed in this study or that previously proposed by Duran et al. [30]. In other studies, the use of correction equations reduced the mean difference but did not resolve difference variability, classification errors and association biases [20]. A positive aspect of the self-reported measures of weight and height among PLWHA is that no relevant variabilities were observed in the differences between the values for each individual, and the coefficients showed to have values close to 1, which would be the ideal situation.
The intraclass correlation coefficients observed were high and validated the use of self-reported BMI for similar population groups. Such an expressive result was not observed in prior studies with healthy adults or in studies conducted through phone surveys [13,39]. The fact that the PLWHA frequently visit the hospital for monitoring their clinical status and adjusting their receiving antiretroviral therapy may contribute to a greater knowledge of their weight, considering that this measurement is important for the adjustment of drug doses.
In this study, the information self-reported by the women led to an overestimation of their nutritional status for overweight and an underestimation for obesity, whereas the normal weight estimate was very close to the actual value measured. In the case of men, the trend was slightly different: the estimates of obesity were equivalent to the true value measured, but overweight was underestimated and normal weight was overestimated. In the women’s case,
it is possible that the self-reported weight was lower in cases of obesity, which would explain this variation. Among men, the high value they assign to height could be responsible for the bias observed between the levels of overweight
and normal weight, but this effect, if real, would also influence the classification of obesity, which did not occur. These considerations indicate that it would be necessary, in addition to using correction equations for weight and height, to consider the underestimations of weight for obese women and overweight men as potential sources of bias. These results were different from those obtained in a study conducted in women living with HIV/AIDS, which showed a tendency to overestimate their body weight [30]. Additional studies should be conducted, especially because this information is highly related to subjective aspects concerning self-image, cultural and social patterns and the exclusion stigma still associated with AIDS.
Although not representative, it is important to highlight the difference in the patterns of overweight presented between men and women. Although both present a frequency of approximately 58.0%, obesity exceeded cases of overweight among women, whereas obesity was five times less frequent than overweight among men and the overall frequency of underweight in the sample was low. These values are similar to those in other studies, for example, a study conducted among Brazilian individuals living with HIV/AIDS showed prevalence rates of underweight of 7.7% for women and 2.3% for men [26]. In a study conducted in the United States, a prevalence of overweight of more than 50.0% was observed for PLWHA [40].
Some study limitations could be addressed to sample process, which was not simple random sample, but systematic. It was an operational field work limitation due to select cases as they entry in the hospital main entrance. However it was expected that the interval of selection does not create bias, as showed in the comparison analysis. Subjective values, like self-image, cultural patters or prejudices, were not analyzed, and could have different impact on PLWHA and not-PLWHA self-reported answers.
C O N C L U S I O N
The use of self-reported measures of weight and height for BMI calculation and classification of the nutritional status for PLWHA is valid and may be deemed as a good alternative considering the economy of time and resources, particularly when they are scarce, either for the development of new studies or in clinical practice. The use of predictive equations for the correction of self-reported measures further improves the estimates, particularly when the sex of the PLWVH is taken into consideration. In addition to the corrections suggested, potential weight underestimation biases may occur among obese women and overweight men, although the estimate of overweight for the whole sample showed a specificity of 100%.
C O N T R I B U T O R S
All authors participated in formulating the research question and designing the study. RLFC LIMA and ARC MEDEIROS analyzed and interpreted the data, performed the literature review and guided the development of the manuscript. LBM and AAP SALERMO collected data. RM MORAES and RPT VIANNA analyzed and interpreted the data. All authors have read, revised and approved the final version of the manuscript.
R E F E R E N C E S
1. Virtuoso-Júnior JS, Oliveira-Guerra R. Concurrent validity of self-reported weight and height for
diagnosing elderly women’s nutritional status. Rev Salud Pública. 2010;12(1):71-81.
2. Wada K, Tamakoshi K, Tsunekawa T, Otsuka R, Zhang H, Murata C, et al. Validity of self-reported height and weight in a Japanese workplace population. Int J Obes. 2005;29(9):1093-9. 3. Niedhammer I, Bugel I, Bonenfant S, Goldberg
M, Leclerc A. Validity of self-reported weight and height in the French GAZEL cohort. Int J Obes Relat Metab Disord. 2000;24(9):1111.
4. Mozumdar A, Liguori G. Corrective equations to self-reported height and weight for obesity estimates among U.S. Adults: NHANES 1999– 2008. Res Q Exerc Sport. 2016;87(1):47-58. 5. Carvalho AM, Marchioni DML, Fisberg RM, Selem
SSC, Piovezan LG. Validation and calibration of self-reported weight and height from individuals in the city of São Paulo. Rev Bras Epidemiol. 2014;17(3):735-46.
6. Kee CC, Lim KH, Sumarni MG, Teh CH, Chan YY, Hafizah N, et al. Validity of self-reported weight and height: A cross-sectional study among Malaysian adolescents. BMC Med Res Methodol. 2017;17:85. https://doi.org/10.1186/s12874-017-0 362-0
7. Thomaz PMD, Silva EF, Costa TH. Validity of self-reported height, weight and body mass index in the adult population of Brasilia, Brazil. Rev Bras Epidemiol. 2013;16(1):157-69.
8. Fonseca MJM, Faerstein E, Chor D, Lopes CS. Validity of self-reported weight and height and the body mass index within the “Pró-Saúde” study. Rev Saúde Pública. 2004;38(3):392-8. 9. Silveira EA, Araújo CL, Gigante DP, Barros AJD,
Lima MS. Weight and height validation for diagnosis of adult nutritional status in Southern Brazil. Cad Saúde Pública. 2005;21(1):235-45. 10. Peixoto MRG, Benício MHD, Jardim PCBV. Validity
of self-reported weight and height: The Goiânia study, Brazil. Rev Saúde Pública. 2006;40(6):1065-72. 11. Avila-Funes JA, Gutiérrez-Robledo LM, Ponce de Leon Rosales S. Validity of height and weight self-report in Mexican adults: Results from the national health and aging study. J Nutr Health Aging. 2004;8(5):35-61.
12. Spencer EA, Appleby PN, Davey GK, Key TJ. Validity of self-reported height and weight in 4808 EPIC-Oxford participants. Public Health Nutr. 2002;5(4):561-5.
14. Nawaz H, Chan W, Abdulrahman M, Larson D, Katz DL. Self-reported weight and height: Implications for obesity research. Am J Prev Med. 2001;20(4):294-8.
15. Ikeda N. Validity of Self-reports of height and weight among the general adult population in Japan: Findings from National Household Surveys, 1986. PLoS One. 2016;11(2):e0148297. https:// doi.org/10.1371/journal.pone.0148297
16. Martin RC, Grier T, Canham-Chervak M, Anderson MK, Bushman TT, DeGroot DW, et al. Validity of self-reported physical fitness and body mass index in a military population. J Strength Cond Res. 2016;30(1):26-32. https://doi.org/10.1519/ JSC.0000000000001026
17. Lu S, Su J, Xiang Q, Zhou J, Wu M. Accuracy of self-reported height, weight, and waist circumference in a general adult Chinese population. Popul Health Metr. 2016;14:30. https://doi.org/10.1186/ s12963-016-0099-8
18. Craig BM, Adams AK. Accuracy of body mass index categories based on self-reported height and weight among women in the United States. Matern Child Health J. 2009;13(4):489-96. 19. Dekkers JC, van Wier MF, Hendriksen IJM, Twisk
JWR, van Mechelen W. Accuracy of self-reported body weight, height and waist circumference in a Dutch overweight working population. BMC Med Res Methodol. 2008;8:69.
20. Duca D, Firpo G, González-Chica DA, Santos JV, Knuth AG, Camargo MBJ, et al. Self-reported weight and height for determining nutritional status of adults and elderly: Validity and implications for data analysis. Cad Saúde Pública. 2012;28(1):75-85.
21. Kuczmarski MF, Kuczmarski RJ, Najjar M. Effects of age on validity of self-reported height, weight, and body mass index: Findings from the Third National Health and Nutrition Examination Survey, 1988–1994. J Am Diet Assoc. 2001;101(1):28-34. 22. Connor Gorber S, Tremblay M, Moher D, Gorber B. A comparison of direct vs. self-report measures for assessing height, weight and body mass index: A systematic review. Obes Rev Off J Int Assoc Study Obes. 2007;8(4):307-26.
23. Nyholm M, Gullberg B, Merlo J, Lundqvist-Persson C, Råstam L, Lindblad U. The validity of obesity based on self-reported weight and height: Implications for population studies. Obes Silver Spring Md. 2007;15(1):197-208.
24. Chor D, Coutinho ESF, Laurenti R. Reliability of self-reported weight and height among State bank employees. Rev Saúde Pública. 1999;33(1):16-23.
25. Barros ES, Araújo AB, Freitas MR, Liberato EG. Influência da alimentação na lipodistrofia em portadores de HIV-AIDS praticantes de atividade física regular. Rev Bras Prescrição E Fisiol Exerc. 2011 [acesso 2011 dez 9];1(2). Disponível em: http://www.rbpfex.com.br/index.php/rbpfex/ article/view/13
26. Giudici KV, Duran ACFL, Jaime PC. Self-reported body changes and associated factors in persons living with HIV. J Health Popul Nutr. 2010;28(6):560-6.
27. Kraft C, Robinson BBE, Nordstrom DL, Bockting WO, Rosser BRS. Obesity, body image, and unsafe sex in men who have sex with men. Arch Sex Behav. 2006;35(5):587-95.
28. Nguyen NTP, Tran BX, Hwang LY, Markham CM, Swartz MD, Vidrine JI, et al. Motivation to quit smoking among HIV-positive smokers in Vietnam. BMC Public Health. 2015;15:326.
29. Pengpid S, Peltzer K. Overweight and obesity and associated factors among school-aged adolescents in six pacific island countries in Oceania. Int J Environ Res Public Health. 2015;12(11):14505-18. 30. Duran ACFL, Florindo AA, Jaime PC. Can
self-reported height and weight be used among people living with HIV/AIDS? Int J STD AIDS. 2012;23(4):e1-6.
31. Ministério da Saúde (Brasil). Orientações para a coleta e análise de dados antropométricos em serviços de saúde : Norma Técnica do Sistema de Vigilância Alimentar e Nutricional – SISVAN. Brasília: Ministério da Saúde; 2011 [acesso 2016 set 28]. Disponível em: http://bvsms.saude.gov. br/bvs/publicacoes/orientacoes_coleta_analise_ dados_antropometricos.pdf
32. World Health Organization. Obesity: Preventing and managing the global epidemic. Geneva: WHO; 2000 [cited 2016 Jul 22]. Available from: http://www.who.int/entity/nutrition/publications/ obesity/WHO_TRS_894/en/index.html
33. Brasil. Resolução CNS nº 466, de 12 de dezembro de 2012-Estabelece as diretrizes e normas brasi-leiras regulamentadoras de pesquisas envolvendo seres humanos. Rev Bras Bioét. 2012;8(1-4):105-20. 34. Szklo M, Nieto FJ, Miller D. Epidemiology: Beyond the basics. Am J Epidemiol. 2001;153(8):821-2. 35. Lin LI-K. A concordance correlation coefficient
to evaluate reproducibility. Biometrics. 1989;45(1):255-68. 36. Bland JM, Altman DG. Measuring agreement in
37. Ribeiro LG, Cardoso LO. Estudos de validação: qual análise utilizar? Rev Bras Med Esporte. 2009;15(4):316-7.
38. Hayes AJ, Kortt MA, Clarke PM, Brandrup JD. Estimating equations to correct self-reported height and weight: Implications for prevalence of overweight and obesity in Australia. Aust N Z J Public Health. 2008;32(6):542-5.
39. Oliveira LPM, Queiroz VAO, Silva MCM, Pitangueira JCD, Costa PRF, Demétrio F, et al. Índice de massa corporal obtido por medidas autorreferidas para
a classificação do estado antropométrico de adultos: estudo de validação com residentes no município de Salvador, estado da Bahia, Brasil. Epidemiol Serv Saúde. 2012;21(2):325-32. 40. Hendricks KM, Willis K, Houser R, Jones CY.
Obesity in HIV-infection: Dietary correlates. J Am Coll Nutr. 2006;25(4):321-31.