ABSTRACT:Objective: To evaluate the validity of self-reported weight and height measurements among residents of São Paulo, as well as the accuracy of these measurements for determining nutritional status, and to present calibration coeicients. Methods: A cross-sectional, population-based study was performed with a sample of 299 adolescents, adults and elderly of both genders, in São Paulo in 2008. Bland-Altman diference plot and intraclass correlation were used to determine agreement between measured and self-reported parameters. Sensitivity and speciicity were assessed for overweight,and calibration coeicients were estimated for correction of weight, height and body mass index data. Results: The intraclass correlation was high between self-reported and measured parameters for weight (r > 0,94) and body mass index (BMI) (r > 0,85). The agreement between measured and self-reported weight, height and BMI was good. Sensibility was > 91% and speciicity was > 83%.
Conclusion: Self-reported weight measurements can substitute measured parameters in this population, in both genders and in the age groups studied. Self-reported height measurements should be used with caution. Calibration coeicients can be used to adjust self-reported measurements.
Keywords: Validation studies. Sensitivity and speciicity. Body weight. Body height. Body mass index, Health surveys.
Validation and calibration of
self-reported weight and height from
individuals in the city of São Paulo
Validação e calibração de medidas de peso e altura autorreferidas por
indivíduos da cidade de São Paulo
Aline Martins de CarvalhoI, Lívia Gonçalves PiovezanI, Soraya Sant´Ana de Castro SelemI,
Regina Mara FisbergI, Dirce Maria Lobo MarchioniI
ORIGINAL ARTICLE / ARTIGO ORIGINAL
IDepartment of Nutrition, School of Public Health, Universidade de São Paulo – São Paulo (SP), Brazil.
Corresponding author: Dirce Maria Lobo Marchioni. Faculdade de Saúde Pública da Universidade de São Paulo. Departamento de Nutrição. Avenida Doutor Arnaldo, 715, Cerqueira César, CEP: 01246-904, São Paulo, SP, Brasil. E-mail: [email protected]
Conlict of interests: nothing to declare – Financing source: National Counsel of Technological and Scientiic Development (CNPq)
INTRODUCTION
Overweight and obesity are increasing threats to the health of the world population and have been associated with several chronic diseases such as cardiovascular diseases, cancer, and diabetes1. In Brazil, the prevalence of overweight now reaches 50% of adults (20 – 59 years), 22% of adolescents (10 – 19 years) and 34% of children (5 – 9 years)2. This fact has motivated researchers to investigate factors associated (gender, age, education, income, lifestyle, etc.) to chronic diseases and identify groups at highest risk. Thus, the use of self-reported data and the use of self-administered questionnaires has been a common practice, especially in studies involving large samples3. This form of data collection is justiied by its operational and logistical facility, in addition to the cost savings involved in training of personnel, transportation and procurement of equipment for measuring4.
Self-reported measures of height and weight have been frequently used5-8, However, it is common to find changes in the validity of the measurements according to characteristics of individuals, such as gender, age, nutritional status and socioeconomic (family income, education), cultural (valuation of thinness) and psychological (body satisfaction) conditions9-11.
In the national literature, there are some studies on validation of height and weight measurements that show a greater tendency of underestimation of weight in obese individuals, adolescents and women, and overestimation of height in individuals of
RESUMO:Objetivo: Avaliar a validade de peso e altura autorreferidos em residentes do município de São Paulo, a acurácia do uso dessas medidas na classiicação do estado nutricional, bem como apresentar os coeicientes de calibração. Métodos: Foram utilizadas análises de Bland e Altman e correlação intraclasse para determinar concordância e validade entre as medidas aferidas e referidas, veriicando sensibilidade e especiicidade para excesso de peso. Também foram estimados os coeicientes de calibração para correção dos dados de peso, altura e índice de massa corporal (IMC). Resultados: Pode-se observar alta correlação intraclasse entre as medidas de peso (r > 0,94) e IMC (r > 0,85) referidas e aferidas. Também foi observada boa concordância entre as medidas de peso, altura e IMC, assim como alta sensibilidade (> 91%) e especiicidade (> 83%) para IMC. Conclusão: Medidas autorreferidas de peso podem ser utilizadas em substituição às medidas aferidas nessa população de estudo, em ambos os sexos e nas faixas etárias estudadas. Já as medidas de altura devem ser utilizadas com cautela. Os coeicientes de calibração podem ser usados como estratégia para ajuste das medidas.
short stature, women, teens and seniors, which can generate a spurious estimate of body mass index (BMI), with a reduction of individuals at the extremes of the rating curve, compromising the validity of these measures4,12-14. To correct these potential errors, methodological strategies, such as using equations for calibration of the data, can be employed in order to bring the measure provided closer to the actual values. However, few studies develop such approaches.
Thus, the present study aims to assess the validity of self-reported data on weight and height of adolescents, adults and elderly residents of São Paulo, participants of Health Survey of São Paulo (ISA-Capital 2008), as well as to assess the agreement between classiications of nutritional status by self-reported and measured data, and to present calibration coeicients for correction of data on weight, height and BMI.
METHODS
This study is part of the Health Survey of São Paulo (ISA-Capital), a cross-sectional, population-based study conducted in São Paulo between 2008 and 2010. A sample of ISA-Capital was obtained by complex probabilistic sampling, by conglomerates, in two stages: census tracts and households (n = 1,662). The planning was done to estimate the proportions of 50% (p = 0.50, which corresponds to the largest minimum sample size for estimating proportions) with sampling error of 7 percentage points (d = 0.07) with a conidence level 95% and 1.5 design efects. Inclusion criteria of the ISA-Capital study were: being a resident of the selected household in the urban area of the state capital, belonging to the domains of interest (adolescents, adults and elderly of both sexes), not being pregnant. Details can be found in another publication15.
In 2008, data on food habits and socioeconomic factors of the ISA-Capital study participants were collected through home visits. A year later, the team returned to the individuals’ home to collect data such as measured weight and height, and other measures of interest (blood collection, blood pressure, medication use, among others) by a previously trained nurse. This second home visit for anthropometric measurements was conirmed by phone a few days before. Upon conirmation, the participant was asked about their height and weight measurements (self-reported), and dietary data were also collected.
During this period between the collections there was a signiicant sample loss, totaling 832 individuals who had reported anthropometric data and 750 who had and measured anthropometric data. However, this loss occurred randomly in all census tracts, thus reducing the possibility of bias by diferential loss.
Thus, for the present study, only individuals who had all their measurements collected and whose and self-reported measurements were collected before the measured values were selected, totaling a subsample from ISA-Capital of 299 individuals (112 men and 187 women, 62 adolescents, 107 adults and 130 elderly). However, no diference between schooling of head of household, age, sex and nutritional status between the study sample and the sample of ISA-Capital was observed.
For weight measurement, an electronic platform scale with capacity for 150 kg and sensitivity of 100 g (TANITA®) was used. Subjects were weighed wearing light clothes, barefoot with erect posture, parallel feet and fully supported in the balance platform and with arms along the body16.
For height measurement, a stadiometer with scale in millimeters was used (Seca Bodymeter 208®), ixed to the wall. Subjects stood up with erect posture, feet together and heels touching the wall. The apex of the ear and the outer corner of the eye remained in parallel to the ground, forming an angle of 90 degrees to the bar of the stadiometer. The horizontal bar of the stadiometer was lowered and laid on the head, allowing reading in centimeters16.
The self-reported data were obtained by the questions: “What is your weight?” And “How tall are you?”.
From the measurements of weight and height, measured and reported BMI (weight/ height2) were calculated and classiied according to the ranges suggested by Cole et al.17 for teens, by the World Health Organization1 for adults and by the Nutrition Screening Initiative for seniors.
The project was approved by the Research Ethics Committee of the School of Public Health, Universidade de São Paulo. All participants signed a free and informed consent form. There are no conlicts of interest.
STATISTICAL ANALYSES
Adherence of variables to normal distribution was checked by the Kolmogorov-Smirnov test, and presented normal distribution.
The intraclass correlation coeicients were used to assess the validity and relationship between reported and measured weight, height and BMI according to the categories of gender (male and female) and age (adolescent: 12 – 19 years, adult: 20 – 59; elderly: 60 years or older). This coeicient evaluates the correlation between the groups, considering the interpersonal variability, that is, the systematic under- or overestimation within the group19. Paired t-test was used to assess the diferences between the means of reported and measured for each gender and age group.
Calibration coeicients were obtained by linear regression models, in which the reference pattern (measured) is modeled as a function of the self-reported measure21-23. Thus, the coeicients of attenuation can be estimated as the slope of the regression line of the reference values (measurements taken) in the observed data (self-reported measures). Calibration coeicients were estimated by gender and age group.
The use of calibration is important for extrapolating data; studies in the same population only with information on self-reported measures might use the data of calibration coeicients to improve estimates of means and conidence intervals for weight, height and BMI, decreasing the error in using the self-reported measure. This can be done by means of the equation: y = B0 + B1x, where y refers to the calibrated measure, x is the self-reported measure and B1 and represents the increase in the calibrated measure for each unit of the self-reported measure.
We calculated sensitivity, speciicity and positive predictive value (PPV) of nutritional status, obtained from the BMI classiications (with and without excess weight), calculated from the reported measurements, taking as gold standard the BMI calculated from the measured values. The sensitivity and speciicity were analyzed according to gender and age.
The proportions of individuals with excess weight were calculated from seld-reported, measured and calibrated data, and the proportion test was performed to verify the diference between measured and reported data, and between measured and calibrated data.
The sampling design of the ISA-Capital was not used in this study. The power of the study was veriied for each domain of interest (adolescents, adults and elderly separated by gender), according to Reichenheim24, who takes into account the conidence interval, Kappa, proportions and accuracy.
RESULTS
A total of 299 individuals living in the city of São Paulo (112 men and 187 women) were evaluated, 21% adolescents, 36% adults and 43% seniors. It was observed that 55% of the population had schooling of head of household with eight or more years of study. About 52% of people were overweight, and the prevalence was 36% for adolescents, 46% for adults and 64% for the elderly. This sample showed no statistical diference compared to the initial study sample by gender, age, education of household head and nutritional status (data not shown).
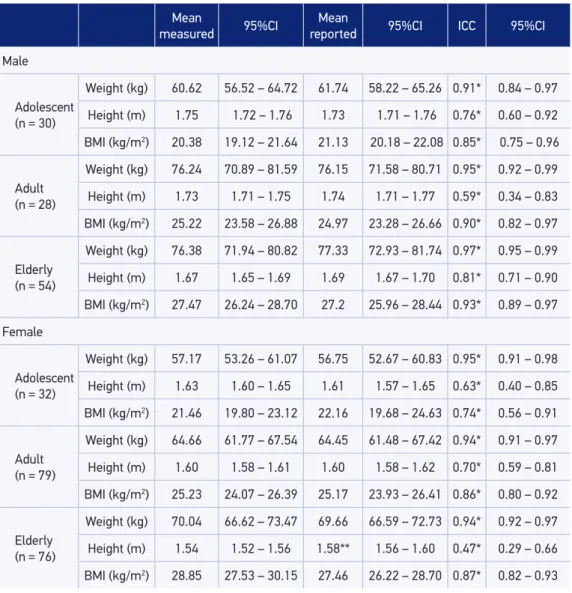
It was found that women tend to underestimate their weight and men (except adults) tend to overestimate it. Elderly individuals tend to overestimate height, while teenagers tend to underestimate it. Means, conidence intervals and intraclass correlation coeicients by gender and age group are presented in Table 1.
It is noteworthy that the correlation coeicients for height are lower in all age groups and gender. However, most are even greater than 0.40, which is considered a good value according to Fleiss25.
Table 1. Means of measured and reported weight, height and body mass index, mean error and intraclass correlation between reported and taken measurements according to gender and age.
São Paulo, 2013.
Mean
measured 95%CI
Mean
reported 95%CI ICC 95%CI
Male
Adolescent (n = 30)
Weight (kg) 60.62 56.52 – 64.72 61.74 58.22 – 65.26 0.91* 0.84 – 0.97
Height (m) 1.75 1.72 – 1.76 1.73 1.71 – 1.76 0.76* 0.60 – 0.92
BMI (kg/m2) 20.38 19.12 – 21.64 21.13 20.18 – 22.08 0.85* 0.75 – 0.96
Adult (n = 28)
Weight (kg) 76.24 70.89 – 81.59 76.15 71.58 – 80.71 0.95* 0.92 – 0.99
Height (m) 1.73 1.71 – 1.75 1.74 1.71 – 1.77 0.59* 0.34 – 0.83
BMI (kg/m2) 25.22 23.58 – 26.88 24.97 23.28 – 26.66 0.90* 0.82 – 0.97
Elderly (n = 54)
Weight (kg) 76.38 71.94 – 80.82 77.33 72.93 – 81.74 0.97* 0.95 – 0.99
Height (m) 1.67 1.65 – 1.69 1.69 1.67 – 1.70 0.81* 0.71 – 0.90
BMI (kg/m2) 27.47 26.24 – 28.70 27.2 25.96 – 28.44 0.93* 0.89 – 0.97
Female
Adolescent (n = 32)
Weight (kg) 57.17 53.26 – 61.07 56.75 52.67 – 60.83 0.95* 0.91 – 0.98
Height (m) 1.63 1.60 – 1.65 1.61 1.57 – 1.65 0.63* 0.40 – 0.85
BMI (kg/m2) 21.46 19.80 – 23.12 22.16 19.68 – 24.63 0.74* 0.56 – 0.91
Adult (n = 79)
Weight (kg) 64.66 61.77 – 67.54 64.45 61.48 – 67.42 0.94* 0.91 – 0.97
Height (m) 1.60 1.58 – 1.61 1.60 1.58 – 1.62 0.70* 0.59 – 0.81
BMI (kg/m2) 25.23 24.07 – 26.39 25.17 23.93 – 26.41 0.86* 0.80 – 0.92
Elderly (n = 76)
Weight (kg) 70.04 66.62 – 73.47 69.66 66.59 – 72.73 0.94* 0.92 – 0.97
Height (m) 1.54 1.52 – 1.56 1.58** 1.56 – 1.60 0.47* 0.29 – 0.66
BMI (kg/m2) 28.85 27.53 – 30.15 27.46 26.22 – 28.70 0.87* 0.82 – 0.93
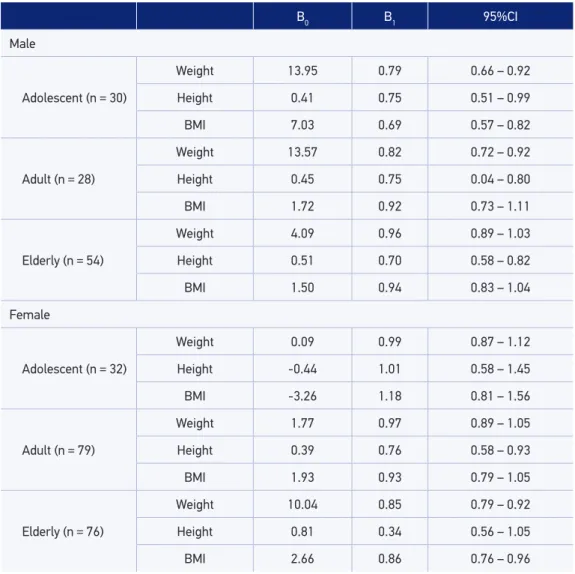
Calibration coeicients are presented in Table 2. Results related to height present lower coeicients of the regression models, especially among elderly women.
No signiicant diference was found in nutritional status according to measured and reported measurements, and according to measured and calibrated measures (Table 3).
15.8
Difer
ence
-8
42.8 Mean 80.5
Male adolescent
Mean diference: 1.113 (95%CI -0.518 – 2.745) 9.2
Difer
ence
-12
38 Mean 80.5
Female adolescent
Mean diference: -0.419 (95%CI – 1.724 0.887)
7.88288
Difer
ence
-12
58.2 Mean 103
Male adult
Mean diference: -0.089 (95%CI -1.666 – 1.488) 25
Difer
ence
-18.5
38.8 Mean 106.25
Female adult
Mean diference: -0.204 (95%CI – 1.228 0.821)
11.8
Difer
ence
-12
52 Mean 128.25
Male elderly
Mean diference: 0.960 (95%CI -0.134 – 2.055) 12
Difer
ence
-32.4
42.4 Mean 117.5
Female elderly
Mean diference: -0.379 (95%CI -1.476 – 0.718)
Figure 1. Bland and Altman plots for self-reported and measure weight (kg) according to sex and
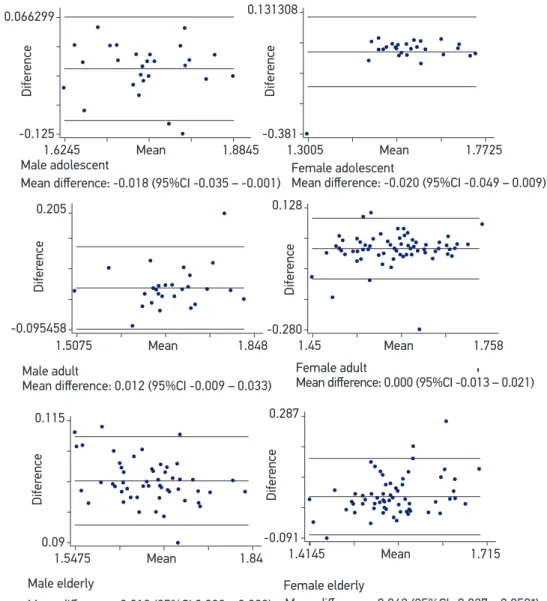
Figure 2. Bland and Altman plots for self-reported and measure height (m) according to sex and
age group. São Paulo, 2013. 0.066299
Difer
ence
-0.125
1.6245 Mean 1.8845 Male adolescent
Mean diference: -0.018 (95%CI -0.035 – -0.001) 0.131308
Difer
ence
-0.381
1.3005 Mean 1.7725
Female adolescent
Mean diference: -0.020 (95%CI -0.049 – 0.009)
0.205
Difer
ence
-0.095458
1.5075 Mean 1.848
Male adult
Mean diference: 0.012 (95%CI -0.009 – 0.033) 0.128
Difer
ence
-0.280
1.45 Mean 1.758
Female adult
Mean diference: 0.000 (95%CI -0.013 – 0.021)
0.115
Difer
ence
0.09
1.5475 Mean 1.84
Male elderly
Mean diference: 0.019 (95%CI 0.008 – 0.029) 0.287
Difer
ence
-0.091
1.4145 Mean 1.715
Female elderly
Mean diference: 0.042 (95%CI -0.027 – 0.058*)
*signiicant diference between reported and taken measurement (paired t-test. p < 0.05)
DISCUSSION
This study is the irst to assess the feasibility of using self-reported measures of height and weight in a subsample of a population-based study with a representative sample of adolescents, adults and elderly residents of São Paulo, as well as presenting calibration coeicients for correction of self-reported data.
The results of this study are better than those reported in the literature, as there was a good correlation between measurements of weight and height for the calculation of BMI in all age groups and gender4,9,13. Diferences observed between reported and measured weight were not signiicant for either gender and age groups, that is, were proved void. Table 2. Calibration coeicients, conidence interval of the calibration regression according to
gender and age range. São Paulo, 2013.
B0 B1 95%CI
Male
Adolescent (n = 30)
Weight 13.95 0.79 0.66 – 0.92
Height 0.41 0.75 0.51 – 0.99
BMI 7.03 0.69 0.57 – 0.82
Adult (n = 28)
Weight 13.57 0.82 0.72 – 0.92
Height 0.45 0.75 0.04 – 0.80
BMI 1.72 0.92 0.73 – 1.11
Elderly (n = 54)
Weight 4.09 0.96 0.89 – 1.03
Height 0.51 0.70 0.58 – 0.82
BMI 1.50 0.94 0.83 – 1.04
Female
Adolescent (n = 32)
Weight 0.09 0.99 0.87 – 1.12
Height -0.44 1.01 0.58 – 1.45
BMI -3.26 1.18 0.81 – 1.56
Adult (n = 79)
Weight 1.77 0.97 0.89 – 1.05
Height 0.39 0.76 0.58 – 0.93
BMI 1.93 0.93 0.79 – 1.05
Elderly (n = 76)
Weight 10.04 0.85 0.79 – 0.92
Height 0.81 0.34 0.56 – 1.05
BMI 2.66 0.86 0.76 – 0.96
Some of the factors that could afect these results are the frequency with which individuals weigh themselves, the date of last measurement, type of clothing and footwear used, excessive preoccupation with body image and dissatisfaction with weight4,9. In addition, access to and frequency of use of the primary health care network in São Paulo may have inluenced the higher frequency of measurement of weight, bringing the self-reported value closer to the real one26.
It was observed that older women overestimated their height, in accordance with what Del Duca et al14 observed in the elderly of both sexes of Pelotas, Rio Grande do Sul. This fact is possibly due to the low frequency of measurement and the natural reduction in height due to the compression of the intervertebral discs27.
It was also found that the majority of calibration coeicients was close to one, indicating that these self-reported measures have good equivalence with the measurements taken28,29. The use of calibration coeicients can help in a more reliable prediction in studies with only self-reported measures. However, the coeicient of height proved to be distant from one, so the use of self-reported height, especially among the elderly, should be done with caution.
The prevalence of overweight according to the self-reported or calibrated measure was statistically the same as measured, showing that the use of such measures for nutritional diagnosis of overweight is valid. The prevalence from the calibrated measurements tended to be mostly closer to the measured value compared with the prevalence from the self-reported results. Thus, the use of calibration coeicients presented in this study as enhancement factors may favor the accuracy of association measurements obtained in epidemiological studies when arising from self-reported anthropometric weight and height measurements.
The sample size in stratiied analyzes led to the reduction of the power of the study. However, can still be considered that the results of mean diference and correlation were Table 3. Sensitivity, speciicity and positive predictive value of body mass index determined from reported measurements and proportion of subjects with overweight from taken, reported and calibrated measurements and their diferences. São Paulo, 2013.
Sensitivity (%)
Speciicity
(%)
PPV (%)
Measured
overweight
(%)*
Self-reported overweight (%)*
Calibrated
overweight (%)*
Adolescent 91.67 97.67 95.65 35.82 34.33** 34.33***
Adult 92.16 83.33 82.46 45.95 51.35** 49.55***
Elderly 95.70 94.34 96.74 63.70 63.01** 58.22***
Male 91.67 92.06 92.06 48.78 48.48** 46.34***
Female 95.37 90.32 91.96 53.73 55.72** 52.74***
homogeneous in their majority, no changes were found in BMI classiications in this study, which can be seen from the values of sensitivity, speciicity and positive predictive value.
It is also noteworthy that, even though this study has a small sample, this resembles the original study population of ISA-Capital in socioeconomic data and nutritional status.
CONCLUSION
We conclude that the method of self-reported measures showed good validity with measures taken for most of the population studied and showed high sensitivity and speciicity. Height measurements should be used with caution. Calibration coeicients presented can be used to improve BMI estimates and overweight prevalence in this study population. These data are important as they enable future studies to be developed with economy of resources and simpliied ield work.
1. World Health Organization (WHO). Obesity: preventing and managing the global epidemic. Report of a WHO Consultation (WHO Technical Report Series 894). Geneva: WHO; 2000.
2. Instituto Brasileiro de Geograia e Estatística (IBGE). Indicadores IBGE: Pesquisa de orçamentos familiares 2008-2009: antropometria, estado nutricional de crianças, adolescentes e adultos no Brasil. Rio de Janeiro: IBGE; 2010.
3. César CLG, Carandina L, Alves MCGP, Barros MBA, Goldbaum M. Saúde e condição de vida em São Paulo: inquérito multicêntrico de saúde no estado de São Paulo (ISA-SP). São Paulo: FSP/USP; 2005. 212 p.
4. Peixoto MRG, Benício MHD, Jardim PCBV. Validade do peso e da altura autorreferidos: o estudo de Goiânia. Rev Saúde Pública 2006; 40(6): 1065-72.
5. Health Education Authority (HEA). Today’s young adults: 16-19 year olds look at diet, alcohol, drugs and sexual behavior. London: HEA; 1992.
6. Strauss RS. Comparison of measured and self-reported weight and height in a cross-sectional sample of young adolescents. Int J Obes Relat Metab Disord 1999; 23(8): 904-8.
7. Center for Disease Control and Prevention (CDC). Youth risk behavior surveillance, United States – 2003. Surveillance summaries. Washington: CDC; 2004.
8. Virtuoso-Junior JS, Oliveira-Guerra R. Validade concorrente do peso e estatura auto-referidos no diagnóstico do estado nutricional em mulheres idosas. Rev Salud Pública 2010; 12(1): 71-81.
9. Fonseca MJM, Faerstein E, Chor D, Lopes CS. Validade de peso e estatura informados e índice de massa corporal: estudo pró-saúde. Rev Saúde Pública 2004; 38(3): 392-8.
10. Pregnolato TS, Mesquita LM, Ferreira PG, Santos MM, Santos CC, Costa RF. Validade de medidas autorreferidas de massa e estatura e seu impacto na estimativa do estado nutricional pelo índice de massa corporal. Rev Bras Crescimento Desenvolvimento Hum 2009; 19(1): 35-41.
11. Silveira EA, Araújo CL, Gigante DP, Barros AJD, Lima MS. Validação do peso e altura referidos para o diagnóstico do estado nutricional em uma população de adultos no Sul do Brasil. Cad Saúde Pública 2005; 21(1): 235-45.
12. Chor D, Coutinho ESF, Laurenti R. Reability of self-reported weight and among State bank employees. Rev Saúde Pública 1999; 33(1): 16-23.
13. Farias Júnior JC. Validade das medidas auto-referidas de peso e estatura para o diagnostico do estado nutricional de adolescentes. Rev Bras Saúde Matern Infant 2007; 7(2): 167-74.
14. Del Duca GF, González-Chica DA, Santos JV; Knuth AG, Camargo MBJ, Araújo CL. Peso e altura autorreferidos para determinação do estado nutricional de adultos e idosos: validade e implicações em análises de dados. Cad Saúde Pública 2012; 28(1): 75-85.
15. Fisberg RM, Marchioni DML. Manual para estudos populacionais de alimentação, nutrição e saúde: a experiência do inquérito de saúde em São Paulo (ISA). Grupo de Avaliação de Consumo Alimentar (GAC). São Paulo: FSP/USP; 2012.
16. Lohman TG, Roche AF, Martorell R. Anthropometric Standardization Reference Manual. Champaign: Human Kinetics; 1988.
17. Cole TJ, Flegal KM, Nicholls D, Jackson AA. Body mass index cut ofs to deine thinness in children and adolescents: international survey. BMJ 2007; 335(7612): 194-7.
18. The Nutrition Screening Initiative. Incorporating nutrition screening and interventions into medical practice: a monograph for physicians. Washington: American Academy of Family Physicians. The American Dietetic Association. National Council on Aging Inc; 1994.
19. Szklo M, Javier Nieto F. Epidemiology: beyond the basics. Am J Epidemiol 2001; 153(8): 821-2.
20. Bland JM, Altman DG. Comparing methods of measurement: why plotting difference against standard method is misleading. Lancet 1995; 346(8982): 1085-7.
21. Kaaks R, Riboli E. Validation and calibration of dietary intake measurements in the EPIC project: methodological considerations. European Prospective Investigation into Cancer and Nutrition. Int J Epidemiol 1997; 26(Suppl 1): S15-25.
22. Stram DO, Hankin JH, Wilkens LR, Pike MC, Monroe KR, Park S, et al. Calibration of the dietary questionnaire for a multiethnic cohort in Hawaii and Los Angeles. Am J Epidemiol 2000; 151(4): 358-70.
23. Teixeira JA, Baggio ML, Fisberg RM, Marchioni DM. Calibration of the dietary data obtained from the Brazilian center of the Natural History of HPV Infection in Men study: the HIM Study. Cad Saúde Pública 2010; 26(12): 2323-33.
24. Reichenheim ME. Sample size for the kappa-statistic of interrater agreement. STB 2001; 10(58): 41-5.
25. Fleiss J. The design and analysis of clinical experimentsed. New York: Wiley; 1986.
26. São Paulo. Prefeitura de São Paulo. Secretaria Municipal de Saúde. Estratégia Saúde da Família. Atenção Básica. Disponível em: http://www.prefeitura.sp.gov. br/cidade/secretarias/saude/atencao_basica/esf/. (Acessado em 28 de setembro de 2013).
27. Brasil. Ministério da Saúde. Cadernos de Atenção Básica - Envelhecimento e saúde da pessoa idosa. Brasília: Ministério da Saúde; 2006.
28. Lucca A, Moura EC. Validity and reliability of self-reported weight, height and body mass index from telephone interviews. Cad Saúde Pública 2010; 26(1): 110-22.
29. Kynast-Wolf G, Becker N, Kroke A, Brandstetter BR, Wahrendorf J, Boeing H. Linear regression calibration: theoretical framework and empirical results in EPIC, Germany. Ann Nutr Metab 2002; 46(1): 2-8.
Received on: 10/03/2013