Validity of self-reported height,
weight and body mass index in
the adult population of Brasilia,
Brazil
Validade de peso, altura e índice de
massa corporal autorreferidos na
população adulta de Brasília
Priscilla Marcondelli Dias Thomaz
IEduardo Freitas da Silva
IITeresa Helena Macedo da Costa
IIII Pós-graduação em Ciências da Saúde da Universidade de Brasília, UnB.
II Departamento de Estatística da Universidade de Brasília, UnB.
III Departamento de Nutrição da Universidade de Brasília.
Funding source: This research project was funded by the Conselho Nacional de Desenvolvimento Cientíico e Tecnológico (CNPq – National Council for Scientiic and Technological Development – Process 474665/04-6) and grant 05/2012 from DPP, University of Brasilia.
Authors declared there were no conlicts of interest.
Corresponding author: Priscilla Marcondelli Dias Thomaz (Marcondelli PDT). Universidade de Brasília, Pós-graduação em Ciências da Saúde, CEP 70910-900. SQSW 306 – bloco A – apto 108
Abstract
Objective: To assess the validity of self--reported weight, height and body mass index (BMI) estimates from adults in Brasilia and to identify factors associated to diffe-rences between measured and self-reported values. Methods: In a cluster sampling 250 household´s were selected and weight and height were measured in all adults after an interview. Bland & Altman (B&A) was used to determined agreement between measured and self-reported parameters. The multiple analysis of variance was used to determine the associated factors. Sensitivity and spe-cificity were used for excess weight (BMI ≥ 25 kg/m2). Results: Interviews and
measu-rements were done in 469 individuals. B&A showed bias (difference between measured and self-reported values) was not significant for weight (− 0.17 kg, p = 0.1) and significant for height (− 1 cm, p < 0.001). The limits of agreement (LA) were wide: from ± 4 kg for weight and - 6 cm to 4 cm for height. BMI presented a non significant bias of − 0.06 kg/ m2 (p = 0.08) and LA of − 1.5 to + 1.4 kg/m2.
Men with a BMI < 25 kg/m2 overestimated
weight, while overweight or obese men un-derestimated it (p < 0.01). Men older than 60y of age (p = 0.037) and women with less than 12y of study (p < 0.01) overestimated height. The sensitivity and specificity to detect excess weight were for men and women, respectively: 94%, 88% and 90%, 98%. Sensitivity to detect excess weight was 77% for 60 or over years old women and 75% for women between 9 to 11 years of study, while. specificity was 78% for men between 30 e 39 years old. Conclusion: In Brasilia, self-reported height can be used for subgroups of women with more than 12y of study and men under 60y of age. Men with adequate BMI over estimate their weight when compared to overweight and obese men. Self-reported measures can be used for excess weight population follow-up.
Resumo
Objetivo: Avaliar a validade do peso, altura e índice de massa corporal (IMC) autorre-feridos em adultos de Brasília e identificar os fatores associados às diferenças entre os valores medidos e autorreferidos. Métodos: Em amostra por conglomerados de 250 domicílios foram aferidos peso e altura de todos os adultos residentes, após entre-vista. A concordância entre os parâmetros medidos e autorreferidos foi feita por Bland & Altman (B&A). Utilizou-se análise de variância múltipla e estimou-se a sensibi-lidade e especificidade para o excesso de peso (IMC ≥ 25 kg/m2), estratificado por
anos de estudo e faixa etária. Resultados: As entrevistas e mensurações foram feitas em 469 indivíduos. Os resultados de B&A mos-tram viés (diferença dos valores medidos e autorreferidos) não significativo para o peso (−0,17 kg, p = 0,1) e significativo para a altura (−1 cm, p < 0,001). Os limites de concordân-cia (LC) foram amplos: de ±4 kg e de −6 cm a 4 cm. O viés do IMC foi de –0,06 kg/m2
e não significativo (p = 0,08) e os LC de − 1,5 a +1,4 kg/m2. Observou-se que homens
com IMC < 25 kg/m² superestimam o peso, enquanto aqueles com sobrepeso e obesos o subestimam (p < 0,01). Homens com + 60a de idade (p = 0,037) e mulheres com < 12a de estudo (p < 0,01) superestimam a altura. A sensibilidade e a especificidade para o excesso de peso foram para homens e mulheres, respectivamente: 94% e 88%; 90% e 98%. A sensibilidade foi de 77% para mulheres acima de 60 anos, de 75% para mulheres com 9 a 11 anos de estudo, e a especificidade de 78% para homens entre 30 e 39 anos. Conclusão: Em Brasília, a altura autorreferida pode ser utilizada para subgrupos de homens < 60anos de idade e mulheres com + 12 anos de estudo. Homens com IMC adequado superestimam o peso corporal quando comparados com aqueles com sobrepeso ou obesos. As medidas au-torreferidas prestam-se para acompanha-mento populacional do excesso de peso.
Palavras-chave: Peso corporal. Altura cor-poral. Índice de massa corcor-poral. Excesso de peso. Epidemiologia. Antropometria.
Introduction
Weight and height are two anthropo-metric measures frequently found in clinical practice and research. These measures are obtained with widely available and specific equipment. In this context, self-reported values are a simple low-cost way which can be applied to large groups of the population.
1;2 However, the literature discusses the
va-lidity of self-reported anthropometric data. Self-reported weight and height are highly correlated to measured values, rep-resenting an interesting alternative to mea-sure and monitor the prevalence of obesity.
3;4 However, even with this positive factor,
the systematic review conducted by Gorber et al.5 (2007), which analyzed 64 studies that
made a comparison between measured and self-reported weight, height and BMI, recommends that this method should be used with caution as variables such as sex, age and socioeconomic classification can act as measurement biases. 3;4;6 Although
the information obtained from one method and that of the other are highly correlated with each other, there is a trend towards underestimation of self-reported weight and overestimation of self-reported height.
5;7;8 This characterizes a lack of agreement
between these measures. 9
With regard to the influence of sex on the results of self-reported weight and height, there is a frequent underestimation of weight in women and overestimation of height in men. 2;10;11
Kuczmarski et al.3 (2001) concluded that
the method of self-reported weight and height is valid for young adults, but not for elderly individuals over 60 years of age, as the latter group tends to overestimate height. The incorrect estimate of weight and height results in the inaccurate estimate of BMI, which would have a direct influence on estimated prevalence of overweight and obesity. For this reason, several studies have analyzed the validity of the BMI resulting from self-reported height and weight; 4;5;13;14
of BMI based on self-reported weight and height. Previous studies were conducted with the populations of other Brazilian cit-ies, such as Porto Alegre, Pelotas, Goiânia and Rio de Janeiro. 4;10;13;15 However, the
literature includes no studies that assessed the weight and height of the adult popula-tion living in Brasília.
In this context, the present study aimed to assess the validity of the estimate of self-reported weight and height and resulting BMI in the adult population of the city of Brasília and to identify the factors that in-fluence measured and self-reported values.
Methods
The population included in the present study was comprised of residents of the 1st
Administrative Region of the city of Brasília, in the Center-West region of Brazil, accord-ing to the division into Sanitary Districts ad-opted by the Federal District’s Department of Health.16
The sample was stratified into four strata and distribution was proportional to stra-tum size. Cochran’s formulas 17 (1977) were
used to estimate the proportions and the expected accuracy was 95%. The sample was obtained from the list of homes registered with the Companhia Energética de Brasília
(CEB – City of Brasília Electric Company), totaling 82,680 homes. Coverage of home addresses registered in this city is 100%. The primary sampling unit was the home. A list with all homes was stratified into the four regions of Brasília. A simple random sample of homes was obtained from each region, individuals were located after the random selection of homes and all adults were interviewed. Aiming to maintain the sample size determined for this research, each address ignored was replaced by another, following the list provided by the CEB in February 2005. The replacement criterion was predetermined according to the number of addresses initially selected, where each cluster was included with an additional 20% of addresses.
Thus, a total of 250 home addresses
were randomly selected, maintaining the proportionality in each of the four regions of Brasília: South Wing (113 homes, 45%), North Wing (117 homes, 47%), Plateau District (10 homes, 4%) and Urban Military Sector (10 homes, 4%).
In each home, residents aged 20 years or more were interviewed between March 2005 and November 2006. Assuming that each home had at least two adults aged 20 years or more, the estimated number of individuals in the sample was 500.
This research project was approved by the Universidade de Brasília School of Health Sciences Research Ethics Committee (101/2004) and all participants signed an informed consent form.
The research instrument used was a questionnaire based on the International Physical Activity Questionnaire (IPAQ), which included questions about physical activity, personal identification, demo-graphic and socioeconomic data, in addi-tion to anthropometric data records.18
A total of three digital scales with a 150kg capacity and 100g accuracy (Plenna, São Paulo, Brazil) and three portable stadiome-ters with a maximum length of 2.13m and a 0.1cm accuracy (Alturexata, Belo Horizonte, Brazil) were used.
A total of five meetings with the team of field workers were conducted during data collection to assess the reproducibility be-tween anthropometric equipment (scales and stadiometers) and evaluators. With regard to equipment, there was not a signi-ficant difference in the analysis of variance among scales (p=0.14) and among stadio-meters (p=0.12). Weight and height mea-surements of six individuals were obtained with the equipment used and the intraclass correlation coefficient (ICC) obtained was 1.00, with a 95%CI of 0.98 – 1.00.
After the informed consent form was signed at home, interviewers applied the questionnaire. At the end of the interview, participants were asked to inform their wei-ght and heiwei-ght. Subsequently, their weiwei-ght and height were measured. All participants were measured without shoes and with light clothing. In the case of the few individuals who were not wearing light clothing, a re-duction of 500g in the measured weight was used as adjustment criterion. This value of 500g corresponds to the weight of a plain cotton sweater and a pair of jeans.
The methodology used to measure wei-ght and heiwei-ght has been described by the World Health Organization (WHO).19 The
scale was placed on a flat and hard surface. Individuals were instructed to take off all accessories and wear light clothing (T-shirt, shorts or skirt made with light fabric). The scale was turned on by the evaluator and when it was set to zero, participants were instructed to stand barefoot on it, with one foot on each side of its platform, standing still with their arms alongside the body, facing forward and looking towards the ho-rizon. Weight (in kg) was recorded in a form and participants were subsequently asked to get down from the scale. Next, they were informed about their measured weight. The Alturexata stadiometer (Belo Horizonte, Brazil) was set up in the homes. This stadio-meter does not require a wall support and it has a ruler with a horizontal metal bar to touch the top of the head and a back support for the heels. Volunteers were instructed to take off all hair and head accessories and to stand barefoot on the stadiometer, fa-cing the evaluator and looking towards the horizon, with their heels touching the back support and knees extended. The head was positioned in a way that the eyes were at the same level as the ears. The horizontal metal bar was gently pulled until it touched the top of the head and volunteers were instructed to hold their breath for a few seconds and to remain still in a straight position. Height was measured at the exact measurement point, participants were asked to get down from the stadiometer and the value (in cm)
was recorded in a form. Participants were subsequently informed about their mea-sured height.
The BMI classification recommended by the World Health Organization (WHO) was used, where values <18.5 kg/m² repre-sent underweight; from 18.5 to 24.99kg/ m², normal weight; from 25.0 to 29.99 kg/ m², overweight; and ≥30.0 kg/m², obesity. 20
Physical activities were analyzed throu-gh time, according to the recommendation of 150 minutes of activity per week. 21 .
Weekly physical activity time was categori-zed by adding the minutes spent on walks and the weekly minutes spent on other mo-derate physical activities, in addition to the weekly minutes of vigorous physical activi-ties multiplied by two. According to this type of analysis, participants were categorized into four different physical activity levels, based on the score obtained in minutes: 0, inactive; 1-149, insufficiently active; 150 – 499, active; and ≥ 500, very active. 22
The Brazilian Economic Classification Criterion 23 was used to assess purchasing
power. This criterion was developed by the Brazilian Association of Advertisers, Brazilian Association of Market Research Companies and Brazilian Association of Market Research Institutes.
Statistical analysis
The validity of self-reported weight and height was performed for each sex separa-tely. The statistical methods for the analysis included descriptive parameters (mean, standard deviation), multiple analysis of variance, and analysis of sensitivity and specificity.
Agreement between measured and self-reported weight and height values was analyzed with the Bland-Altman method (B&A).9 In addition, the same analysis was
established due to the usual variation in weight, to the variation between pieces of equipment with which participants take their measurements, and to the time betwe-en the last effective measurembetwe-ent and their participation in the study. The acceptable limit of variation in BMI was determined a posteriori as ± 0.8 kg/m2, based on the mean
values of weight and height of individuals. The definition of acceptable limit values is relevant for them to be compared with limits of agreement (mean of difference ± 2 stan-dard deviations), obtained from the Bland-Altman analysis. In this analysis, the trend of behavior of measurements is evidenced with Pearson’s correlation coefficient.
Demographic, socioeconomic and heal-th-related factors were analyzed as potential explanatory variables of possible biases for the difference between self-reported and measured weights and heights. These fac-tors included age, socioeconomic class, ma-rital status, level of education, physical acti-vity score and BMI. The differences between the measured and self-reported weight and between the measured and self-reported height were used as dependent variables in the multiple analysis of variance. Tukey’s post-hoc test was performed to determine the differences among strata of variables of the multiple analysis of variance.
The validity of self-reported weight and height used to characterize excess weight was analyzed with indicators of sensitivity and specificity, and positive and negative predictive values. The analysis of sensitivity and specificity for excess weight was also performed for level of education and age groups. Participants with a BMI≥25 were considered to be overweight, thus including those with obesity in this group.
All information was tabulated in an elec-tronic spreadsheet (Excel, Microsoft Office 2000) and analyzed in the SAS software, version 9.1.3. The level of significance was p<0.05.
Results
A total of 250 homes were visited and a
sample of 469 individuals was interviewed, of which 57% were females. Of all addresses randomly selected, 53% needed to be re-placed due to three reasons: home without residents, business address and refusal by all residents to participate in the study. Refusal to respond the survey totaled 13% of individuals. The sample of 469 participants corresponded to 94% of the expected total.
Mean age was 44 years (sd 16), ranging from 20 to 91 years. With regard to socioe-conomic classification, 44% of individuals belonged to the highest-income group (class A), 37% belonged to class B, and 19% were categorized into groups with the lowest in-comes and levels of education of the head of the family (classes C, D and E). The mean level of education was 13 years, varying be-tween nine and 17 years and with a median of 15 years. Mean weight of men was 78.5kg (sd 13.7) and height was 1.73m (sd 0.07), while mean weight of women was 62.8kg (sd 12.5) and height was 1.59m (sd 0.06).
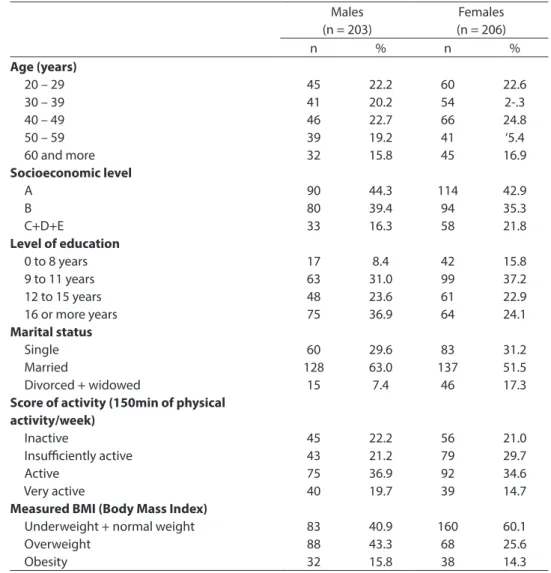
With regard to body mass index (BMI), as only 1% were underweight, these indivi-duals were included into the normal BMI group. Thus, it was observed that 52% of participants had a normal weight, 33% were overweight and 15% were obese (Table 1).
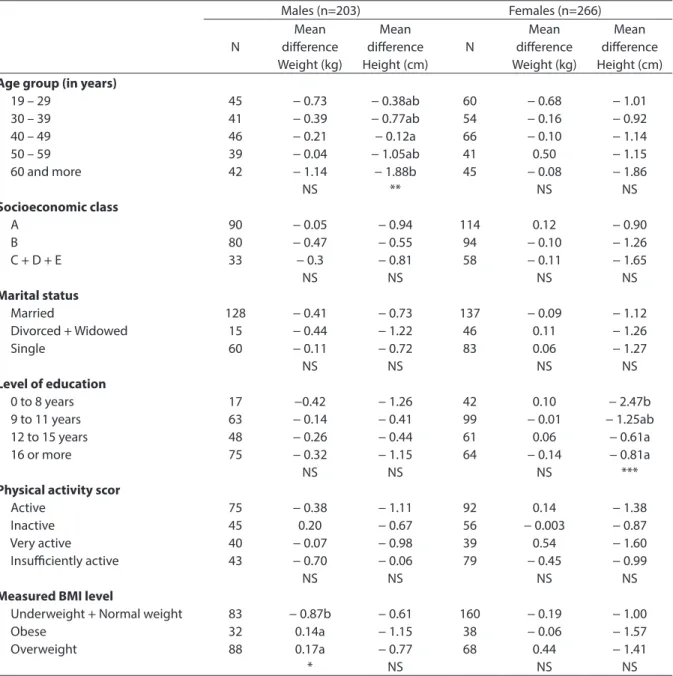
Multivariate analysis
Multiple analysis of variance was perfor-med to identify the factors associated with the mean differences between measured and self-reported weight and height by sex (Table 2). Among women, the difference between measured and self-reported weight was not associated with any of the parame-ters included in the model (p=0.36). Men with a BMI lower than 25 kg/m² tended to overestimate their own weight, whereas tho-se who were overweight and obetho-se tended to underestimate it (p<0.01).
Table 1 – Characteristics according to sex of adults from Brasilia, Brazil, 2006-2007. Tabela 1 – Características de adultos de Brasília separados por sexo. Brasília, 2006-2007.
Males (n = 203)
Females (n = 206)
n % n %
Age (years)
20 – 29 30 – 39 40 – 49 50 – 59 60 and more
Socioeconomic level
A B C+D+E
Level of education
0 to 8 years 9 to 11 years 12 to 15 years 16 or more years
Marital status
Single Married
Divorced + widowed
Score of activity (150min of physical activity/week)
Inactive
Insuiciently active Active
Very active
Measured BMI (Body Mass Index)
Underweight + normal weight Overweight Obesity 45 41 46 39 32 90 80 33 17 63 48 75 60 128 15 45 43 75 40 83 88 32 22.2 20.2 22.7 19.2 15.8 44.3 39.4 16.3 8.4 31.0 23.6 36.9 29.6 63.0 7.4 22.2 21.2 36.9 19.7 40.9 43.3 15.8 60 54 66 41 45 114 94 58 42 99 61 64 83 137 46 56 79 92 39 160 68 38 22.6 2-.3 24.8 ‘5.4 16.9 42.9 35.3 21.8 15.8 37.2 22.9 24.1 31.2 51.5 17.3 21.0 29.7 34.6 14.7 60.1 25.6 14.3
Bland & Altman analysis
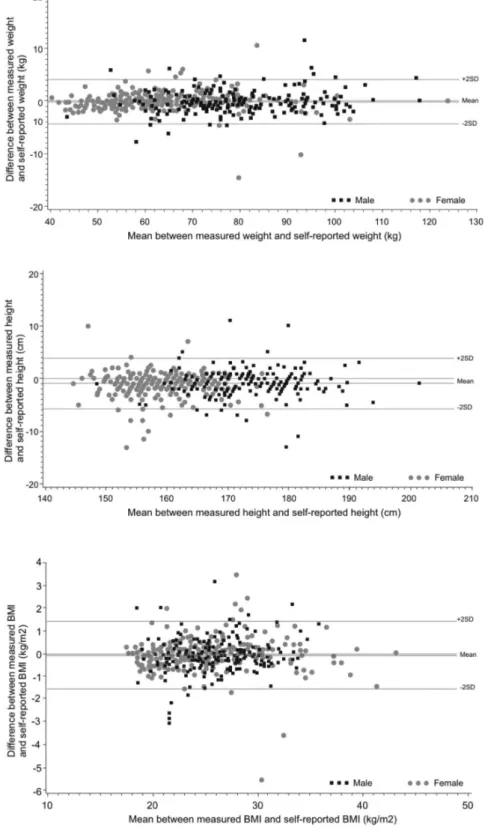
There was a systematic difference be-tween both measurements (bias) with a mean equal to -0.17 kg for weight (p=0.10) and -1cm (p<0.001) for height (Figure 1). In other words, the measured weight is, on average, very close to the self-reported wei-ght, while height is, on average, significantly lower than the self-reported height. The limit of agreement (mean of difference of 2 standard deviations) for body weight was ± 4kg and certain points were inconsistent (15 out of 469, 3.2%). Likewise, the majority of points for height were within the limits of agreement, between –6cm and +4cm, and
nearly 3.8% of these points were inconsis-tent with each other (18 out of 469 points). Consequently, the value of measured BMI is very close to the self-reported value on average, not differing from it significantly, with the majority of points situated within the limits of agreement (from -1.5 to +1.4 kg/m2) and mean difference equal to -0.06
kg/m2 (p=0.08) (Figure 1). There were no
of women with a BMI close to 20 and a greater dispersion of the female BMI, when compared to that of males (Figure 1). The limits of agreement were wider for weight, height and BMI than the acceptable limits of variation established for these measures
(Figure 1). There was not a significant corre-lation between the mean values and the me-ans of differences (biases) for height in both sexes (males r=0.016; p = 0.81 and females r = -0.016; p = 0.79), which enables the use of bias as a correction factor. In addition, there
Table 2 – Mean diference of measured and self-reported weight and height values for socioeconomic factors of men and women. Brasilia, Brazil, 2006-2007.
Tabela 2 – Diferenças de medias entre valores de peso e altura medidos e autorreferidos para os fatores socioeconômicos de homens e mulheres. Brasília, 2006-2007.
Males (n=203) Females (n=266)
N Mean diference Weight (kg) Mean diference Height (cm) N Mean diference Weight (kg) Mean diference Height (cm)
Age group (in years)
19 – 29 30 – 39 40 – 49 50 – 59 60 and more
Socioeconomic class
A B C + D + E
Marital status
Married
Divorced + Widowed Single
Level of education
0 to 8 years 9 to 11 years 12 to 15 years 16 or more
Physical activity scor
Active Inactive Very active Insuiciently active
Measured BMI level
Underweight + Normal weight Obese Overweight 45 41 46 39 42 90 80 33 128 15 60 17 63 48 75 75 45 40 43 83 32 88 − 0.73 − 0.39 − 0.21 − 0.04 − 1.14 NS − 0.05 − 0.47 − 0.3 NS − 0.41 − 0.44 − 0.11 NS −0.42 − 0.14 − 0.26 − 0.32 NS − 0.38 0.20 − 0.07 − 0.70 NS − 0.87b 0.14a 0.17a * − 0.38ab − 0.77ab − 0.12a − 1.05ab − 1.88b ** − 0.94 − 0.55 − 0.81 NS − 0.73 − 1.22 − 0.72 NS − 1.26 − 0.41 − 0.44 − 1.15 NS − 1.11 − 0.67 − 0.98 − 0.06 NS − 0.61 − 1.15 − 0.77 NS 60 54 66 41 45 114 94 58 137 46 83 42 99 61 64 92 56 39 79 160 38 68 − 0.68 − 0.16 − 0.10 0.50 − 0.08 NS 0.12 − 0.10 − 0.11 NS − 0.09 0.11 0.06 NS 0.10 − 0.01 0.06 − 0.14 NS 0.14 − 0.003 0.54 − 0.45 NS − 0.19 − 0.06 0.44 NS − 1.01 − 0.92 − 1.14 − 1.15 − 1.86 NS − 0.90 − 1.26 − 1.65 NS − 1.12 − 1.26 − 1.27 NS − 2.47b − 1.25ab − 0.61a − 0.81a *** − 1.38 − 0.87 − 1.60 − 0.99 NS − 1.00 − 1.57 − 1.41 NS
Multiple variance analysis: * P = 0,0028 ** P = 0,0374 *** P = 0,0093 NS = non significant BMI = Body Mass Index
Análise de variância múltipla: * P = 0,0028 ** P = 0,0374 *** P = 0,0093 NS = não significativo IMC = Índice de Massa Corporal
Values with distinct subscript are different by the Tukey post-hoc test.
Figure 1 – Bland & Altman plots showing mean diference and 95% limits of agreement for measured and self-reported weight, height and body mass index (BMI) for adults from Brasilia, Brazil, 2006-2007.
was not a correlation between the mean and biases of weight and BMI for women (weight r = 0.041, p = 0.51 and BMI r= 0.03; p = 0.64). Among men, the correlation between the mean and the biases of weight and BMI was positive and significant (weight r = 0.17; p = 0.01 and BMI r = 0.17; p = 0.01), thus confir-ming the trend observed for weight obtained in the multivariate analysis.
Analysis of sensitivity and specificity for excess weight
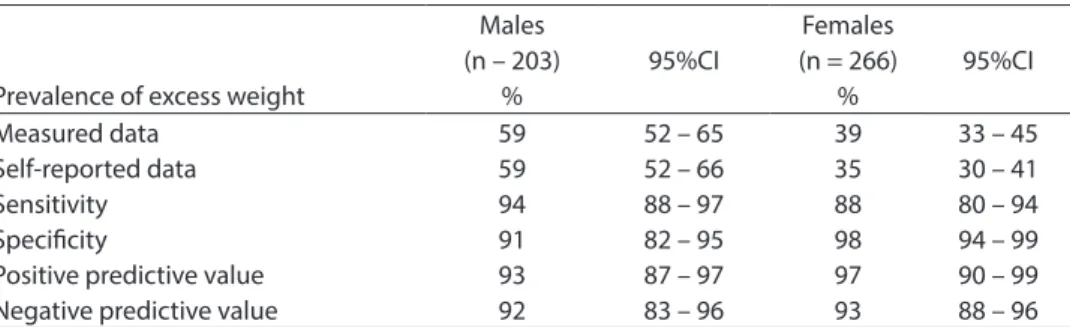
The results of values of sensitivity were 94% for men and 88% for women, which corresponds to the ability of an individual with excess weight to report their BMI ac-curately. Values were also high with regard to specificity, 90% for males and 98% for females, which represents the value refer-ring to a normal-weight individual’s ability to report their weight accurately (Table 3).
With regard to predictive values, 93% of men and 97% of women diagnosed with ex-cess weight through self-reported measures stated their weight and height accurately.
The negative predictive value refers to individuals who did not have excess weight. Therefore, a satisfactory result was obtai-ned, with 92% of men and 93% of women having accurately reported they did not have excess weight.
The analysis of sensitivity and specificity for excess weight, stratified into years of
study, revealed a sensitivity of 75% (95%CI of 62-90%) for women with 9-11 years of study (n = 99) and a negative predictive value of 87% (95%CI of 79-95%). All other values of sensitivity for men and women in different levels of education remained between 91% and 100%, whereas specificity remained between 87% and 100% (data not shown).
In the stratified analysis of age groups in men and of excess weight in women, specifi-city was 78% (95%CI of 60-98%) among males aged between 30 and 39 years (n =41) and the negative predictive value was 83% (95%CI of 65-100%). Sensitivity in males aged between 30 and 39 years was 86% (95%CI of 71-100%) and the positive predictive value was 83% (95%CI of 66-99%), thus confirming that men in this age group tend to overestimate excess weight. In addition, the sensitivity in females aged 60 years and more (n= 45) was 77% (95%CI of 60-94%) and the negative predictive value was 76% (95%CI of 58-93%), while specificity and the positive predictive value were 100% in both cases, thus confir-ming that women in this age group tend to underestimate excess weight.
Discussion
The present investigation showed that the means of weight, height and BMI cal-culated with self-reported values were close to measured values, in the population living in the city of Brasília. However, it should be
Table 3 – Excess weight prevalence based on measured and self-reported values and tested prevalence values for excess weight based on self-reported values.
Tabela 3 – Prevalência de excesso de peso baseado nos valores medidos e referidos e nos valores testados para a prevalência de excesso de peso baseado nos valores autorreferidos.
Prevalence of excess weight
Males (n – 203)
%
95%CI
Females (n = 266)
%
95%CI
Measured data Self-reported data Sensitivity Speciicity
Positive predictive value Negative predictive value
59 59 94 91 93 92
52 – 65 52 – 66 88 – 97 82 – 95 87 – 97 83 – 96
39 35 88 98 97 93
33 – 45 30 – 41 80 – 94 94 – 99 90 – 99 88 – 96
Excess weight defined by BMI (body mass index) ≥ 22,0, kg/m2
Excesso de peso definido pelo IMC (índice de massa corporal) ≥ 22,0, kg/m2
taken into consideration that the results show a wider limit of agreement, which could result in significant error in the indi-vidual information. The multiple analysis of variance revealed that there are individual characteristics which may affect the validity of self-reported results, such as age and BMI for men and level of education for women. In general, the study population tended to underestimate their weight (mean of -0.17kg) and height (mean of -1cm), similar to what was found by Schmidt et al.10 (1993)
with 659 adults living in the city of Porto Alegre (difference between self-reported and measured weight of -0.06kg). In another study conducted in Brazil, Fonseca et al.4
(2004) observed a trend towards overesti-mation of data with a mean difference of 1.09kg for weight and 0.65cm for height in a longitudinal study with 3,713 civil servants aged between 22 and 70 years.
In Sweden, a study conducted by Nyholm et al. 14 (2007) found a relatively high
mean difference between self-reported and measured height of 1.6kg in men and 1.8kg in women. With regard to height, there was a mean difference of -0.3cm in men and -0.4cm in women.
In the present study, the multiple analy-sis of variance showed that men with a low and normal BMI overestimate their weight, while those who are overweight and obese underestimate it. Schmidt et al. 10 (1993)
and Peixoto et al.13 (2006) also found similar
results. These behavioral patterns can be ex-plained by the dissatisfaction with the body image, when compared to the culturally accepted standard of beauty. 10;24
This study did not indicate any signifi-cant differences in information obtained from measured and self-reported weight (mean difference of 0.005 kg) in women. This shows that women are well aware of their body weight. The review study con-ducted by Engstrom et al.25 (2003) found that
women in the United States, Great Britain, Scandinavia, Western Europe, Australia, New Zealand and Asia tend to report a lo-wer weight and a greater height than those reported in the majority of studies on this
subject. This research project included 34 studies on the accuracy of self-reported weight in 57,172 women, all of which found underestimation of weight, whereas 26 studies on self-reported height in 39,244 women were analyzed and 21 of them found an overestimation of height.
An explanation for the difference betwe-en the results of Engstrom et al. 25 (2003) and
those found in this study could be due to the fact that the sample of the latter study was primarily comprised of women with a high socioeconomic and educational level. Villanueva11 (2001) observed that, the
higher the level of education, the smaller the difference between self-reported and measured weight.
Among women, height was influenced by level of education, as there was an asso-ciation between women with less than 12 years of study and overestimation of height. Brunner 26 (2007) confirmed these findings
in her study conducted in 381 women with a mean age of 30 years. Women with 9 to 11 years of study showed lower sensitivity when reporting excess weight. In this group with an intermediate level of education, the cultural pressures that interfere with the reporting of excess weight seem to have a greater influence than to women with a lower or higher level of education.
A study conducted in the city of Goiânia found that height was overestimated by wo-men, regardless of age group, level of educa-tion, income and BMI. However, there was an increase in self-reported height among women with a lower level of education, lower height and extreme BMI values, such as underweight and obesity. 13
This study’s findings of overestimation of height in men aged more than 60 years are similar to those of several studies. This fact could be explained by the longer periods of time that older individuals spend without taking anthropometric measurements, as-sociated with the natural process of height reduction with age. 2;3;27
means between the measured and self--reported BMI in women and men, which partially confirm the findings of Silveira et al. 15 (2005), whose results were accurate for
BMI means in males.
On the other hand, in a study conduc-ted with men and women aged between 16 and 64 years, Hill and Roberts 12 (1998)
found that the underestimation of BMI can be explained both by the overestimation of height and by the underestimation of weight. This fact was confirmed in a study conducted by Niedhammer 2 (2000), with an
underestimation of BMI (0.29 and 0.44kg/ m² in men and women, respectively), in which height was overestimated by 0.38cm in males and by 0.40cm in females, while weight was underestimated by 0.54kg in males and 0.85kg in females. According to the study conducted by Silveira et al. 15
(2005), women over 50 years of age with a low income underestimated their BMI by more than 2kg/m². In the present study, sensitivity was 77% for self-reported excess weight in women aged more than 60 years and the negative predictive value followed this result, confirming the fact that older wo-men tend to underestimate excess weight.
The acceptable limits of variation of self-reported weight (± 2kg) by height (± 1cm) were pre-established in the present study, based on researchers’ experience with anthropometry. These limits have been recently described by Brestoff et al. 28 (2011),
in a study that details the biases found in the results of self-reported weight, height and BMI. These authors describe an acceptable variation of 2kg, 2cm and 1.4kg/m², attribu-ted to errors inherent in measuring and tem-poral fluctuations of measurements. Mean overall bias for BMI, obtained by Brestoff et al., was -1.34 kg/m2, with values varying
between -3.54 and +3.01 kg/m2. In the adult
population of the city of Brasília, overall bias and 95% limits of agreement showed better agreement. Additionally, in the study conducted by Brestoff et al. 28 (2011), the
errors that most contribute to BMI report bias are shown in a decreasing order: under--reporting of weigh with overunder--reporting
of height; under-reporting of weight with accurate reporting of height; and accurate reporting of weight with over-reporting of height.28 In the present study, according
to the Blend-Altman plot, a more accurate reporting of weight and under-reporting of height were evidenced.
Previous studies 4;6 found specificity
values of approximately 98% for individu-als categorized as obese according to the measurements. In the present study, the results point towards excess weight and include the population with overweight and obesity, where specificity was 90% for males and 98% for females. Sensitivity in previous studies was 75%, although this referred to obese individuals, rather than those with excess weight. 4;6 Osuna-Ramirezet al. 29
(2006) showed an increase in sensitivity and specificity values when data were grouped for excess weight, when compared to those described for overweight and obesity se-parately. Excess weight values in Mexican adults were 82% and 91% for sensitivity and specificity, respectively. 29
Based on these results, it could be affir-med that the use of self-reported weight and height for clinical practice or for research with a clinical purpose must be avoided, because individual inconsistencies were significantly important, despite the small mean difference of self-reported data. 25 One
of the limitations of this study was that the refusal rate was higher than expected, i.e. more than 10%. However, due to the sam-pling design characteristics, participants represented the universe of sectors compri-sing the city of Brasília in a proportional way. The results obtained could help to correct the population’s self-reported data, espe-cially in surveys conducted by telephone.
association with socio-demographic factors for the difference between self-reported and measured weight. Men in the 30-to-39-year age group have lower specificity and women over 60 years of age have a lower sensitivity when reporting excess weight. The BMI ob-tained with self-reported weight and height can be used to follow excess weight.
Effectively, the use of self-reported data enables financial resources to be saved.
This is important when large population studies are performed, such as the VIGITEL (Telephone-based Surveillance of Risk and Protective Factors for Chronic Diseases), which is conducted by telephone.30 Based
on the results presented, studies that take advantage of the weight and height of a large number of individuals living in the city of Brasília can benefit from the use of self-reported weight and height.
References
1. Wada K, Tamakoshi K, Tsunekawa T, Otsuka R, Zhang H, Murata C et al. Validity of self-reported height and weight in a Japanese workplace population. Int J Obes 2005; 29(9): 1093-9.
2. Niedhammer I, Bugel I, Bonenfant S, Goldberg M, Leclerc A. Validity of self-reported weight and height in the French GAZEL cohort. Int J Obes Relat Metab Disord 2000; 24(9): 1111-8.
3. Kuczmarski MF, Kuczmarski RJ, Najjar M. Effects of age on validity of self-reported height, weight, and body mass index: findings from the Third National Health and Nutrition Examination Survey, 1988-1994. J Am Diet Assoc 2001; 101(1): 28-34; quiz 35-6.
4. Fonseca MJ, Faerstein E, Chor D, Lopes CS. Validade de peso e estatura informados e índice de massa corporal: estudo pró-saúde. Rev Saúde Pública 2004; 38(3): 392-8.
5. Gorber SC, Tremblay M, Moher D, Gorber B. A comparison of direct vs. self-report measures for assessing height, weight and body mass index: a systematic review. Obes Rev 2007; 8(4): 307-26.
6. Nieto-Garcia FJ, Bush TL, Keyl PM. Body mass definitions of obesity: sensitivity and specificity using self-reported weight and height. Epidemiology 1990; 1(2): 146-52.
7. Alvarez-Torices JC, Franch-Nadal J, Alvarez-Guisasola F, Hernandez-Mejia R, Cueto-Espina RA. Self-reported height and weight and prevalence of obesity: study in a Spanish population. Int J Obes Relat Metab Disord 1993; 17(11): 663-7.
8. Nakamura K, Hoshino Y, Kodama K, Yamamoto M. Reliability of self-reported body height and weight of adult japanese women. J Biosoc Sci 1999; 31(4): 555-8.
9. Bland JM, Altman DG. Statistical methods for assessing agreement between two methods of clinical measurement. Lancet 1986; 1(8476): 307-10.
10. Schmidt MI, Duncan BB, Tavares M, Polanczyk CA, Pellanda L, Zimmer PM. Validity of self-reported weight--a study of urban Brazilian adults. Rev Saúde Pública 1993; 27(4): 271-6.
11. Villanueva EV. The validity of self-report weight in US adults: a population based cross-sectional study. BMC Public Health 2001; 1: 11.
12. Hill A, Roberts J. Body mass index: a comparison between self-reported and measured height and weight. J Public Health Med 1998; 20(2): 206-10.
13. Peixoto Mdo R, Benício MH, Jardim PC. Validity of self-reported weight and height: the Goiânia study, Brazil. Rev Saúde Pública 2006; 40(6): 1065-72.
14. Nyholm M, Gullberg B, Merlo J, Lundqvist-Persson C, Råstam L, Lindblad U. The validity of obesity based on self-reported weight and height: Implications for population studies. Obesity 2007; 15(1): 197-208.
15. Silveira EA, Araújo CL, Gigante DP, Barros AJD, Lima MS. Validação do peso e altura Referidos para o diagnóstico do estado nutricional em uma população de adultos no sul do Brasil. Cad Saúde Pública 2005; 21(1): 235-45.
16. Brasil. Governo do Distrito Federal. Portal do Cidadão. Administrações Regionais, Brasília, RA I. Disponível em http://www.brasilia.df.gov.br/ [Acessado em 16 de abril de 2012]
17. Cochran WG. Sampling Techniques. 3rd ed. New York: Wiley; 1977.
18. Craig CL, Marshall AL, Sjöström M, Bauman AE, Booth ML, Ainsworth BE et al. International Physical Activity Questionnaire: 12-Country Reliability and Validity. Med Sci Sports Exerc 2003; 35(8): 1381-95.
19. World Health Organization (WHO). Guide to Physical Measurements (Step 2). WHO STEPS Surveillance; 2008.
20. World Health Organization (WHO). Obesity: preventing and managing the global epidemic. Geneva; 1997.
22. Hallal PC, Victora CG, Wells JC, Lima RC. Physical inactivity: prevalence and associated variables in Brazilian adults. Med Sci Sports Exerc 2003; 35(11): 1894-900.
23. Associação Nacional de Empresas de Pesquisa. ANEP. Critério de classificação econômica Brasil. São Paulo; 1996.
24. Ziebland S, Thorogood M, Fuller A, Muir J. Desire for the body normal: body image and discrepancies between self reported and measured height and weight in a British population. J Epidemiol Community Health 1996; 50(1): 105-6.
25. Engstrom JL, Paterson SA, Doherty A, Trabulsi M, Speer KL. Accuracy of self-reported height and weight in women: an integrative review of the literature. J Midwifery Women Health 2003; 48(5): 338-45.
26. Brunner Huber LR. Validity of self-reported height and weight in women of reproductive age. Matern Child Health J 2007; 11(2): 137-44.
27. Lim LL, Seubsman SA, Sleigh A. Validity of self-reported weight, height, and body mass index among university students in Thailand: Implications for population studies of obesity in developing countries. Popul Health Metr 2009; 7: 15.
28. Brestoff JR, Perry IJ, Van den Broeck J. Challenging the role of social norms regarding body weight as an explanation for weight, height, and BMI misreporting biases: development and application of a new approach to examining misreporting and misclassification bias in surveys. BMC Public Health 2011; 11: 331.
29. Osuna-Ramírez I, Hernández-Prado B,Campuzano JC, Salmerón J. Body mass index and body image perception in Mexican adult population: The accuracy of self-reporting. Salud Publica Mex 2006; 48: 94-103.
30. BRASIL. Ministério da Saúde. Secretaria de Vigilância em Saúde. Secretaria de Gestão Estratégica e Participativa. Vigitel Brasil 2011: vigilância de fatores de risco e proteção para doenças crônicas por inquérito telefônico. Disponível em http://portalsaude.saude.gov.br/ portalsaude/arquivos/pdf/2012/Abr/10/vigitel_100412. pdf [Acessado em 15 de abril de 2012]