Air pollutants and hospital admission due to pneumonia in children:
a time series analysis
LAÍS SALGADO VIEIRADE SOUZA1, LUIZ FERNANDO COSTA NASCIMENTO²*
1Medical Student, Department of Medicine, Universidade de Taubaté (Unitau), Taubaté, SP, Brazil
²PhD in Public Health. Assistant Professor, Department of Medicine, Unitau, Taubaté, SP, Brazil
S
UMMARYStudy conducted at the Department of Medicine at Universidade de Taubaté (Unitau), Taubaté, SP, Brazil
Article received: 6/4/2014
Accepted for publication: 10/22/2014
*Correspondence:
Address: Avenida Tiradentes, 500 Taubaté, SP – Brazil Postal code: 12030-180 Phone/fax: +55 12 3625-4271 [email protected]
Financial support: São Paulo State Research Foundation (Fapesp)
http://dx.doi.org/10.1590/1806-9282.62.02.151
Objective: The aim of this study was to estimate the association between expo-sure to air pollutants and hospitalization for pneumonia among children in a medium-sized city located in the sugar cane plantation region of São Paulo State.
Methods: An ecological time-series study was conducted with daily data of hospi-talization for pneumonia including children aged 10 years or younger living in Ar-araquara, state of São Paulo, from January 1st, 2010, to November 30th, 2012. To
es-timate the association between hospitalization due to pneumonia and particulate pollutants with aerodynamic diameter less than 10 µm, nitrogen dioxide and ozone, relative risks for hospitalization according to a generalized additive model of Pois-son regression, with Lags of up to ive days, were calculated. A percentage increase (PI) was obtained for relative risk (IRR – increase on relative risk) of hospitalization at each 10 μg/m3 increment in each air pollutants adjusted for the remaining. Results: A total of 234 hospitalizations were recorded during these three years. There was a strong association between hospitalization and PM10 and NO2. The
PI in relative risk was 15% to PM10 in Lag 0 and 7% points in Lag 1 for NO2. Conclusion: There was evidence of the action of air pollutants on hospitaliza-tion for pneumonia in a medium-sized city located in a region affected by air pollution from sugarcane burning and the data presented here provide subsi-dies for the implementation of public policies aiming to decrease this risk.
Keywords: Pneumonia, air pollutants, particulate matter, nitrogen dioxide, child health, time-series studies.
INTRODUCTION
It is known that chronic exposure of children and ado-lescents to air pollution leads to decreased development and lung function, and also an increased number of ep-isodes of respiratory disease and hospitalizations.1,2 Air
pollutants associated with these effects include nitrogen dioxide (NO2), ozone (O3) and particulate matter with an
aerodynamic diameter less than 10 µm (PM10).3
Exposure to PM10 is associated with increased
morbid-ity due to local inlammation, injury by oxidative stress and endothelial dysfunction.4 Particulate matter
originat-ing mainly from burnoriginat-ing fossil fuels and biomass (such as burning of sugarcane straw), is associated with increased symptoms and respiratory disease, increased incidence of asthma and pneumonia, and infant mortality.5,6
Exposure to NO2 alters the mucociliary clearance
mech-anism, particle transport, and local immunity, favoring the
onset of respiratory infections.7 This compound is formed
during combustion processes; therefore, in large urban centers, vehicles are usually the major emitters.
NO2 also plays an important role in the generation
of O3 in troposphere, it is considered toxic and harmful
to health, and is associated with decreased lung function, increased airway reactivity and inlammation and im-paired macrophage function.5 O
3 is a powerful oxidant
that causes irritation to the eyes and respiratory tract, re-ducing lung capacity.7
It is believed that the adverse effects caused by expo-sure to environmental pollutants have a Lag of behavior, that is, an individual exposed to a pollutant today is like-ly to present some respiratory disease a few days later.8
However, there are few studies on the effects of air pollution outside of major urban centers, especially in areas where there is biomass burning such as sugarcane straw.13-15
Thus, the objective of this study was to estimate the association between exposure to air pollution and hospi-tal admissions for pneumonia in children living in Ara-raquara, a medium-sized municipality in the state of São Paulo, in the period from January 2010 to November 2012.
METHODS
The study was conducted in the municipality of Ara-raquara, considered medium size, with a population around 210,000 inhabitants, located in the central por-tion of the state of São Paulo (21º47’40” S, 48º10’32” O). It is located 273 km away from the state capital, and cov-ers the area of 1,003.674 km2. Araraquara has a vehicle
leet estimated at about 150 thousand vehicles. This city has an intense activity linked to the sugar and alcohol in-dustry and, between the months of April and November, there is burning of sugarcane straw.
This is an ecological time series analysis, in which daily hospitalizations for pneumonia (10th revision of the
Inter-national Statistical Classiicationof Diseases and Related Health Problems, ICD-10, J12 to J18 codes) in children aged 10 years or younger, from January 1st, 2010, to November
30th, 2012, were selected. These data were obtained from the
database of the SUS Department of Informatics (Datasus).16
Daily data of pollutants NO2, O3 and PM10, as well as
temperature and humidity were obtained from the São Paulo State Environmental Sanitation Company (Cetesb).17
Both descriptive and statistical analyses, with a Lag from 0 to 5 days, were conducted. The estimated risk for hospital-ization due to pneumonia caused by exposure to pollutants was done using a generalized additive Poisson regression mod-el (GAM). For this, the air pollutants were always analyzed together in a multi-pollutant model, adjusted for humidity and temperature. The relative risk of hospitalization was ob-tained at increments of 10 μg/m3 (IRR) for each pollutant,
adjusted to the remaining using the following formula:
IRR (%) = (exp10xβ-1) × 100
In the equation, β is the coeficient obtained from GAM adjusted for each pollutant in relation to the remaining. The software used for analysis was Statistica 7.
RESULTS
During the study period there were 234 hospitalizations of children with pneumonia, aged 0 to 10 years and res-ident in Araraquara. The daily average was 0.22
admis-sions (SD=0.48), ranging from 0 to 3. The months with the highest hospitalizations numbers were April, May and June 2010 with 10 admissions each, August 2011 with 11, and May 2012 with 25. This distribution coin-cides with the months of sugarcane straw burning that occur each year between April and November. There was no record in 27 days (2.50% of days) of temperature and humidity, 30 days (2.82%) for O3, 88 days (8.26%) for NO2
and 50 days (4.69%) for PM10 within the period of study.
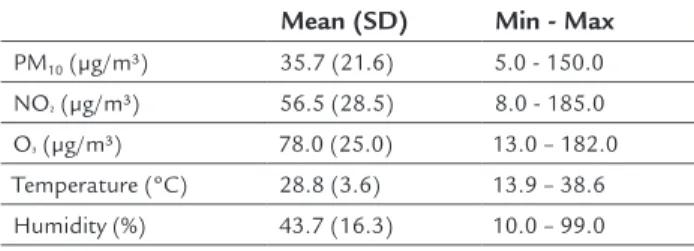
Information on hospital admissions caused by pneumo-nia was available throughout the study period. The lack-ing data did not compromise the inal results in this study. A descriptive analysis of the variables is shown in Table 1.
TABLE 1 Descriptive analysis of atmospheric and climatic variables, Araraquara, 2010-2012.
Mean (SD) Min - Max
PM10 (μg/m3) 35.7 (21.6) 5.0 - 150.0
NO² (μg/m3) 56.5 (28.5) 8.0 - 185.0 O3 (μg/m3) 78.0 (25.0) 13.0 – 182.0 Temperature (ºC) 28.8 (3.6) 13.9 – 38.6 Humidity (%) 43.7 (16.3) 10.0 – 99.0
SD: Standard deviation.
Another point that draws attention is the high average val-ues for concentration of pollutants, possibly due to the burning of sugarcane straw that occurs in this region. Re-garding PM10 values, there were 103 days in 2010, 84 days
in 2011 and 33 days in 2012 that were above the standard limit of air quality according to the World Health Organi-zation (WHO)18 with a daily average of (50 μg/m3).
Nitro-gen dioxide exceeded the limits of the annual arithmetic average for the three years of study (40 μg/m3). O
3 in turn,
presented 60 days in 2010, 31 days in 2011 and 86 days in 2012 above the average limit for 8 hours (100 μg/m3).
Distributions of daily concentrations of pollutants quantiied in Araraquara show seasonal characteristics for PM10 and NO2 (data not shown).
Table 2, which displays the Pearson correlation matrix for the selected variables, it can be seen that hospitalizations are positively correlated with the concentrations of PM10
and NO2, and that the pollutants are signiicantly
correlat-ed to each other. All pollutants present negative and signif-icant correlations with the content of relative humidity, and positive and signiicant correlations with temperature.
TABLE 2 Correlation matrix for pollutants, climate variables and hospitalization, Araraquara, 2010-2012.
Inter# PM10 Temp Humid O3 NO2 Inter# 1.00 0.10* -0.05 -0.04 -0.01 0.07* PM10 - 1.00 0.23* -0.64* 0.55* 0.58* Temp - - 1.00 -0.54* 0.55* 0.16*
Humid - - - 1.00 -0.64* -0.57* O3 - - - - 1.00 0.45*
NO2 - - - 1.00
*p<0.05; #Admissions; Temp: Temperature; Humid: Humidity.
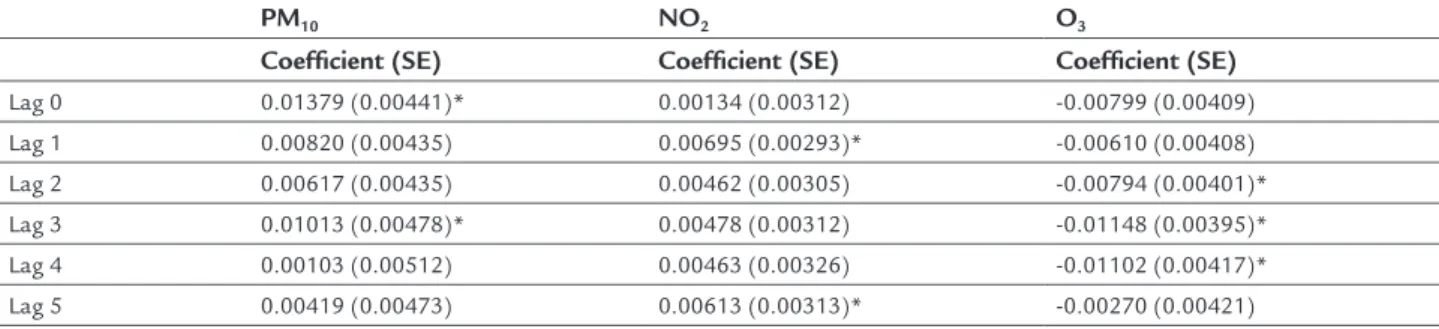
The association that occurs in the second and third days after exposure to PM10, and in the irst and ifth day
af-ter exposure to nitrogen dioxide, is noteworthy. Ozone displays a paradoxical pattern.
Relative risks and their respective conidence inter-vals of 95% for hospitalization, obtained based on multi-pollutant model for the increase of 10 µg/m3 of each
pol-lutant, are shown in Figure 1.
The effect of exposure to PM10 as a risk factor for Lag
0 (same day of exposure) and on the third day of expo-sure (Lag 3) is observed. Increments of 10 µg/m3 in this
pollutant lead to increase of 15% in relative risk. The mechanism that appears to explain this is the acute re-lease of inlammatory mediators. NO2 represents a risk
factor for Lag 1 and Lag 5, and 10 µg/m3 increments of
this pollutant lead to increase of 7% in relative risk. O3,
in turn, did not behave as a risk factor.
DISCUSSION
There are few studies on the effects of pollution as a cause of hospitalization for pneumonia, especially in mid-sized cities located in regions of sugarcane plantation affected by straw burning, such as Araraquara.
Time-series studies show the association between lev-els of air pollutants and number of hospitalization for
respiratory diseases in Brazilian state capitals including São Paulo,6,9,10 Campo Grande,19 Rio de Janeiro20 and
Cu-ritiba8. But there are few studies conducted in cities
lo-cated in regions producing sugarcane correlating the ef-fects of straw burning and its impact on population health.21,22
In the present study, it was found that the distribu-tion of air pollutants has seasonal aspects, and the aver-age levels of these pollutants were below those observed by Braga et al.9 and Bakonyi et al.8, although higher than
those found by Souza et al.19 in a study carried out in
Campo Grande, MS, and by Moura et al.20 in Rio de
Ja-neiro. This result is quite interesting since Araraquara is a medium-sized city located in the state of São Paulo. Such higher levels of pollutants compared to large urban centers can be explained by the location in one of the larg-est regions of sugarcane culture, where the practice of burning straw is widely used.
In the three years of study, all analyzed pollutants ex-ceeded the limits imposed by the WHO. In the case of PM10,
annual exposure levels above 70 μg/m3 are associated with
signiicant deleterious health effects, leading to up to 15% increased mortality. O3 presented an average
concentra-tion of 78 μg/m3 and time series studies found increased mortality close to 0.3-0.5% for each 10 μg/m3 increment in
its concentration beginning with 70 μg/m3. Additionally,
studies show that chronic exposure to NO2 at annual
av-erage concentrations above 40 μg/m3 are associated with
increased symptoms in asthmatic children.18
PM10 was signiicantly associated hospitalizations for
pneumonia both on the same day of exposure and on the third day after it. The pollutant’s effect is immediate, i.e. in the day of exposure, but can also be noticed days later. Negrisoli et al.14 observed this association at Lag 4 in a
study conducted in Sorocaba, SP, on hospitalizations due to pneumonia, and Nascimento et al.3 noted that the
ef-TABLE 3 Coefficients and standard errors (SE) for environmental pollutants on every day of the analyzed Lag structure. Araraquara, SP, 2010 − 2012.
PM10 NO2 O3
Coeficient (SE) Coeficient (SE) Coeficient (SE)
Lag 0 0.01379 (0.00441)* 0.00134 (0.00312) -0.00799 (0.00409) Lag 1 0.00820 (0.00435) 0.00695 (0.00293)* -0.00610 (0.00408)
Lag 2 0.00617 (0.00435) 0.00462 (0.00305) -0.00794 (0.00401)* Lag 3 0.01013 (0.00478)* 0.00478 (0.00312) -0.01148 (0.00395)* Lag 4 0.00103 (0.00512) 0.00463 (0.00326) -0.01102 (0.00417)*
Lag 5 0.00419 (0.00473) 0.00613 (0.00313)* -0.00270 (0.00421)
fects of PM10 on hospital admissions due to pneumonia
in the city of São José dos Campos, SP, became relevant only three or four days after exposure.
In a study by Cesar et al.,13 conducted in the
munic-ipality of Piracicaba, SP, the authors were able to observe that increments of 10 mg/m3 in the level of inhalable ine
particulate matter (PM2.5) are associated with increases
of 7.9 (Lag 1) and 8.6% (Lag 3) in hospitalizations due to
respiratory diseases. Arbex et al.15 linked this increase to
a 6% increase in demand for emergency service caused by pneumonia at a hospital in Araraquara, Brazil.
Nitrogen dioxide was associated with hospitalizations for pneumonia, presenting as a risk factor in the irst and ifth day after exposure. The average values found in this study (56.5 μg/m3) were below those found for the
munic-ipality of São Paulo (103 μg/m3),23 and above the results
found in Sorocaba (48.1 μg/m3).14 Nevertheless, exposure
to this pollutant in both cities was associated with hospi-talization for pneumonia, with double the risk compared to our study. Moreover, a study conducted in Cubatão with a metering station for NO2, whose averages were around
27 μg/m3, failed to identify an association between expo-sure to NO2 and pneumonia in children.24 In a study
con-ducted in Rio de Janeiro25 regarding pediatric emergency
care in public health units, it was not possible to associate these services to exposure to NO2. Other comparisons were
not possible due to the lack of studies in Brazil on expo-sure to NO2 and pediatric hospitalizations for pneumonia.
With regard to ozone, the pollutant was not statisti-cally signiicant as a risk factor in any of the analyzed Lag structures. This result is consistent with studies conduct-ed in Sorocaba14 and São José dos Campos26 where O
3
rep-resented no risk for hospitalization for asthma and pneu-monia, respectively. However, a study by Bakonyi et al.8
revealed a statistically signiicant effect in the case of ozone, only for the mobile average of three days. This statistical difference may be due to the fact that their study variable were individuals aged 0-14 years treated for all respiratory causes, and not only pneumonia, and also the fact that they used mobile averages, not Lag, as in the present study. A limitation in this study may result from the exclu-sion of hospitalizations in the context of health insurance and other funding sources other than the SUS, as well as pneumonia in children treated on an outpatient basis, that is, that did not result in hospitalization and thus not in-cluded in the study. In addition, errors in ICD coding of the disease may have contributed to an inaccurate account-ing of cases. These limitations mentioned above could con-tribute to an underreporting of cases of the disease. It should be noted, however, that the Datasus is an oficial source of the Ministry of Health and the data provided by the portal serve as material for conducting epidemiologi-cal studies. The hospital records refer to the portion of the population that uses the public health service, which is the majority of the population. Errors in diagnosis or double counting of the same patient may have occurred.
Failures in the monitoring of pollutants during the study cause lack of data, both in isolated days and on
con-FIGURE 1 Relative risks for hospitalization caused by pneumonia
due to increases of 10 µg/m3 in PM10, NO2 and O3 pollutants, with 0- to 5-day Lag. Araraquara, 2010-2012.
PM10
1.3
1.2
1.1
1
0.9
0.8
Lag0 Lag1 Lag2 Lag3 Lag4 Lag5
1.3
1.2
1.1
1
0.9
0.8
Lag0 Lag1 Lag2 Lag3 Lag4 Lag5
NO²
O3
1.3
1.2
1.1
1
0.9
0.8
secutive days. However, in ecological studies of time se-ries with daily data, the absence of some of the igures did not affect the inal results. Individual exposures to the gases analyzed were not considered, and their con-centrations were treated as homogeneous throughout the municipality.
CONCLUSION
The results allowed us to associate PM10 and NO2 to the
hospitalization of children aged 10 years or younger due to pneumonia in a mid-sized city located in an area af-fected by air pollution caused by the burning of sugar-cane straw. These indings are important for the creation of health policies in the municipality, and reinforce the importance of incentives regarding a ban on such prac-tice in sugarcane plantations.
ACKNOWLEDGMENTS
To the Environmental Sanitation Technology Company (Cetesb) for making its database available, and the São Paulo State Research Foundation (Fapesp) for a scientif-ic initiation scholarship (process 2013/11490-9).
RESUMO
Poluentes atmosféricos e internações por pneumonia em crianças. Um estudo de série temporal
Objetivo: estimar a associação entre exposição a poluen-tes atmosféricos e internações por pneumonia em crian-ças de uma cidade de médio porte em região de plantio de cana-de-açúcar no Estado de São Paulo.
Métodos: estudo ecológico de séries temporais com
da-dos de internação por pneumonia em crianças com até 10 anos de idade residentes em Araraquara, SP, de 1 de ja-neiro de 2010 a 30 de novembro de 2012. Para estimar a associação entre internações por pneumonia e material particulado (MP) com diâmetro aerodinâmico inferior a 10 µm, dióxido de nitrogênio e ozônio, foram calculados os riscos relativos para internação segundo modelo adi-tivo generalizado de regressão de Poisson, com defasa-gens de até cinco dias. Foi obtido o aumento percentual (ppt) no risco relativo (ARR – aumento no risco relativo) para internação segundo aumento de 10 μg/m3 para cada
poluente ajustado para os demais.
Resultados: registraram-se 234 internações nos três anos de estudo. Houve forte associação entre as internações e o MP10 e o NO2. O ARR foi de 15 ppt para MP10 no
mes-mo dia da exposição e de 7 ppt no primeiro dia após a ex-posição ao NO2.
Conclusão: houve evidências da ação de poluentes do ar sobre internações por pneumonia em uma cidade de mé-dio porte em região afetada por poluição do ar decorren-te de queima da palha da cana-de-açúcar. Os dados apre-sentados fornecem subsídios para implantação de políticas públicas visando à diminuição desses riscos.
Palavras-chave: pneumonia, poluentes do ar, material
particulado, dióxido de nitrogênio, saúde da criança, es-tudos de séries temporais.
REFERENCES
1. Brauer M, Hoek G, Smit HA, Jongste JC, Gerritsen J, Postma DS, et al. Air pollution and development of asthma, allergy and infections in a birth cohort. Eur Respir J. 2007; 29(5):879-88.
2. Gauderman WJ, Avol E, Gilliland F, Vora H, Thomas D, Berhane K et al. The effect of air pollution on lung development from 10 to 18 years of age. N Engl J Med. 2004; 351(11):1057-67.
3. Nascimento LFC, Pereira LAA, Braga ALF, Módolo MCC, Carvalho JA. Efeitos da poluição atmosférica na saúde infantil em São José dos Campos, SP. Rev Saúde Pública. 2006; 40(1):77-82.
4. Pope CA, Dockery DW. Health effects of ine particulate air pollution: lines that connect. J Air Waste Manage Assoc. 2006; 56(6):709-42.
5. Committee of the Environmental and Occupational Health Assembly of the American Thoracic Society. Health effects of outdoor air pollution. Am J Respir Crit Care Med. 1996; 153(1):3-50.
6. Lin CA, Martins MA, Farhat SCL, Pope CA, Conceição GMS, Anastácio VM, et al. Air pollution and respiratory illness of children in São Paulo, Brazil. Pediatr Perinat Epidemiol. 1999; 13(4):475-88.
7. Arbex MA, Santos UP, Martins LC, Saldiva PH, Pereira LA, Braga AL. Air pollution and the respiratory system. J Bras Pneumol. 2012; 38(5):643-55. 8. Bakonyi SMC, Danni-Oliveira IM, Martins LC, Braga ALF. [Air pollution
and respiratory diseases among children in the city of Curitiba, Brazil]. Rev Saúde Pública. 2004; 38(5):695-700.
9. Braga ALF, Conceição GMS, Pereira LAA, Kihi HS, Pereira JCR, Andrade MF, et al. Air pollution and pediatric respiratory hospital admissions in São Paulo, Brazil. J Environ Med. 1999; 1(2):95-102.
10. Braga ALF, Saldiva PHN, Pereira LAA, Menezes JJC, Conceição GMS, Lin CA, et al. Health effects of air pollution exposure on children and adolescents in São Paulo, Brazil. Pediatr Pulmonol. 2001; 31(2):106-13.
11. Fioravante C. Estufa que exporta poluição. Rev Pesquisa FAPESP. 2002; 71:128-35.
12. Pereira LAA, Loomis D, Conceição GMS, Braga ALF, Arcas RM, Kishi HS, et al. Association between air pollution and intrauterine mortality in São Paulo, Brazil. Environ Health Perspect. 1998; 106(6):325-9.
13. Cesar ACG, Nascimento LFC, Carvalho Jr JAD. Associação entre exposição ao material particulado e internações por doenças respiratórias em crianças. Rev Saúde Pública. 2013; 47(6):1209-12.
14. Negrisoli J, Nascimento LFC. Atmospheric pollutants and hospital admissions due to pneumonia in children. Rev Paul Pediatr. 2013; 31(4):501-6. 15. Arbex MA, Pereira LAA, Carvalho-Oliveira R, Saldiva PHN, Braga ALF. The
effect of air pollution on pneumonia-related emergency department visits in a region of extensive sugar cane plantations: a 30-month time-series study. J Epidemiol Community Health. 2014; 68(7):669-74.
16. Brasil. Departamento de Informações e Informática do Sistema Único de Saúde, DATASUS. [cited 2014 May 20]. Available from: http://www2.datasus. gov.br/DATASUS/index.php.
17. Companhia de Tecnologia de Saneamento Ambiental, CETESB. [cited 2013 Sep 20]. Available from: http://www.cetesb.sp.gov.br.
18. World Health Organization. WHO Air Quality Guidelines for particulate matter, ozone, nitrogen dioxide and sulfur dioxide. Global Update 2005. Summary of risk assessment. [cited 2014 May 20]. Available from: http:// whqlibdoc.who.int/hq/2006/WHO_SDE_PHE_OEH_06.02_eng.pdf. 19. Souza A, Schujmann E, Fachel JMG, Fernandes WA. Indicadores ambientais
20. Moura M, Junger WL, Mendonça GAS, Leon AP. Air quality and emergency pediatric care for symptoms of bronchial obstruction categorized by age bracket in Rio de Janeiro, Brazil. Cad Saúde Pública. 2009; 25(3):635-44. 21. Arbex MA, Bohn GM, Saldiva PHN, Conceição GMS, Pope AC, Braga ALF.
Assessment of the effects of sugar cane plantation burning on daily counts of inhalation therapy. J Air Waste Manag Assoc. 2000; 50(10):1745-9. 22. Arbex MA. Avaliação dos efeitos do material particulado proveniente da
queima da plantação de cana-de-açúcar sobre a morbidade respiratória na população de Araraquara-SP. [Thesis]. São Paulo: Faculdade de Medicina, Universidade de São Paulo, 2002.
23. Gouveia N, Freitas CU, Martins LC, Marcilio IO. Respiratory and cardiovascular hospitalizations associated with air pollution in the city of São Paulo, Brazil. Cad Saúde Pública. 2006; 22(12):2669-77.
24. Jasinski R, Pereira LA, Braga AL. Air pollution and pediatric hospital admissions due to respiratory diseases in Cubatão, São Paulo state, Brazil, from 1997 to 2004. Cad Saúde Pública. 2011; 27(11):2242-52.
25. Moura M, Junger WL, Mendonça GA, Leon AP. [Air quality and acute respiratory disorders in children. Rev Saúde Pública]. 2008; 42(3):503-11. 26. Amancio CT, Nascimento LFC. Asma e poluentes ambientais: um estudo