DOI: 10.1590/0004-282X20160156 ARTICLE
Prevalence of chronic pain in a
metropolitan area of a developing country:
a population-based study
Prevalência de dor crônica em área metropolitana de um país em desenvolvimento:
um estudo populacional
Karine A. S. Leão Ferreira1,2, Telma Regina P. D. Bastos3, Daniel Ciampi de Andrade1,5, Aline Medeiros Silva3,
José Carlos Appolinario4, Manoel Jacobsen Teixeira1,5,6, Maria do Rosário Dias de Oliveira Latorre7
Chronic pain (CP) is deined as pain that persists after the normal period for lesion healing and continues for at least three months1. It can be continuous or intermittent. It is estimated
that CP prevalence varies from 7%2,3 to 48%4, depending on the
population studied. Developing countries are deined as having a Human Development Index (HDI) bellow 0.9. While several studies have reported CP data in speciic population samples from developing countries, such as the prevalence of CP in the
1Universidade de São Paulo, Departamento de Neurologia, Centro de Dor, São Paulo SP, Brasil; 2Universidade de Guarulhos, Escola de Enfermagem, Guarulhos SP, Brasil;
3Janssen-Cilag Farmacêutica, Departamento de Ciência Médica, São Paulo SP, Brasil; 4Universidade Federal do Rio de Janeiro, Rio de Janeiro RJ, Brasil;
5Universidade de São Paulo, Instituto do Câncer Octavio Frias de Oliveira, Centro de Dor, São Paulo SP, Brasil; 6Hospital Alemão Oswaldo Cruz, São Paulo SP, Brasil;
7Universidade de São Paulo, Escola de Saúde Pública, Departamento de Epidemiologia, São Paulo SP, Brasil.
Correspondence: Daniel Ciampi de Andrade; Divisão de Clínica Neurológica do Hospital das Clínicas da FMUSP; Secretaria da Neurologia, Instituto Central; Av. Dr. Enéas de Carvalho Aguiar, 255 / 5º andar / sala 5084; 05403-900 São Paulo SP, Brasil; E-mail: [email protected]
Conlict of interest: There is no conlict of interest to declare:
Support: Janssen-Cilag Farmacêutica, Brazil, and Centro de Dor, Departamento de Neurologia, Universidade de São Paulo, Brasil. Received 03 May 2016; Accepted 01 September 2016.
ABSTRACT
Objective: To estimate the prevalence of chronic pain (CP) in the adult population living in the city of São Paulo, Brazil, and to identify factors associated with CP in developing countries. Methods: A cross-sectional study using a computer-assisted telephone interview in a two-stage stratiied sample of adults living in households. Results: 2,446 subjects were interviewed. The mean age was 39.8 years old. The majority was female and 42.7% had less than 10 years of education. The prevalence of CP was 28.1%. The independent factors associated with CP were female gender (OR = 2.0; p < 0.001), age older than 65 years (OR = 1.4; p = 0.019) and less than 15 years of education (OR = 1.3-1.6; p < 0.04). Conclusions: The prevalence of CP was high and similar to that which has been reported in developed countries. These results raise awareness about CP and may potentially help clinicians and policy makers to design better health care programs for CP treatment in these populations.
Keywords: chronic pain; population; prevalence; developing countries.
RESUMO
Objetivo: Estimar a prevalência de dor crônica (DC) na população adulta residente na cidade de São Paulo, Brasil, e assim identiicar os fatores associados com DC em países em desenvolvimento. Método: Estudo transversal utilizando entrevista por telefone auxiliada por computador em duas etapas numa amostra estratiicada de adultos domiciliados em São Paulo. Resultados: 2446 indivíduos foram entrevistados. A média de idade foi 39,8 anos. A maioria foi do sexo feminino e 42,7% tinham menos de 10 anos de escolaridade. A prevalência de DC foi de 28,1%. Os fatores independentes associados à DC foram gênero feminino (OR = 2,0; p < 0,001), idade superior que 65 anos (OR = 1,4; p = 0,019) e menor que 15 anos de escolaridade (OR = 1,3-1,6; p < 0,04). Conclusão: A prevalência de DC foi alta e próxima à reportada em países desenvolvidos. Estes resultados irão auxiliar proissionais de saúde e gestores a realizarem programas de avaliação e tratamento de dor crônica mais ajustados à realidade local.
elderly, and joint symptoms5, data on CP prevalence in the gen
-eral adult population in developing countries are still scarce. In fact, a systematic review in countries with a HDI bellow 0.9 published a few years ago included only a few studies report -ing CP prevalence in these regions of the world6; most of them
did not assess individuals from the general population. For in -stance, one of the studies included in the review was primar -ily aimed at mood disorders7, and another included patients
actively looking for primary care assistence8. Subsequently,
the authors of this systematic review concluded that the low number of CP prevalence studies in low-HDI countries un -dermined their analyses and prevented further comparisons with the CP prevalence in high-HDI regions. hus, while sev -eral studies have revealed the prevalence and risk factors for CP in developed countries2,9,10, studies in developing countries
are still scarce and heterogeneous11,12 and the associated risk
factors of CP are still a matter of debate. Population-based studies suggest that CP can be associated with age, gender, socio-economic level11, among other co-morbidities4, 9,13,14,15.
Pain is a multidimensional experience that can vary ac -cording to cultural, emotional, physical and social character -istics. Cultural diferences can be identiied among countries or among diferent regions in the same country, interfering with the assessment of the prevalence of pain. hus, the pres -ent study reports the results of the Brazilian Study of the Prevalence of Chronic Pain (EPI-DOR), which aimed to es -timate the prevalence of CP, to describe pain characteristics and to identify possible factors associated with CP among the general population in the city of São Paulo, Brazil.
METHODS
Study design and setting
he present study was approved by our Institutions’ Ethics Review Board. he EPI-DOR, an observational, cross-sectional population-based survey assessed pain in adults living in households in São Paulo, Brazil. São Paulo has a population over of 10 million people; approximately 76% of its households have an active telephone line16,17,18.
Sample size and participants
he sample size was determined by the primary aim of the study, which was to estimate the prevalence of CP. he estimated sample size was originally calculated to include 2,000 adults, based on a CP prevalence of 50%, maximum error of ± 2%, and a conidence interval of 95%. he sample size was then extended to 2,446 persons in order to cover the forecast losses of 20% of adults living in households.
A simple random, two-stage stratiied sample design was used. he sampling process was as follows: (a) a systemat -ic sample of 6,000 generated household telephone numbers was extracted, based on a telephone list obtained from the local telephone company; and (b) the telephone lines were
re-sampled into 40 interpenetrating sub-samples, each in -cluding a sample of 200 telephone numbers. A random sam -ple of the household member to be interviewed from each interpenetrating subsample was selected. Eligible subjects were required to (a) be 18 years of age or older and (b) live in a house with access to a landline telephone. Verbal informed consent was obtained from all respondents.
Data collection and measurements
Data were collected by telephone interview, using computer-assisted telephone interview software developed speciically for the present study. Some measures were ad -opted to prevent non-response and non-response bias. hese included: (a) speciic training of interviewers; (b) standard -ized content of the interviews, which included an introduc -tory presentation as an initial part of the telephone contacts; and (c) standard operational procedures for contacts and callbacks in case of failed contact. Each selected telephone number was contacted up to 10 times on diferent days and at diferent time-periods of the day. In previous studies, up to six attempts were made19. However, some individuals were
unreachable after ive to six attempts. hus, in the present study ten attempts were arbitrarily deined as the standard operational procedure in case of failed contacts. he tele -phone contact occurred on weekdays and weekends from 8 a.m. to 9 p.m. A respondent was randomly selected from each household by the software, after identifying the num -ber of household mem-bers who were 18 years of age or older. If an eligible subject agreed to participate, a verbal informed consent was obtained. he refusal rate and the time spent in each interview were recorded.
Structured telephone interview questionnaire
he survey instrument used in this study included 43 questions and was based on a Brazilian Pain Questionnaire for population-based surveys developed by Moreira Júnior and Souza20; the Brief Pain Inventory21; and on the question
-naire proposed by Breivik and colleagues2.
he questionnaire was composed of two parts. he irst part assessed demographic and clinical characteristics (sex, age, level of education, religion, work/employment status, weight, height, co-morbidities, and nutritional status). he nutritional status of respondents was classiied accord -ing to their body-mass index, consider-ing the World Health Organization cut-of points. Self-reported weight and height were used to calculate body-mass index. he educational lev -el of respondents was determined by years of education.
regarding pain characteristics using the second part of the questionnaire which assessed: (a) frequency, duration and in -tensity of pain; (b) location of pain; (c) use of pharmacological and non-pharmacological interventions to treat pain in the last 12 months; (d) who ordered or suggested the pain treat -ments; (e) other pain characteristics and pain interference, using the Brazilian version of the Brief Pain Inventory21.
he Brief Pain Inventory asks patients to rate their inten -sity of pain (highest, lowest, and average), and the pain inter -ference (with general activities, mood, walking ability, normal work, relationships with others, sleep, and enjoyment of life) on an 11-point scale ranging from 0 (no pain/no interference) to 10 (as bad as it can be), over the past 24 hours and over the last three months21.
Statistical analyses
Computerized weighting was used in the analyses. Data from each subject were weighted by the number of adult household members to compensate for any diferences in the probabilities of selection among eligible respondents in each house. To reduce the bias due to the non-respondents and make estimations for São Paulo’s general population, the dis -tributions of the study sample according to age, sex, and level of education (12 population strata) were compared and ad -justed to the distribution in the city of São Paulo, using data from the 2000 Brazilian census (the version available when the study was designed) carried out by the Brazilian Institute of Geography and Statistics.
Statistical analyses were performed using the Statistical Package for the Social Sciences, Version 15.0® (Chicago, IL).
Descriptive statistics were generated on the sample char -acteristics. Univariate and multivariate analyses were used to identify factors associated with CP. he Chi-square test and multiple logistic regression models (adjusted odds ra -tio) were applied to examine the association between CP (dependent variable) and demographic characteristics (inde -pendent variables). Multiple logistic regression models were performed to measure the association between CP and pres -ence of comorbidities, controlling for sex, age, and level of education. hese demographic characteristics were included in the models because they were independently and signii -cantly associated with the presence of CP. For all tests, a p value < 0.05 was considered statistically signiicant. We used a stepwise forward procedure and the Wald test.
he values left blank were treated as system-missing val -ues. Missing data were not treated in any special manner or for any statistical method, such as imputation.
Supplementary Statistical analyses
Weighting
Prevalence estimates and statistical analyses utilized weighted data. Two steps of weights were used. One step adjusted for diferent probabilities of selection among
respondents; and a second one was post-stratiication weights adjusting for imbalances, due to non-response and non-coverage bias, between the study sample and the popu -lation of São Paulo in re-lation to distribution by age, sex, and educational level. he educational level of respondents was determined by years of school completed.
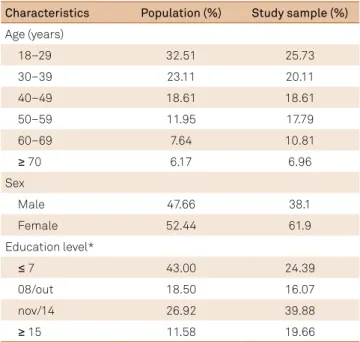
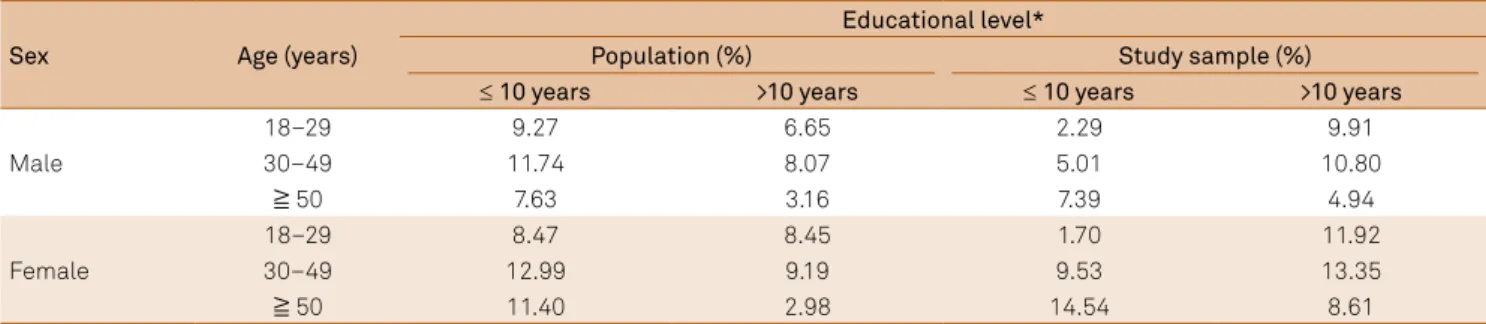
Data from each respondent were weighted by the num -ber of adults living in each household. After this step, the dis -tributions of the study sample and the São Paulo population were compared according to age, sex, and educational level. We analyzed data from the 2,000 Brazilian National Census carried out by the Brazilian Institute of Geography and Statistics (Table 1). he observed frequencies of individuals aged 40 years of age or more were higher in the sample than in the population of São Paulo, as well as the frequency of fe -males, and individuals with 11 or more years of school com -pleted. hus, in order to correct for these sample imbalanc -es, post-stratiication weights were adjusted. hese weights were obtained from the distribution of the sample within 12 strata, considering the population distribution according to age, sex, and educational level (Tables 2 and 3).
RESULTS
A total of 2,446 persons were interviewed to cover the forecast losses of 20% of adults living in household. here was a refusal rate of 12.4% (n = 418; 10.2% refused to sched -ule an interview and 2.2% refused to participate in the study after being informed of the aims and procedures of the re -search). he average interview lasted 7.7 minutes. he Figure
Table 1. Distribution of the study sample and the population of
São Paulo according to age, sex, and level of education.
Characteristics Population (%) Study sample (%)
Age (years)
18–29 32.51 25.73
30–39 23.11 20.11
40–49 18.61 18.61
50–59 11.95 17.79
60–69 7.64 10.81
� 70 6.17 6.96
Sex
Male 47.66 38.1
Female 52.44 61.9
Education level*
� 7 43.00 24.39
08/out 18.50 16.07
nov/14 26.92 39.88
� 15 11.58 19.66
summarizes the recruitment of subjects. he mean age was 39.8 years (range = 18–91). he majority was female (53.5%), had completed up to 10 years of education (57.3%), and was currently employed (59.8%). About one-third (33.4%) of the respondents were considered overweight and 12.7% were obese (Table 4).
Table 2. Distribution of the study sample and the population of São Paulo according to age, sex, and level of education.
Sex Age (years)
Educational level*
Population (%) Study sample (%)
≤ 10 years >10 years ≤ 10 years >10 years
Male
18–29 9.27 6.65 2.29 9.91
30–49 11.74 8.07 5.01 10.80
≧ 50 7.63 3.16 7.39 4.94
Female
18–29 8.47 8.45 1.70 11.92
30–49 12.99 9.19 9.53 13.35
≧ 50 11.40 2.98 14.54 8.61
*Educational level = years of school completed.
Table 3. Sample weights applied in the post-stratiication adjustment.
Sex Age (years) Educational level*
≤ 10 years >10 years
Male
18–29 4.05 0.67
30–49 2.34 0.75
≧ 50 1.03 0.64
Female
18–29 4.99 0.71
30–49 1.36 0.69
≧ 50 0.78 0.35
*Educational level = years of school completed.
Figure. Study inclusion low diagram.
Total household landline telephone numbers called (n = 5,686) Enrollment
NOT ASSESSED FOR ELIGIBILITY (n = 2,312) • Commercial telephone number (n = 539) • Out of service (n = 48)
• Fax (n = 25)
• Answer machine (n = 50) • Number did not exist (n = 1,650)
Assessed for eligibility (n = 3,374)
EXCLUDED (n = 928)
• Not meeting inclusion criteria (n = 0) • Declined to participate (n = 418) • Unable to find the selected person in the household, after 10 attempts (n = 510)
DATA AVAILABLE FOR ANALYSIS (n = 2,446)
Analysis
Prevalence of chronic pain
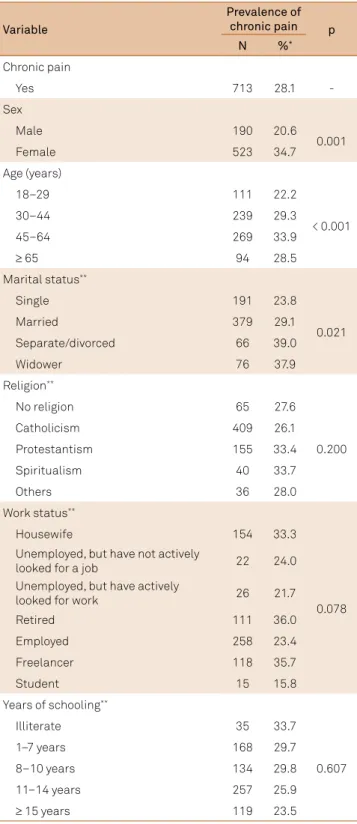
he prevalence of CP was higher in women than in men (34.7% vs. 20.6%; p = 0.001) and in the 45–64 year age group (33.9%), followed by the 30–44 year age group (p < 0.001). Pain had a tendency to be more prevalent with increasing age (p < 0.001) and with fewer years of schooling (p < 0.001). Separated/divorced (39.0%) and widowed individuals (37.9%) reported CP more frequently than single and married responders (p = 0.021).
We observed a higher prevalence of CP among obese and overweight individuals, but this association was not sta -tistically signiicant. here was no signiicant association
between CP and work status (p = 0.78) or between CP and religion (p = 0.20).
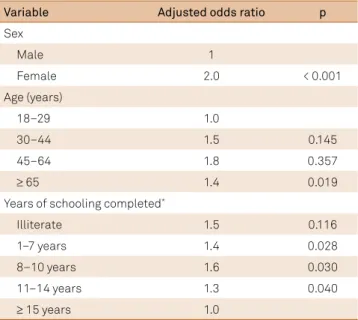
he multiple logistic regression analyses conirmed the association between CP and sex, age, and level of educa -tion (Table 6). Female gender (OR = 2.0; p < 0.001), age high -er than 65 years compared with the 18–29 year age group
Table 4. Sociodemographic characteristics of respondents
adjusted to the structure of the Brazilian general population.
Variable
Respondents
N %
(weighted) Sex
Male 927 46.5
Female 1505 53.5
Missing 14
-Age (years)
18–29 536 32.8
30–44 797 32.0
45–64 759 26.4
≥ 65 340 8.8
Missing 14
-Work status
Housewife 451 17.5
Unemployed, but have not actively looked
for a job 74 4.0
Unemployed, but have actively looked
for work 94 5.3
Retired 347 9.9
Employed 1026 43.1
Freelance 338 16.7
Student 69 3.5
Missing 47
-Nutritional status
Underweight 56 2.3
Normal weight 1172 51.7
Overweight 756 33.4
Obese 304 12.7
Missing 158
-Years of schooling
Illiterate 97 4.1
1–7 years 510 26.9
8–10 years 406 30.4
11–14 years 930 26.0
≥ 15 years 489 12.5
Missing 14
-Table 5. Prevalence of chronic pain according to
sociodemographic characteristics.
Variable
Prevalence of
chronic pain p
N %*
Chronic pain
Yes 713 28.1
-Sex
Male 190 20.6
0.001
Female 523 34.7
Age (years)
18–29 111 22.2
< 0.001
30–44 239 29.3
45–64 269 33.9
≥ 65 94 28.5
Marital status**
Single 191 23.8
0.021
Married 379 29.1
Separate/divorced 66 39.0
Widower 76 37.9
Religion**
No religion 65 27.6
0.200
Catholicism 409 26.1
Protestantism 155 33.4
Spiritualism 40 33.7
Others 36 28.0
Work status**
Housewife 154 33.3
0.078 Unemployed, but have not actively
looked for a job 22 24.0
Unemployed, but have actively
looked for work 26 21.7
Retired 111 36.0
Employed 258 23.4
Freelancer 118 35.7
Student 15 15.8
Years of schooling**
Illiterate 35 33.7
0.607
1–7 years 168 29.7
8–10 years 134 29.8
11–14 years 257 25.9
≥ 15 years 119 23.5
*Prevalence of pain corrected a posteriori for the design effect; **Participants
(OR = 1.4; p = 0.019), and fewer years of education (< 15 years) were associated with higher odds of having CP (OR = 1.3–1.6; p < 0.04) (Table 7). he greatest chance of having CP was observed among respondents reporting concomitant mus -cular complaints (adjusted OR = 6.4; p = 0.016), ibromyal -gia (adjusted OR = 4.7; p = 0.031), spinal disorders (adjusted OR = 3.8; p < 0.001), heart diseases lasting one year or less (adjusted OR = 3.7; p = 0.007), arthritis (adjusted OR = 3.5; p < 0.001), rheumatism (adjusted OR = 3.4; p = 0.007), depres -sion (adjusted OR = 3.3; p = 0.003), and anxiety/psychiatric disorders (adjusted OR = 3.3; p = 0.0001).
Pain characteristics and treatment
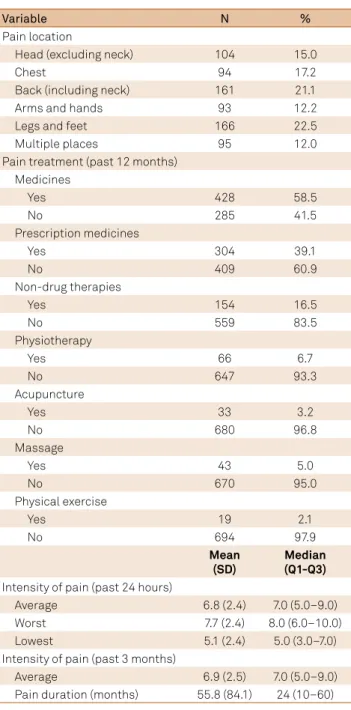
The mean intensity of the average pain in the past 24 hours was 6.8 (SD = 2.4) (Table 8). The most frequent body location of pain was legs and feet (22.5%), followed by the back and the neck (21.1%), and chest (17.2%). The duration of pain was often prolonged (55.8 ± 84.1 months). Only 25% of the respondents had suffered from CP for less than one year.
The interviewers asked respondents whether their pain was being treated in any way in the past 12 months. Most respondents (58.5%) had taken medications for their pain in the last 12 months, but only 16% of respondents had used non-pharmacological methods, remedies or therapies for pain.
DISCUSSION
It is still unknown whether pain is more prevalent in countries with a low HDI, and this is mainly due to the lack of studies assessing CP exclusively in this populations11,12.
Table 6. Factors associated with the presence of chronic pain
among the São Paulo general population: multivariate model.
Variable Adjusted odds ratio p
Sex
Male 1
Female 2.0 < 0.001
Age (years)
18–29 1.0
30–44 1.5 0.145
45–64 1.8 0.357
≥ 65 1.4 0.019
Years of schooling completed*
Illiterate 1.5 0.116
1–7 years 1.4 0.028
8–10 years 1.6 0.030
11–14 years 1.3 0.040
≥ 15 years 1.0
*Participants who did not answer the questions were excluded.
Table 7. Association between reported presence of medically diagnosed co-morbidities or medical conditions and the prevalence
of chronic pain among the São Paulo general population.
Variable
Survey respondents Prevalence of chronic pain*
(%)
OR p Adjusted OR** p
N %***
Spinal diseases 541 18.8 53.7 4.0 < 0.001 3.8 < 0.001
Headaches/migraine 484 20.4 44.7 2.6 < 0.001 2.3 < 0.001
Anxiety/other psychiatric disorder 340 13.0 53.9 3.7 < 0.001 3.3 0.001
Depression 245 8.9 56.9 3.9 0.001 3.3 0.003
Diabetes 202 6.7 46.0 2.3 0.001 1.8 0.008
Arthritis 153 4.5 61.7 4.4 < 0.001 3.5 < 0.001
Rheumatism 128 4.6 61.7 4.5 0.001 3.4 0.007
Surgery (< 1 year before) 178 7.2 42.6 2.0 0.046 1.9 0.094
Osteoporosis 78 2.3 56.4 3.4 0.001 2.6 0.005
Fracture (< 1 year before) 71 2.6 45.5 2.2 0.107 2.1 0.153
Fibromyalgia 71 2.2 68.5 5.8 0.010 4.7 0.031
Heart diseases (< 1 year before) 69 2.9 59.7 4.0 0.007 3.7 0.007
Endometriosis 40 1.4**** 46.0 1.6 0.170 1.6 0.278
Work-related musculoskeletal disease 52 1.5 49.5 2.5 0.021 2.2 0.022
Traumatic injury (< 1 year before) 48 1.7 45.2 2.1 0.049 2.5 0.026
Cancer 32 1.0 42.7 1.9 0.119 1.7 0.210
Muscular disorder 22 0.9 72.5 6.9 0.003 6.4 0.016
Sequelae of stroke 18 0.9 63.4 4.5 0.094 4.9 0.129
One could expect a higher prevalence of CP in low-HDI populations since HDI is deined by three dimensions (i.e., longevity, mean years of schooling and income) and two of these dimensions are known to be associated with CP (years of schooling and income)22,23. Also, the prevalence of some
diseases associated with CP — such as HIV/AIDS24 and
leprosy — is higher in developing countries, which have a signiicant proportion of cases located in the sub-Saharan Africa24. In the present study, the observed prevalence of
CP, deined as daily pain lasting for three months or longer, was 28.1%. his was similar to previous studies that used the same CP deinition and were conducted in other countries such as Spain (23.4%)9, Finland (35.1%)25, France (31.7%)10,
and the USA (26.0%)26. Some studies used the World Health
Organization’s six-month deinition of CP, while most studies
employed the International Association for the Study of Pain’s three-month cut-of1,6. However, in some instances, CP was
deined as the presence of “painful symptoms lasting longer than 45 days”5 and in others, CP was deined as any pain last
-ing more than three months in the individual’s life, given that it was also present in at least one episode in the preceding 30 days12. For instance, Cabral et al.12 found a 42% prevalence of
CP using this latter deinition in a sample of individuals liv -ing in a neighborhood of São Paulo, while persistent pain, de -ined as pain present in 50% of the days in the preceding three months, was reported to occur in only 28.5% of this sample.
he prevalence of CP and its associated characteris -tics in the general population of developing countries has been rarely assessed, with varying deinitions and sample sizes11,12. he present study provided information regarding
sex, age, level of education, and a high response rate to the telephone interviews was obtained, reaching a total of 2,446 participants. he minimum sample size recommended for population-based surveys has been reported to be 2,000 indi -viduals per city2,27, and this is the largest study available so far
in low HDI individuals11,12.
In the city of São Paulo, the landline telephone coverage is approximately 76% and can be considered adequate for stud -ies such as this. Nevertheless, to reduce the bias due to sam -ple and population distribution diferences, the data under -went post-stratiication weighting. he study design weights were adjusted to the distribution of age, sex, and level of edu -cation of the São Paulo’s population. his procedure ensures the sample representativeness and internal validity and has rarely been employed previously.
he majority of the factors associated with CP observed in the present study were similar to results reported in oth -er studies in developed countries. Women reported CP more frequently than men (34.7% vs. 20.6%). In European coun -tries and Canada the diference between men and women varied from 16.9% to 56% for women, and from 11% to 28% for men9,13,14,15,22. Although epidemiologic studies clearly dem
-onstrated that women have a higher pain prevalence than men, animal and human experimental pain studies are not strongly consistent. According to some recent reviews, wom -en have greater pain s-ensitivity (lower levels of threshold and tolerance), activate speciic brain regions in response to pain stimuli, and inhibit pain less than men (diference in endog -enous pain modulation). In addition, psychosocial factors and gonadal hormones, mainly estradiol, have been shown to increase the risk of pain occurrence. he prevalence of CP increases progressively with age. his association was ob -served previously9,13,14,22,28. In one study, the prevalence was
higher among people aged 67 years or more than among the 16–24 year age group22. In the present study, the CP preva
-lence was higher in the 45–64 year age group than in oth -er groups reporting CP. his high-er prevalence of CP among middle-age adults was also observed in Israel and France10,19.
Table 8. Clinical characteristics of chronic pain and its treatment.
Variable N %
Pain location
Head (excluding neck) 104 15.0
Chest 94 17.2
Back (including neck) 161 21.1
Arms and hands 93 12.2
Legs and feet 166 22.5
Multiple places 95 12.0
Pain treatment (past 12 months) Medicines
Yes 428 58.5
No 285 41.5
Prescription medicines
Yes 304 39.1
No 409 60.9
Non-drug therapies
Yes 154 16.5
No 559 83.5
Physiotherapy
Yes 66 6.7
No 647 93.3
Acupuncture
Yes 33 3.2
No 680 96.8
Massage
Yes 43 5.0
No 670 95.0
Physical exercise
Yes 19 2.1
No 694 97.9
Mean
(SD)
Median (Q1-Q3)
Intensity of pain (past 24 hours)
Average 6.8 (2.4) 7.0 (5.0–9.0)
Worst 7.7 (2.4) 8.0 (6.0–10.0)
Lowest 5.1 (2.4) 5.0 (3.0–7.0)
Intensity of pain (past 3 months)
Average 6.9 (2.5) 7.0 (5.0–9.0)
Regarding education, individuals with fewer years of schooling had a higher chance of having CP than those with higher levels of schooling, as reported previously13,19,22,28.
hese data suggested that independent of the country’s de -velopment level, people with lower educational levels pres -ent a higher risk for CP. he reasons for this are manyfold, and may relect diferent degrees of cognitive reserve29 and
cop-ing in more and less educated individuals. In fact, it has been suggested that patients with a better cognitive reserve may present with less CP after surgery30. However, cross-sectional
studies do not allow one to infer causal relationships between these associated factors. For example, since the duration of pain was relatively high in our sample, it cannot be ruled out that long-lasting CP negatively interfered with patients’ qual -ity of life and daily activities to a point where the number of years of education was also reduced because of the burden of CP. Regardless of sex, age, and educational level, CP was associated with co-morbidities. Respondents who reported muscular disorders, ibromyalgia, back and spine diseases, heart diseases in the last year, arthritis, rheumatism, depres -sion, and anxiety or any other psychiatric disorder were more than twice as likely to report CP.
here are some limitations to this study that should be considered. he irst limitation is the use of cross-sectional data, which limits our ability to draw conclusions about the direction of efects. Data collection was conducted through structured telephone interviews, which may have over -looked other potential contributors to CP risk in adults. Diferences in outcomes of interest according to meth -ods for collecting data may introduce bias to the study, so it is important to highlight that the prevalence of CP
in the general population should be followed up through -out the year because pain proiles may change over time. Diferences in health measurements between telephone and face-to-face interviews may cause some researchers to question the suitability of telephone surveys. Concerning the external validity of the study, São Paulo has the largest population in Brazil, and about 10% of the general Brazilian population lives in its metropolitan area. In fact, compared to Brazilian data, São Paulo has a similar life expectancy (77 years, compared to 73 in Brazil), lower than 0.9 HDI (0.80, compared to 0.744 in Brazil), men:women ratio (0.89, com -pared to 0.95 in Brazil), percentage of the population in poverty (28.1%, compared to 31.7% in Brazil), and illiteracy (10.8% compared to 9.6% in Brazil)16,17,18,31.
In conclusion, the prevalence of CP was high in the city of São Paulo and similar to the prevalence observed in developed countries. he highest prevalence was found in women, in the 34–64 year age group, in respondents reporting low educational level (< 15 years) and several co-morbidities. he present study provides evidence on the high prevalence and burden of CP in a developing country population and should be used to support treatment and prevention policies in this population.
Acknowledgements
Data collection was supported by Janssen-Cilag Brazil. he authors had full access to the data, and performed all the analyses and wrote the manuscript. No third party company was employed.
References
1. International Association for the Study of Pain. Classiication of chronic pain. Seatle: IASP Press; 1986.
2. Breivik H, Collett B, Ventafridda V, Cohen R, Gallacher D. Survey of chronic pain in Europe: prevalence, impact on daily life, and treatment. Eur J Pain. 2006;10(4):287-333. doi:10.1016/j.ejpain.2005.06.009
3. Bowsher D, Rigge M, Sopp LP. Prevalence of chronic pain in the British population: a telephone survey of 1037 households. Pain Clin. 1991;4:223-30.
4. Andersson HI, Ejlertsson G, Leden I, Rosenberg C, Centre BH, Bromölla. Chronic pain in a geographically deined general population: studies of differences in age, gender, social class, and pain localization. Clin J Pain. 1993;9(3):174-82. doi:10.1097/00002508-199309000-00004
5. Silva VRL, Menezes AMB, Noal RB. [Chronic joint symptoms in adults from Pelotas, Rio Grande do Sul State, Brazil: prevalence and determinants]. Cad Saúde Pública. 2009;25(12):2571-582. Portuguese. doi:10.1590/S0102-311X2009001200005
6. Elzahaf RA, Tashani OA, Unsworth BA, Johnson MI. The prevalence of chronic pain with an analysis of countries with a Human Development Index less than 0.9: a systematic review without meta-analysis. Curr Med Res Opin. 2012;28(7):1221-9. doi:10.1185/03007995.2012.703132
7. Tsang A, Von Korff M, Lee S, Alonso J, Karam E, Angermeyer MC et al. Common chronic pain conditions in developed and developing countries: gender and age differences and comorbidity with depression-anxiety disorders. J Pain. 2008;9(10):883-91. doi:10.1016/j.jpain.2008.05.005
8. Gureje O, Von Korff M, Simon GE, Gater R. Persistent pain and well-being: a World Health Organization study in primary care. JAMA. 1998;280(2):147-51. doi:10.1001/jama.280.2.147
9. Català E, Reig E, Artés M, Aliaga L, López JS, Segú JL. Prevalence of pain in the Spanish population: telephone survey in 5000 homes. Eur J Pain. 2002;6(2):133-40. doi:10.1053/eujp.2001.0310
10. Bouhassira D, Lantéri-Minet M, Attal N, Laurent B, Touboul C. Prevalence of chronic pain with neuropathic characteristics in the general population. Pain. 2008;136(3): 380-87. doi:10.1016/j.pain.2007.08.013
11. Sá KN, Baptista AF, Matos MA, Lessa I. Chronic pain and gender in Salvador population, Brazil. Pain. 2008;139(3): 498-506. doi:10.1016/j.pain.2008.06.008
13. Blyth FM, March LM, Brnabic AJ, Jorm LR, Williamson M, Cousins MJ. Chronic pain in Australia: a prevalence study. Pain. 2001;89(2-3):127-34. doi:10.1016/S0304-3959(00)00355-9
14. Smith BH, Elliott AM, Chambers WA, Smith WC, Hannaford PC, Penny K. The impact of chronic pain in the community. Fam Pract. 2001;18(3):292-9. doi:10.1093/fampra/18.3.292
15. Meana M, Cho R, DesMeules M. Chronic pain: the extra burden on Canadian women. BMC Womens Health. 2004;4, Suppl 1:S17. doi:10.1186/1472-6874-4-S1-S17
16. Instituto Brasileiro de Geograia e Estatística – IBGE. Censo demográico 2000. Rio de Janeiro: Instituto Brasileiro de Geograia e Estatística; 2013 [cited 2003 jun]. Available from: http://www.ibge. gov.br/home/estatistica/populacao/censo2000/
17. Instituto Brasileiro de Geograia e Estatística – IBGE. Pesquisa mensal de emprego. Rio de Janeiro: Instituto Brasileiro de Geograia e Estatística; 2015 [cited nov 2015]. Available: http://www.ibge.gov. br/home/estatistica/indicadores/trabalhoerendimento/pme_nova/ pme_201507tm_01.shtm
18. Instituto de Pesquisa Econômica Aplicada – IPEA.IPEA data. [cited 2015 dec]. Available from: http://www.ipeadata.gov.br
19. Neville A, Peleg R, Singer Y, Sherf M, Shvartzman P. Chronic pain: a population- based study. Isr Med Assoc J. 2008;10(10):676-80.
20. Moreira Junior ED, Souza MC. Epidemiologia da dor crônica: desenvolvimento de questionário para inquéritos populacionais. Rev Bras Med. 2003; 60(8):610-5.
21. Ferreira KA, Teixeira MJ, Mendonza TR, Cleeland CS. Validation of brief pain inventory to Brazilian patients with pain. Support Care Cancer. 2011;19(4):505-11. doi:10.1007/s00520-010-0844-7
22. Eriksen J, Jensen MK, Sjøgren P, Ekholm O, Rasmussen NK. Epidemiology of chronic non-malignant pain in Denmark. Pain. 2003;106(3):221-8. doi:10.1016/S0304-3959(03)00225-2
23. Vieira EBM, Garcia JB, Silva AA, Araújo RLM, Jansen RC. Prevalence, characteristics, and factors associated with chronic pain with and without neuropathic
characteristics in São Luız, Brazil. J Pain Symptom Manage. 2012;44(2):239-51. doi:10.1016/j.jpainsymman.2011.08.014
24. Asamoah-Odei E, Garcia Calleja JM, Boerma JT. HIV prevalence and trends in sub-Saharan: no decline and large subregional differences. Lancet. 2004;364(9428):35-40. doi:10.1016/S0140-6736(04)16587-2
25. Mäntyselkä PT, Turunen JH, Ahonen RS, Kumpusalo EA. Chronic pain and poor self-rated health. JAMA. 2003;290(18):2435-42. doi:10.1001/jama.290.18.2435
26. Toblin RL, Mack KA, Perveen G, Paulozzi LJ. A population-based survey of chronic pain and its treatment with prescription drugs. Pain. 2011;152(6):1249-55. doi:10.1016/j.pain.2010.12.036
27. Monteiro CA, Moura EC, Jaime PC, Lucca A, Florindo AA, Figueiredo IC et al. Surveillance of risk factors for chronic diseases through telephone interviews. Rev Saude Publica. 2005;39(1):47-57. doi:10.1590/S0034-89102005000100007
28. Schmidt CO, Raspe H, Pfingsten M, Hasenbring M, Basler HD, Eich W et al. Back pain in the German adult population: prevalence, severity, and sociodemographic correlates in a multiregional survey. Spine. 2007;32(18):2005-11. doi:10.1097/BRS.0b013e318133fad8
29. Farfel JM, Nitrini R, Suemoto CK, Grinberg LT, Ferretti RE, Leite RE et al. Very low levels of education and cognitive reserve: a clinicopathologic study. Neurology. 2013;81(7):650-7. doi:10.1212/WNL.0b013e3182a08f1b
30. Attal N, Masselin-Dubois A, Martinez V, Jayr C, Albi A, Fermanian J et al. Does cognitive functioning predict chronic pain? Results from a prospective surgical cohort. Brain. 2014;137(3):904-17. doi:10.1093/brain/awt354