ORIGINAL ARTICLE
DOI: 10.1590/1516-3180.2013.1313474SAPS 3, APACHE IV or GRACE: which score to choose for
acute coronary syndrome patients in intensive care units?
SAPS 3, APACHE IV ou GRACE: qual escore escolher para pacientes
com síndromes coronarianas agudas na unidade de terapia intensiva?
Antonio Paulo Nassar Junior
I, Amilcar Oshiro Mocelin
II, Fabio Moreira Andrade
I, Leonardo Brauer
II, Fabio Poianas Giannini
II,
Andre Luiz Baptiston Nunes
II, Carlos Augusto Dias
IIIIntensive Care Unit, Hospital São Camilo, São Paulo, Brazil
ABSTRACT
CONTEXT AND OBJECTIVE: Acute coronary syndromes (ACS) are a common cause of intensive care unit (ICU) admission. Speciic prognostic scores have been developed and validated for ACS patients and, among them, GRACE (Global Registry of Acute Coronary Events) has had the best performance. However, intensive care clinicians generally use prognostic scores developed from heterogeneous populations of critically ill patients, such as APACHE IV (Acute Physiologic and Chronic Health Evaluation IV) and SAPS 3 (Simpliied Acute Physiology Score 3). The aim of this study was to evaluate and compare the performance of these three scores in a non-selected population of ACS cases.
DESIGN AND SETTING: Retrospective observational study to evaluate three prognostic scores in a popula-tion of ACS patients admitted to three general ICUs in private hospitals in São Paulo.
METHODS: All patients with ACS admitted from July 2008 to December 2009 were considered for inclusion in the study. Score calibration and discrimination were evaluated in relation to predicting hospital mortality.
RESULTS: A total of 1065 patients were included. The calibration was appropriate for APACHE IV and GRACE but not for SAPS 3. The discrimination was very good for all scores (area under curve of 0.862 for GRACE, 0.860 for APACHE IV and 0.804 for SAPS 3).
CONCLUSIONS: In this population of ACS patients admitted to ICUs, GRACE and APACHE IV were ad-equately calibrated, but SAPS 3 was not. All three scores had very good discrimination. GRACE and APACHE IV may be used for predicting mortality risk among ACS patients.
RESUMO
CONTEXTO E OBJETIVO: Síndromes coronarianas agudas (SCA) são causa comum de admissão à unidade de terapia intensiva (UTI). Escores prognósticos especíicos foram desenvolvidos e validados para pacien-tes com SCA e, dentre esses, o GRACE (Registro Global de Eventos Coronarianos Agudos) tem tido a me-lhor performance. No entanto, os intensivistas normalmente usam escores desenvolvidos para populações heterogêneas de pacientes graves, como o APACHE IV (Avaliação de Saúde Crônica e Fisiologia Aguda IV) e o SAPS 3 (Escore Fisiológico Agudo Simpliicado 3). O presente estudo objetiva avaliar e comparar a performance desses três escores em uma população não selecionada admitida com diagnóstico de SCA.
TIPO DE ESTUDO E LOCAL: Estudo retrospectivo observacional para a avaliação de três escores prognós-ticos em uma população admitida com SCA em três UTIs gerais de hospitais particulares em São Paulo.
MÉTODOS: Todos os pacientes admitidos com SCA de julho de 2008 a dezembro de 2009 foram avaliados para inclusão no estudo. Foram avaliadas a calibração e a discriminação dos escores em predizer a mor-talidade hospitalar.
RESULTADOS: Um total de 1.065 pacientes foi incluído. A calibração foi adequada para o APACHE IV e para o GRACE, mas não para o SAPS 3. A discriminação foi muito boa para todos os escores (área sob a curva de 0,862; 0,860 e 0,804 para GRACE, APACHE IV e SAPS 3).
CONCLUSÕES: Nesta população de pacientes com SCA admitidos à UTI, os escores GRACE e APACHE IV apresentaram uma calibração adequada, mas o SAPS 3 não. Todos os escores tiveram uma discriminação muito boa. O GRACE e o APACHE IV podem ser usados para predição de mortalidade em pacientes com SCA.
IMD. Attending Physician, Intensive Care Unit,
Hospital São Camilo, São Paulo, Brazil.
IIMD. Local Medical Coordinator, Intensive Care
Unit, Hospital São Camilo, São Paulo, Brazil.
IIIMD. General Medical Coordinator, Intensive
Care Unit, Hospital São Camilo, São Paulo. Brazil.
KEY WORDS:
Acute coronary syndrome. Intensive care units. Prognosis. APACHE. Hospital mortality.
PALAVRAS-CHAVE:
Síndrome coronariana aguda. Unidades de terapia intensiva. Prognóstico.
APACHE.
INTRODUCTION
Acute coronary syndromes (ACS) are a common reason for intensive care unit (ICU) admission.1,2 However, their clinical presentation varies and, therefore, risk stratiication is funda-mental in order to guide diagnostic and therapeutic approaches. Many speciic prognostic scores have been developed and validated for ACS patients. Among them, the Global Registry of Acute Coronary Events (GRACE)3 has had the best performance, probably due to its simple design, given that it does not diferen-tiate between patients with and without ST-elevation ACS, and because it was developed from a large cohort of ACS patients who had not taken part in a clinical trial.
However, intensive care physicians usually use “general” prognostic scores developed from heterogeneous populations of critically ill patients, such as the Acute Physiologic and Chronic Health Evaluation (APACHE)4 and Simpliied Acute Physiology Score (SAPS).5 Although the most-used early versions of these scores, APACHE II6 and SAPS II,7 did not include ACS patients during their development, their recent versions (APACHE IV8 and SAPS 39) did so, and may, theoretically, be used for ACS patients’ risk stratiication in general ICUs.
However, before prognostic scores can be widely adopted, they need to be validated, i.e. their performance must be eval-uated in a population diferent from the one on which their development was based.10 his validation is accomplished by evaluating the calibration and discrimination of the models. Calibration assesses the degree of correspondence between the estimated probability of hospital mortality and the mortality actually observed for the range of probabilities. he calibration of prognostic scores is usually evaluated by assessing the correla-tion between predicted and observed mortalities in groups (for example, deciles) of predicted risk. Discrimination assesses the ability of a model to distinguish patients who died from those who survived.11
OBJECTIVE
his study aimed to evaluate and compare the performance of one “speciic” ACS prognostic score (GRACE) and two “general” ICU prognostic scores (APACHE IV and SAPS 3) in a Brazilian population of ACS patients admitted to general ICUs.
METHODS
Study design and setting
his retrospective cohort study was conducted using data gath-ered between July 1, 2008, and December 31, 2009, in three Brazilian ICUs. All of these ICUs are medical-surgical and stafed with full-time intensive care specialists, nurses and physiothera-pists. During the study period, two ICUs had 31 beds and one had 24. None of them had an explicit ICU admission policy, i.e.
patients could come from the emergency department, the oper-ating room, the wards or the catheterization laboratory, or be transferred from other hospitals, at the discretion of the attend-ing physician. Decisions to discharge ACS patients were made by the intensive care specialist and the cardiologist in charge of the patient. During the study period, none of the hospitals had intermediate or coronary care units, and all the patients were discharged to the wards. All three hospitals have speciic chest pain protocols in their emergency rooms and catheter-ization laboratories that are available 24/7. All patients admit-ted with ST-elevation myocardial infarction are treaadmit-ted with pri-mary angioplasty. Patients admitted with unstable angina and non-ST elevation myocardial infarction are admitted to the ICU and monitored with a continuous electrocardiogram, non-inva-sive arterial pressure gauge and pulse oximetry. When non-ST elevation ACS patients have refractory chest pain (i.e. pain that does not respond to nitroglycerin, morphine or beta-blocker), acute pulmonary edema or cardiogenic shock, they are imme-diately transported to the catheterization laboratory as a matter of urgency, ater the cardiologist in charge has been contacted. Non-ST elevation ACS patients who remain stable are strati-ied based on the cardiologist’s decision on the irst day ater their admission to the ICU. Patients with troponin elevation or dynamic electrocardiographic alterations are usually invasively stratiied on the day that follows their admission. All other non-ST elevation ACS patients are non-invasively stratiied with stress echocardiography.
Selection of participants
All consecutively admitted ACS patients aged ≥ 18 years in the study period in the three hospitals were included. ACS were deined as typical chest pain with or without electrocardio-graphic alterations (ST-elevation or depression, T-wave inversion or new let bundle-branch), and with or without troponin eleva-tion. Acute myocardial infarction (AMI) was deined as ACS typ-ical symptom and troponin elevation. Patients who were read-mitted during the same hospital stay or who were transferred to another hospital (during their ICU stay or ater ICU discharge if still hospitalized) were excluded. he study was approved by the local Ethics Committees and the need for informed consent was waived since no intervention was required and no individual data were expected to be disclosed.
Data gathering
SAPS 3, APACHE IV or GRACE: which score to choose for acute coronary syndrome patients in intensive care units? | ORIGINAL ARTICLE
from another hospital) and diagnosis (unstable angina, non-ST elevation ACS or ST elevation ACS). Patients admitted from the catheterization laboratory ater primary angioplasty were con-sidered to have originated from the emergency room. Since the SAPS 3 and GRACE variables were collected within the irst hour ater admission, they were entered on the form by the intensive care specialist who admitted the patient. APACHE IV diagnos-tic data were gathered upon admission. Other APACHE IV vari-ables were gathered within 24 hours of admission, from the med-ical records, by a nursing student trained in severity scores or by the local ICU medical coordinator. None of the physicians who inserted data in the forms were involved in the data analysis. All the data were entered into a Microsot Excel® spreadsheet, which was used to estimate in-hospital mortality risks. For SAPS 3, the global equation was utilized.
Statistical analysis
Statistical analyses were performed using the Statistical Package for the Social Sciences (SPSS), version 10.0, and MedCalc ver-sion 9.0 sotwares. Continuous variables were presented as the median and interquartile range (IQR). Categorical variables were presented as absolute values and percentages.
he prognostic performance of the diferent scores was eval-uated in terms of calibration and discrimination. he calibration was assessed using the Hosmer-Lemeshow goodness-of-it test C-statistic, which evaluates the agreement between the observed and expected numbers of survivors and non-survivors across all of the strata of probabilities of death.13 A high Pvalue (P > 0.05) indicates a good it for the model. Standardized mortality ratios (SMRs) with their respective 95% conidence intervals (CI) were calculated by dividing observed by predicted rates.
he score discrimination was assessed by calculating the area under the receiver operating characteristic curve (AUROC) and its 95% CI. he discrimination was considered to be excel-lent, very good, good, moderate and poor with AUROC values of 0.9-0.99, 0.8-0.89, 0.7-0.79, 0.6-0.69 and < 0.6, respectively. Pairwise comparisons of the AUROCs were performed using the De-Long method.14
RESULTS
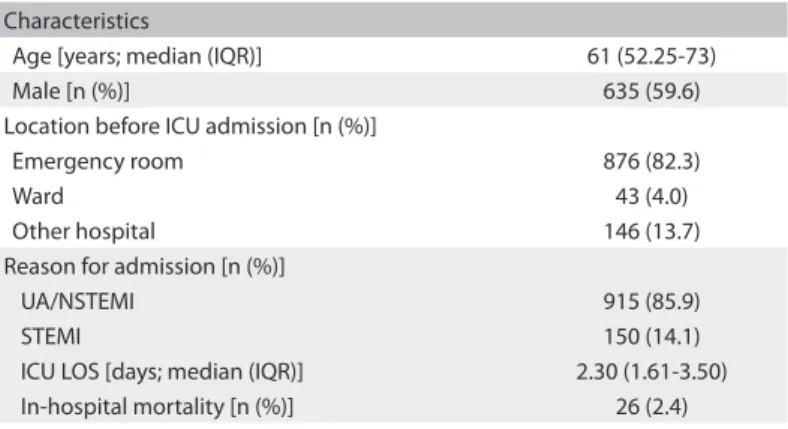
During the study period, 1229 patients were admitted with a diag-nosis of ACS. A total of 164 patients were excluded due to incom-plete data that prevented calculation of one or more scores (n = 93), readmission during the same hospital stay (n = 65) or trans-fer to another hospital (n = 6). he characteristics of the patients included are displayed in Table 1. In-hospital mortality was 2.4%.
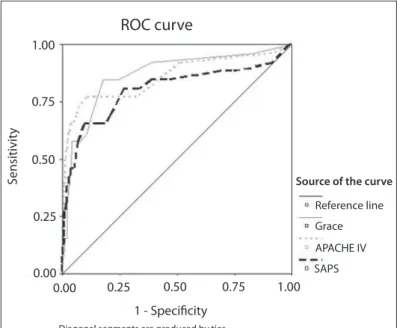
GRACE and APACHE IV presented appropriate calibration, but SAPS 3 did not. SAPS 3 overestimated in-hospital mortal-ity (Table 2). he discrimination was very good for all scores (Figure 1). he AUROC was 0.862 (95% CI: 0.840-0.883) for
GRACE; 0.860 (95% CI: 0.838-0.880) for APACHE IV; and 0.804 (95% CI: 0.779-0.828) for SAPS 3. here were no diferences in discrimination among the scores (GRACE versus APACHE IV, P = 0.955; GRACE versus SAPS 3, P = 0.282; APACHE IV versus SAPS 3, P = 0.135).
DISCUSSION
In this study, one “general” score (APACHE IV) and one “spe-ciic” ACS prognostic score (GRACE) showed appropriate cali-bration and very good discrimination among a non-selected ACS population admitted to ICUs. Another “general” score, SAPS 3, which included ACS patients in its development, also showed very good discrimination, but poor calibration, with overestima-tion of in-hospital mortality.
Interest in using prognostic scores originates from the fact that a very heterogeneous population of critically ill patients is admitted to ICUs. Because of this, stratiication of patients’ risk could theoretically enable better resource allocation and bet-ter comparison of ICU performance over certain periods and between diferent ICUs. ACS is a common reason for ICU admis-sion, and speciic scores have also been developed for ACS. hese scores have showed good accuracy with regard to ACS risk strati-ication,15-18 and risk stratiication is recommended in the ACS treatment guidelines in order to guide therapeutics.19 Among these scores, GRACE seems to have the best performance.15-18 his was developed in a large cohort of ACS patients from many countries who had not taken part in clinical trials. Moreover, it included a few variables that are usually measured upon ACS patients’ admission.3 herefore, GRACE seems to be an appropri-ate prognostic score for risk stratiication in the “real world”, and this is the reason why it was the one chosen for the present study. On the other hand, because of the variability of conditions responsible for ICU admissions, healthcare workers have used “general” prognostic scores developed in very heterogeneous
Characteristics
Age [years; median (IQR)] 61 (52.25-73) Male [n (%)] 635 (59.6) Location before ICU admission [n (%)]
Emergency room 876 (82.3)
Ward 43 (4.0)
Other hospital 146 (13.7) Reason for admission [n (%)]
UA/NSTEMI 915 (85.9)
STEMI 150 (14.1)
ICU LOS [days; median (IQR)] 2.30 (1.61-3.50) In-hospital mortality [n (%)] 26 (2.4)
IQR = interquartile range; ICU = intensive care unit; UA = unstable angina; NSTEMI = non–ST-segment elevation myocardial infarction; STEMI = ST-segment elevation myocardial infarction; LOS = length of stay.
populations of critically ill patients. Among these, APACHE and SAPS have been the scores most used in clinical practice and in research. However, except for APACHE III,20 the older versions of the scores were not developed in cohorts with ACS patients, although they were validated in this group of patients ater-wards.2,21,22 ACS patients were included in developing the newest versions (APACHE IV and SAPS 3), but these still have not been validated in an external ACS population.
To the best of our knowledge, only one previous study com-pared “general” and “speciic” prognostic scores for risk stratii-cation in AMI cases. hat study compared seven scores, among which the one most used in studies was APACHE II, and did not ind any substantial diferences in accuracy between most of them.23 A Spanish group has periodically evaluated “gen-eral” scores among ACS patients admitted to ICUs or coronary units. In an initial study, the group observed that APACHE III presented greater accuracy than SAPS II.2 Subsequently, a
comparison between APACHE II, SAPS II and MPM-II (mor-tality probability models) showed that all of these scores pre-sented appropriate calibration and good discrimination for AMI patients.22 Recently, the same group found that a prognos-tic model that included the Killip classiication and APACHE II showed good accuracy.24
Our study was the irst one to compare the performance of two recent general scores (APACHE IV and SAPS 3) and one speciic ACS score (GRACE). SAPS 3 demonstrated poor calibra-tion, which may have been due to inappropriateness for assess-ing an ACS population or to diferent clinical presentation and treatment choices in this speciic population.25,26 Nevertheless, some studies have already suggested that SAPS 3 underestimates in-hospital mortality among general critical care patients, which may be due to the model itself.27,28
On the other hand, APACHE IV and GRACE presented appropriate calibration and similar accuracy. Choosing between these scores depends on the aim. If the aim is to study ACS patients in ICUs or to evaluate health clinic performance in rela-tion to ACS cases, GRACE would be the best choice. GRACE is a simpler score that only includes seven variables: these are gath-ered on admission and have prognostic implications for ACS patients, such as electrocardiographic alterations, elevation of cardiac biomarkers and Killip classiication. If the purpose is to compare ACS patients against patients admitted with other diag-noses or to evaluate all patients admitted to the ICU, APACHE IV is a better option. However, completion of data input depends on data gathered within the irst 24h ater ICU admission, requires greater efort and precludes its use as a risk stratiication tool to guide initial therapy. Hence, we believe that choosing one score does not exclude the other, but using both could provide a broader overview of ACS patients.
Our study has potential limitations. First, although it was designed as a multicenter study, all three ICUs observed are located in the same city and provide similar standards of care. herefore, our cohort may not be representative of a larger population. Two points that provide examples of this limitation were the per-centage of non-ST elevation ACS patients, which was larger than in the original GRACE cohort,3 although similar to a Brazilian reg-istry,29 and the observation that all ST-elevation myocardial infarc-tion patients were treated with primary angioplasty, which is only
SCORE Predicted mortality SMR (95% CI) H-L statistic P value
GRACE 3.1% 0.77 (0.47-1.08) 11.0 0.25 APACHE IV 3.2% 0.77 (0.46-1.07) 12.5 0.27 SAPS 3 7.9% 0.31 (0.11-0.50) 51.8 < 0.001
Table 2. Performance of the scores
SMR = standardized mortality ratio; CI = conidence interval; H-L = Hosmer-Lemeshow statistic for goodness-of-it. GRACE = Global Registry of Acute Coronary Events; APACHE IV = Acute Physiologic and Chronic Health Evaluation IV; SAPS 3 = Simpliied Acute Physiology Score 3.
Figure 1. Receiver operating characteristic curves (ROC curves).
1 - Specificity Diagonal segments are produced by ties.
Reference line
Source of the curve
Grace
ROC curve
SAPS
Sensitivit
y
0.00 0.00 0.25
0.25 0.50
0.50 0.75
0.75 1.00
1.00
APACHE IV
SAPS 3, APACHE IV or GRACE: which score to choose for acute coronary syndrome patients in intensive care units? | ORIGINAL ARTICLE
routinely performed in reference centers.29 Second, we did not gather some data that could be important for prognostic infor-mation, such as the use of medications like aspirin, clopidogrel, beta-blockers and statins, because these data were not available in our database. hese data could give better insight regard-ing our patients’ proile and the healthcare that they received. However, since our sole objective was to evaluate the calibration and discrimination of three prognostic scores in a speciic pop-ulation, we believe that the absence of these data did not have any impact on our results.
CONCLUSIONS
Our study showed that APACHE IV and GRACE had appropriate calibration and very good discrimination in a non-selected pop-ulation of ACS cases admitted to general Brazilian ICUs. Even though SAPS 3 was developed based on a very large sample from diferent countries, it was not properly calibrated for this popula-tion, although its discrimination was similar to that of the other scores. We recommend that APACHE IV and GRACE should be chosen for mortality risk prediction for ACS patients admitted to healthcare facilities with proiles similar to ours.
REFERENCES
1. Lott JP, Iwashyna TJ, Christie JD, et al. Critical illness outcomes in
specialty versus general intensive care units. Am J Respir Crit Care
Med. 2009;179(8):676-83.
2. Reina A, Vázquez G, Aguayo E, et al. Mortality discrimination in acute
myocardial infarction: comparison between APACHE III and SAPS II
prognosis systems. PAEEC Group. Intensive Care Med. 1997;23(3):326-30.
3. Granger CB, Goldberg RJ, Dabbous O, et al. Predictors of hospital
mortality in the global registry of acute coronary events. Arch Intern
Med. 2003;163(19):2345-53.
4. Zimmerman JE, Kramer AA. Outcome prediction in critical care: the
Acute Physiology and Chronic Health Evaluation models. Curr Opin
Crit Care. 2008;14(5):491-7.
5. Capuzzo M, Moreno RP, Le Gall JR. Outcome prediction in critical care:
the Simpliied Acute Physiology Score models. Curr Opin Crit Care.
2008;14(5):485-90.
6. Knaus WA, Draper EA, Wagner DP, Zimmerman JE. APACHE II: a severity
of disease classiication system. Crit Care Med. 1985;13(10):818-29.
7. Le Gall JR, Lemeshow S, Saulnier F. A new Simpliied Acute Physiology
Score (SAPS II) based on a European/North American multicenter
study. JAMA. 1993;270(24):2957-63.
8. Zimmerman JE, Kramer AA, McNair DS, Malila FM. Acute Physiology
and Chronic Health Evaluation (APACHE) IV: hospital mortality
assessment for today’s critically ill patients. Crit Care Med.
2006;34(5):1297-310.
9. Moreno RP, Metnitz PG, Almeida E, et al. SAPS 3--From evaluation
of the patient to evaluation of the intensive care unit. Part 2:
Development of a prognostic model for hospital mortality at ICU
admission. Intensive Care Med. 2005;31(10):1345-55.
10. Altman DG, Vergouwe Y, Royston P, Moons KG. Prognosis and
prognostic research: validating a prognostic model. BMJ.
2009;338:b605.
11. Vincent JL, Moreno R. Clinical review: scoring systems in the critically
ill. Crit Care. 2010;14(2):207.
12. Metnitz PG, Moreno RP, Almeida E, et al. SAPS 3--From evaluation
of the patient to evaluation of the intensive care unit. Part 1:
Objectives, methods and cohort description. Intensive Care Med.
2005;31(10):1336-44.
13. Lemeshow S, Hosmer DW Jr. A review of goodness of it statistics
for use in the development of logistic regression models. Am J
Epidemiol. 1982;115(1):92-106.
14. DeLong ER, DeLong DM, Clarke-Pearson DL. Comparing the areas
under two or more correlated receiver operating characteristic
curves: a nonparametric approach. Biometrics. 1988;44(3):837-45.
15. Aragam KG, Tamhane UU, Kline-Rogers E, et al. Does simplicity
compromise accuracy in ACS risk prediction? A retrospective analysis
of the TIMI and GRACE risk scores. PLoS One. 2009;4(11):e7947.
16. Yan AT, Yan RT, Tan M, et al. Risk scores for risk stratiication in acute
coronary syndromes: useful but simpler is not necessarily better. Eur
Heart J. 2007;28(9):1072-8.
17. de Araújo Gonçalves P, Ferreira J, Aguiar C, Seabra-Gomes R.
TIMI, PURSUIT, and GRACE risk scores: sustained prognostic value
and interaction with revascularization in NSTE-ACS. Eur Heart J.
2005;26(9):865-72.
18. Correia LC, Freitas R, Bittencourt AP, et al. Valor prognóstico do
Escore de Risco GRACE versus Escore de Risco TIMI em síndromes
coronarianas agudas [Prognostic value of GRACE scores versus
TIMI score in acute coronary syndromes]. Arq Bras Cardiol.
2010;94(5): 613-9.
19. Sociedade Brasileira de Cardiologia. Diretrizes da Sociedade Brasileira
de Cardiologia sobre angina instável e infarto agudo do miocárdio
sem supradesnível do segmento ST (II edição, 2007) [Guidelines
of the Brazilian Society of Cardiology on unstable angina and
myocardial infarction without ST segment elevation (second edition,
2007)]. Arq Bras Cardiol. 2007;89(4 Suppl 1):e92-131.
20. Knaus WA, Wagner DP, Draper EA, et al. The APACHE III prognostic
system. Risk prediction of hospital mortality for critically ill
hospitalized adults. Chest. 1991;100(6):1619-36.
21. Teskey RJ, Calvin JE, McPhail I. Disease severity in the coronary care
unit. Chest. 1991;100(6):1637-42.
22. Sarmiento X, Rué M, Guardiola JJ, et al. Assessment of the prognosis
of coronary patients: performance and customization of generic
severity indexes. Chest. 1997;111(6):1666-71.
23. Alemi F, Rice J, Hankins R. Predicting in-hospital survival of myocardial
infarction. A comparative study of various severity measures. Med
24. Mercado-Martínez J, Rivera-Fernández R, Aguilar-Alonso E, et al.
APACHE-II score and Killip class for patients with acute myocardial
infarction. Intensive Care Med. 2010;36(9):1579-86.
25. Glance LG, Osler T, Shinozaki T. Efect of varying the case mix on
the standardized mortality ratio and W statistic: A simulation study.
Chest. 2000;117(4):1112-7.
26. Murphy-Filkins R, Teres D, Lemeshow S, Hosmer DW. Efect of
changing patient mix on the performance of an intensive care
unit severity-of-illness model: how to distinguish a general from a
specialty intensive care unit. Crit Care Med. 1996;24(12):1968-73.
27. Poole D, Rossi C, Anghileri A, et al. External validation of the
Simpliied Acute Physiology Score (SAPS) 3 in a cohort of 28,357
patients from 147 Italian intensive care units. Intensive Care Med.
2009;35(11):1916-24.
28. Metnitz B, Schaden E, Moreno R, et al. Austrian validation and
customization of the SAPS 3 Admission Score. Intensive Care Med.
2009;35(4):616-22.
29. dos Santos ES, Minuzzo L, Pereira MP, et al. Registro de síndrome
coronariana aguda em um centro de emergências em cardiologia
[Acute coronary syndrome registry at a cardiology emergency
center]. Arq Bras Cardiol. 2006;87(5):597-602.
Acknowledgements: We would like to thank Lia Delphino Salles for helping in data acquisition and Barbara Weninger for critically reviewing
the manuscript
This study was presented as an abstract at the 23rd Congress of the
European Society of Intensive Care Medicine, in Barcelona, Spain,
October 9-13, 2010
Sources of funding: None
Conlict of interest: None
Date of irst submission: February 18, 2012
Last received: August 21, 2012
Accepted: September 20, 2012
Address for correspondence:
Antonio Paulo Nassar Junior
Rua Tavares Bastos, 715
São Paulo (SP) — Brasil
CEP 05012-020