Applicability of the Simplified Acute
Physiology Score (SAPS 3) in Brazilian
Hospitals
João Manoel Silva Junior, TSA, M.D., Luiz M Sá Malbouisson, TSA, M.D., Hector L Nuevo, M.D., Luiz Gustavo T Barbosa, M.D., Lauro Marubayashi, M.D., Isabel Cristina Teixeira, Antonio Paulo Nassar Junior, M.D., Maria Jose Carvalho Carmona, TSA, M.D., Israel Ferreira da Silva, TSA, M.D., José Otávio Costa Auler Júnior, TSA, M.D., Ederlon Rezende, M.D.
INTRODUCTION
The number of surgical patients admitted to intensive care units (ICUs) has increased considerable over the last few years1. A study shows that more than 40 million surger-ies are performed every year in the USA and England, and some of them are moderate to high risk procedures. The mortality for high risk patients ranges from 9.7% in the USA to 35.9% in England. The surgical outcome of those pa-tients is influenced by the preoperative physiological status and adequate postoperative care2. Thus, data predictive of morbidity and mortality risks are fundamental for this group of patients3.
Therefore, the development, validation, and refinement of prognostic indexes in severely ill patients, such as the Acute Physiology and Chronic Health Evaluation (APACHE)4,5, Simplified Acute Physiology Score (SAPS)6,7, and Mortality Prediction Model (MPM)8,9 are important contributions for in-tensive care therapy. Prognostic indexes quantify acute and chronic physiologic disruption during admission, estimating the mortality to correct errors and improve the performance of the intensive care unit10.
The SAPS 3 prognostic system was recently developed in a worldwide cohort11,12. It is composed of 20 different pa-rameters easily measurable on admission of the patient to the ICU.
Those parameters, divided into three parts, demographic data, reasons for admission to the ICU, and physiologic parameters, represent the degree of disease disruption and assessment of the health status before hospital admission, indicating a pre-morbid condition.
Each parameter has a score according to the severity of the physiologic disruption. In theory, 16 is the lowest score possi-ble and 217 the highest. Physiologic parameters included are: temperature, systolic blood pressure, heart and respiratory rates, oxygenation, arterial pH, sodium, potassium, creatinine, bilirubin, hematocrit, leukocytes, platelets, and Glasgow coma scale (Annex I).
Several studies11,12 have validated this system, giving their creators important improvement of this prognostic index. In South America, the index was calibrated with a level of 1.3, i.e., the relationship between observed and predicted mor-talities is 1.3. Recently, Soares and Salluh13 validated the SAPS 3 in a Brazilian cohort of cancer patients, obtaining good results.
Although this prognostic index has been incorporated in several clinical assay protocols in the intensive care environment14,15, only one study16 was developed in surgical ICU patients in Europe, proving to be better than other indexes used before in this population.
Therefore, the objective of the present study was to evaluate the discriminatory power of the SAPS 3 system in a Brazilian population of surgical patients of two tertiary hospitals regard-ing hospital mortality.
METHODS
This study was undertaken in two intensive care units of two different tertiary Brazilian hospitals in São Paulo, with a total of 24 beds, coordinated primarily by a nurse and a physician. Residents care for patients under the supervision of attending physicians.
This study was approved by the Ethics on Research Commis-sion of both hospitals, and signed consent forms were deem unnecessary, since this is an observational study. Data were gathered by an especially trained nurse.
Consecutive patients admitted to the intensive care units from March 1, 2008 to March 1, 2009 were included in the study. Patients younger than 16 years, who stayed in the ICU for less than 24 hours, readmitted to the unit, and those admitted only for hemodialysis were excluded. Patients were followed-up until discharge from the hospital or death.
Data were collected in the first hour after admission to the ICU, using the worst parameter, except for the Glasgow coma scale (the best performance was used). Intubated patients re-ceived the best score on verbal response if they did not pres-ent neurological deficit; otherwise, they received a score of 1. Ocular and motor responses were evaluated according to the Glasgow coma scale.
Data were divided in: 1) demographic; 2) diagnostic; 3) pre-vious health status; and 4) physiologic parameters (systolic blood pressure, axillary temperature, heart rate, oxygen-ation, arterial pH, sodium, potassium, creatinine, total bili-rubin, hematocrit, leukocytes, platelets, and Glasgow coma scale). The SAPS 3 score was calculated according to those parameters and calibration proposed by the original study for South America11.
Oper-ating Characteristics) curve, calculOper-ating the respective area. The best discriminating value was determined by the maximal sensitivity and specificity. The higher value resulting from this product was the cutoff point.
95% Confidence intervals were computed for true and false positive rates and for the correct classification rate of the out-come. The Hosmer-Lemeshow goodness-of-fit C-statistic test was used to assess concordance between the observed and expected number of survivors and non-survivors in relation to the probability of death (calibration)17. In this analysis, p > 0.05 indicates good test adjustment. The standardized morbidity ratio (SMR) was calculated by dividing the observed by the predicted mortality rate.
Bicaudal statistical tests were used and the level of signifi-cance of 0.05 was used. The Chi-square test was used for categorical parameters. The SPSS 13.0 for Windows, Inc., Chicago, IL, USA, was used to analyze the data.
RESULTS
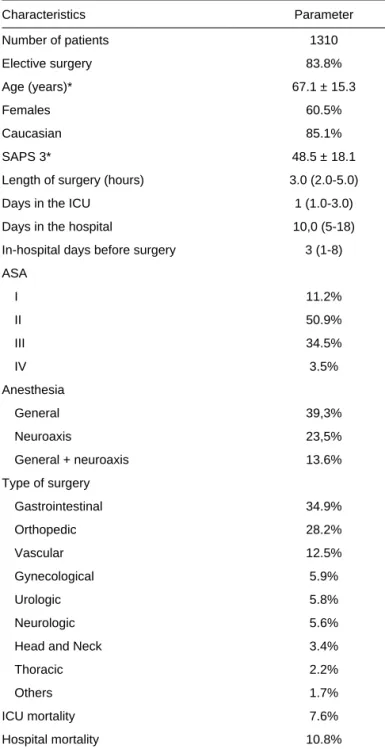
Out of 1,831 patients admitted during the study period, 1,310 were included and 521 were excluded from the study for several reasons (Table I). Mean patient age was 67.1 ± 15.3 years, and 60.5% were females. Gastrointestinal surger-ies predominated (34.9%), followed by orthopedic surgersurger-ies (28.2%). The lower SAPS 3 score was 18 and the higher was 154, with a mean of 48.5 ± 18.1 (Table II).
The observed mortality was 10.8% and predicted mortality was 10.3% (SMR = 1.04 95%CI 1.03 to 1.07). The SAPS 3 score of 57 showed better sensitivity (75%) and specificity (86%) for in hospital mortality, with an area under the curve of 0.86 (area = 0.5; p < 0.001, 95%CI: 0.83 to 0.88); therefore, this was the level that better discriminated the mortality in this population of surgical patients (Figure 1).
Patient distribution and their SAPS 3 scores showed that pa-tients with scores equal or lower than 57 had higher rates of survival, but the same was not observed with scores higher than 57. Among patients with SAPS 3 scores higher than 57,
Table II – Patient Characteristics
Characteristics Parameter
Number of patients 1310
Elective surgery 83.8%
Age (years)* 67.1 ± 15.3
Females 60.5%
Caucasian 85.1%
SAPS 3* 48.5 ± 18.1
Length of surgery (hours) 3.0 (2.0-5.0)
Days in the ICU 1 (1.0-3.0)
Days in the hospital 10,0 (5-18)
In-hospital days before surgery 3 (1-8)
ASA
I 11.2%
II 50.9%
III 34.5%
IV 3.5%
Anesthesia
General 39,3%
Neuroaxis 23,5%
General + neuroaxis 13.6%
Type of surgery
Gastrointestinal 34.9%
Orthopedic 28.2%
Vascular 12.5%
Gynecological 5.9%
Urologic 5.8%
Neurologic 5.6%
Head and Neck 3.4%
Thoracic 2.2%
Others 1.7%
ICU mortality 7.6%
Hospital mortality 10.8%
*Results expressed as Mean ± Standard Deviation.
Numbers in parenthesis represent median (25%-75% percentile). ICU = intensive care unit.
Table I – Patient Distribution According to Exclusion Criteria
Exclusion criteria n %
Readmission 349 67.0
Lost data 125 24.0
< 24 h stay 45 8.6
Hemodialysis 2 0.4
Total 521 100
n = number of admissions or patients.
73.5% did not survive versus 26.5% of survivors (OR = 1.32, 95%CI 1.23-1.42, p < 0.0001) (Figure 2).
DISCUSSION
Due to the increasing technical-scientific apparatus and quali-fication of professionals, intensive care units currently con-centrate a large proportion of health care resources. Thus, it is evident that concerns are proportional to the growth of those units.
Good management of those resources is fundamental to equate quality of care with the resources destined to those units. Prognostic indexes represent one of the measures more commonly adopted to determine the cost-benefit ratio of those specialized units. Those indexes allow determining the severity of the population cared for at a specific unit, and they can guide the allocation of personnel and equip-ment; on the other hand, they allow the periodical evalua-tion of the team performance by comparing, for example, predicted and observed mortality rates. This assessment method is important for the longitudinal follow-up of the per-formance of a specific unit.
The SAPS 3 score demonstrated good discriminatory power (ability to distinguish survivors and non-survivors). Observed mortality was very close to the predicted mortality, i.e., 10.8% versus 10.3% (SMR = 1.04) respectively, providing good cali-bration for this sample.
The SAPS 3 score was developed using data from 303 ICUs and 16,784 patients11. However, the SAPS 3 system was not developed to be representative of all types of pa-tients, especially in specific areas or individual types of dis-eases, since it was developed using a general ICU popula-tion. Therefore, external validation is extremely important before applying this score to any type of patient, such as
Figure 1 – SAPS 3 ROC Curve for prediction of hospital mortality.
The score of 57 showed better sensitivity (75%) and specifi city (86%) for hospital mortality, with an area under the curve of 0.86 (area = 0.5; p < 0.001, 95%CI; 0.83-0.88)
Figure 2 – Patient distribution according to the score and evolution (p)
73.5% of patients with SAPS 3 score greater than 57 did not survive
versus 26.5% of survivors (OR = 1.32, 95%CI: 1.23-1.42, p < 0.0001).
100
100 80
80 60
60 40
40 20
20 0
0
Sensitivity 75% Specificity 86% Cutoff point 57 Area 0.86
Sensitivity
Specificity
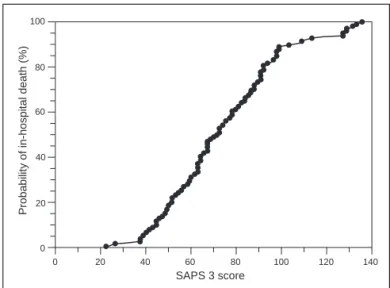
Figure 3 – Relationship between the SAPS 3 system and the proba-bility of hospital death.
The probability of hospital death increases considerably with an increase in SAPS 3 scores.
100
100 120 140
80
80 60
60 40
40 20
20 0
0
SAPS 3 score
Probability of in-hospital death (%)
Survivors Non-survivors
SAPS 3
Survivors 0
20 40 60 80 100 120 140 160
surgical patients. For a long time, surgical patients were evaluated by the ASA physical status, which gives infor-mation on the health status before surgery and, therefore, it is extremely limited to predict the worse evolution and hospital outcome.
Sakr Y et al.16 evaluated 1,851 surgical patients in the ICU, in which the majority were Cardiac Surgery patients. In this study, the discriminatory assessment of the SAPS 3 was bet-ter than that of the APACHE II and SAPS II, but with poor calibration (probability to estimate mortality correlating with the observed mortality). The present study, in which surgical patients undergoing non-cardiac interventions were evalu-ated in two different ICUs, showed better results. Good dis-criminatory power and good calibration were observed, which valorized this new assessment in a population in which the index had not been tested before emphasizing that a multi-center study can reduce possible bias than studies under-taken in only one center.
The prediction of the SAPS 3 model is based exclusively on data evaluated during the first hour after admission to the ICU11,12. Half of the original predicted power of the SAPS 3 score derives from information evaluated before admis-sion to the ICU11. Prognostic systems that include mea-surements after the first 24 hours in the ICU are not valid for ICU screening. Besides, scores obtained more than 24 hours after admission often reflect standard care and not the real clinical status of the patient. This greater advantage of the SAPS 3 can justify its superiority over other prognostic scores. Thus, external validation is necessary to assess the performance of this score in other ICU populations.
In 952 ICU patients, Soares and Salluh observed that SAPS II and SAPS 3 had excellent discrimination in Brazilian ICUs13. This Brazilian study demonstrated that the European SAPS 3 overestimated hospital mortality in this population and the data were not surprising, since in the original model of More-no et al.11, SAPS 3 had the worse calibration for South and
Central America. On the other hand, the calibration applied in the Brazilian study showed good mortality discriminatory power, besides showing the closest ratio between observed and predicted mortality. Soares and Salluh13 also demon-strated that previous score systems, such as APACHE II, are not satisfactory anymore because they had lower dis-criminatory power and significant lack of calibration for some populations, such as oncologic patients. It seems that the APACHE II is obsolete nowadays18. Knaus, the creator of this system, warns researchers to stop using this score to evaluate patient outcome13.
Other models, such as SAPS II, proved to be efficient in some populations, especially in the elderly, but with a tendency to overestimate hospital mortality19.
Due to the easiness to calculate the SAPS 3 index, which does not require more complex analysis, it is suggested that it should be routinely used in ICUs to stratify surgical patients with greater probability of death.
In this context, using the SAPS 3 model in the Brazilian popu-lation of surgical patients is relevant, besides considering pos-sible limitations associated with the prediction model. However, although it was demonstrated that the SAPS 3 sys-tem had good discriminating and calibration power, the pres-ent study has potpres-ential limitations. It can be criticized by the relatively small study population; however, it was designed to have adequate statistical power, and it was undertaken in two intensive care units of different hospitals, which eliminates some biases. Although it is an important matter, the data gath-ered was not evaluated in the present study. Bias related with the data gathered is limited, since the study was carried on by a trained investigative nurse. Previous studies showed that this condition reduces inter-observer variability20.
Annex 1
Demographics/previous health status Diagnostic category Physiologic parameters on admission
Parameters Scores Parameters Scores Parameters Scores
Age Scheduled admission 0 Glasgow
< 40 0 Non-scheduled admission 3 3-4 15
≥ 40<60 5 Urgency 5 10
≥ 60< 70 9 Non-surgical 5 6 7
≥ 70< 75 13 Elective 0 7-12 2
≥ 75<80 15 Emergency 6 ≥ 13 0
≥ 80 18 Type of surgery Heart rate
Comorbidities Transplantation -11 < 120 0
Others 0 Trauma -8 ≥ 120< 160 5
Chemotherapy 3 MR without valve -6 ≥ 160 7
ICC NYHA IV 6 Stroke surgery 5 Systolic blood pressure
Hematologic neoplasia 6 Other 0 < 40 11
Cirrhosis 8 ICU admission add 16 points 16 ≥ 40< 70 8
Aids 8 Reason for admission ≥ 70< 120 3
Metastasis 11 Neurologic ≥120 0
In-hospital days before ICU Seizures -4 Oxygenation
< 14 0 Coma, confusion, agitation 4 Mechanical ventilation PaO2/FiO2< 100 11
≥ 14-28 6 Focal deficit 7 Mechanical ventilation PaO2/FiO2≥ 100 7
≥ 28 7 Intracranial mass effect 11 Without mechanical ventilation PaO2< 60 5
Origin Cardiologic Without mechanical ventilation PaO2≥ 60 0
Operating room 0 Arrhythmia -5 Temperature
ER 5 Hemorrhagic shock 3 < 34.5 7
Other ICU 7 Non-hemorrhagic hypovolemic shock 3 ≥ 34.5 0
Others 8 Distributive shock 5 Leukocytes
Vasoactive drugs Abdomen < 15,000 0
Yes 0 Acute abdomen 3 ≥ 15,000 2
No 3 Severe pancreatitis 9 Platelets
Liver failure 6 < 20,000 13
Others 0 ≥ 20,000< 50,000 8
Infection ≥ 50,000< 100,000 5
Nosocomial 4 ≥ 100,000 0
Respiratory 5 pH
Others 0 ≤ 7.25 3
> 7.25 0
Creatinine
< 1.2 0
≥ 1.2-< 2.0 2
≥ 2.0< 3.5 7
≥ 3.5 8
Bilirubin
<2 0
≥ 2<6 4
≥6 5
REFERÊNCIAS – REFERENCES
1. Almeida SLS, Amendola CP, Horta VM et al. – Hiperlactatemia à ad-missão na UTI é um determinante de morbimortalidade em interven-ções cirúrgicas não cardíacas de alto risco. Rev. Bras. Ter. Intensiva 2006; 18:360-365.
2. Bennett-Guerrero E, Hyam JA, Shaefi S et al. – Comparison of P-POSSUM risk-adjusted mortality rates after surgery between patients in the USA and the UK. Br J Surg 2003;90:1593-1598.
3. Marshall JC, Cook DJ, Christou NV et al. – Multiple organ dysfunction score: a reliable descriptor of a complex clinical outcome. Crit Care Med 1995;23:1638-1652.
4. Knaus WA, Zimmerman JE, Wagner DP et al. – APACHE – acute physiology and chronic health evaluation: a physiologically based classification system. Crit Care Med 1981;9:591-597.
5. Knaus WA, Wagner DP, Draper EA et al. – The APACHE III prognos-tic system: risk prediction of hospital mortality in criprognos-tically ill hospital-ized adults. Chest 1991;100:1619-1636.
6. Le Gall JR, Loirat P, Alperovitch A et al. – A simplified acute physiol-ogy score for ICU patients. Crit Care Med 1984;12:975-977. 7. Le Gall JR, Lemeshow S, Saulnier F. – A new simplified acute
physiol-ogy score (SAPS II) based on a European/North American multicenter study. JAMA 1993;270:2957-2963
8. Baue EA. – Multiple, progressive or sequential systems failure: A syn-drome of the 1970s. Arch Surg 1975;110:779-781.
9. Lemeshow S, Teres D, Klar J et al. – Mortality probability models (MPM II) based on an international cohort of intensive care unit pa-tients. JAMA 1993;270:2478-2486.
10. Cook R, Cook D, Tilley J et al. – Multiple organ dysfunction: baseline and serial component scores. Crit Care Med 2001;29:2046-2050. 11. Moreno RP, Metnitz PG, Almeida E et al. – SAPS 3 – From evaluation
of the patient to evaluation of the intensive care unit. Part 2: Develop-ment of a prognostic model for hospital mortality at ICU admission. Intensive Care Med 2005;31:1345-1355.
12. Metnitz PG, Moreno RP, Almeida E et al. – SAPS 3 – From evalu-ation of the patient to evaluevalu-ation of the intensive care unit. Part 1: Objectives, methods and cohort description. Intensive Care Med 2005;31:1336-1344.
13. Soares M, Salluh JI. – Validation of the SAPS 3 admission prognostic model in patients with cancer in need of intensive care. Intensive Care Med 2006;32:1839-1844.
14. Silva Jr JM, Neves EF, Santana TC et al. – Importância da hiperclore-mia no intraoperatório. Rev Bras Anestesiol 2009;59:304-313. 15. Ledoux D, Canivet JL, Preiser JC et al. – SAPS 3 admission score:
an external validation in a general intensive care population. Intensive Care Med 2008;34:1873-1877.
16. Sakr Y, Krauss C, Amaral AC et al. – Comparison of the performance of SAPS II, SAPS 3, APACHE II, and their customized prognostic models in a surgical intensive care unit. Br J Anaesth 2008;101:798-803.
17. Lemeshow S, Teres D, Pastides H et al. – A method for predicting sur-vival and mortality of ICU patients using objectively derived weights. Crit Care Med 1985;13:519-525.
18. Campos EV, Silva JM Jr, Silva MO et al. – Uso do MODS modificado em pacientes sépticos no departamento de emergência para predizer mortalidade. Rev Bras Ter Intensiva 2005;17:74-79.
19. Metnitz PG, Valentin A, Vesely H et al. – Prognostic performance and customization of the SAPS II: results of a multicenter Austrian study. Simplified acute physiology score. Intensive Care Med 1999;| 25:192-197.
20. Polderman KH, Jorna EM, Girbes AR. – Inter-observer variability in APACHE II scoring: effect of strict guidelines and training. Intensive Care Med 2001;27:1365-1369.
RESUMEN
Silva Jr JM, Malbouisson LMS, Nuevo HL, Barbosa LGT, Marubaiashy L, Teixeira IC, Nassar Jr AP, Carmona MJC, Silva IF, Auler Jr JOC, Rezende E – Aplicabilidad de la puntuación Fisiológica Aguda Simpli-ficada (SAPS 3) en Hospitales Brasileños.
JUSTIFICATIVA Y OBJETIVOS: El sistema de pronóstico SAPS 3 (Simplified Acute Physiology Score 3), se compone de 20 varia-bles, representadas por una puntuación fisiológica aguda y por una evaluación del estado previo, con el fin de establecer el ín-dice predictivo de mortalidad para los pacientes admitidos en las unidades de cuidados intensivos (UCI). El estudio quiso validar ese sistema y verificar el poder discriminatorio de ese índice en pacientes quirúrgicos de Brasil.
MÉTODO: Estudio prospectivo, realizado en dos UCIs especializadas en pacientes quirúrgicos de dos hospitales diferentes, en el período de un año, donde quedaron excluidos pacientes con edad inferior a los 16 años, que permanecieron un tiempo inferior a 24 horas en la UCI, los readmitidos y los que fueron admitidos para el procedimiento de diálisis. La habilidad predictiva del índice SAPS 3 para diferenciar a los sobrevivientes y a los no sobrevivientes, se constató utilizando la curva ROC y la calibración a través del test Hosmer-Lemeshow goodness-of-fit.
RESULTADOS: Se incluyeron en el estudio 1310 pacientes. Las ope-raciones gastrointestinales fueron predominantes (34,9%). El menor valor del índice SAPS 3 fue 18 y el mayor 154, un promedio de 48,5 ± 18,1. La mortalidad hospitalaria prevista y real alcanzó los 10,3% y 10,8% respectivamente, la razón de mortalidad estandarizada (SMR) fue 1,04 (IC95% = 1,03-1,07). La calibración por el método Hosmer y Lemeshow mostró X2 = 10,47 p = 0,234. El valor de la puntuación SAPS 3 que desglosó mejor a los sobrevivientes y a los no sobrevi-vientes fue 57, con una sensibilidad de un 75,8% y una especificidad de un 86%. De los pacientes con el índice SAPS 3 mayor que 57, un 73,5% no sobrevivieron contra un 26,5% de sobrevivientes (OR = 1,32 IC95% 1,23 – 1,42, p < 0,0001).