ORIGINAL ARTICLE
DOI: 10.1590/1516-3180.2013.1313478Inadequate food intake among adults living with HIV
Inadequação do consumo alimentar em adultos vivendo com HIV
Kelly Virecoulon Giudici
I, Ana Clara Fonseca Leitão Duran
I, Patricia Constante Jaime
IIFaculdade de Saúde Pública, Universidade de São Paulo (FSP-USP), São Paulo, Brazil
ABSTRACT
CONTEXT AND OBJECTIVE: The number of people living with HIV (PLHIV) in Brazil is between 600,000 and 890,000. Assessing the diet is important in planning healthcare actions and improving PLHIV’s qual-ity of life. This study aimed to estimate the prevalence of inappropriate protein, total fat, saturated fat, carbohydrate, iber, sodium, calcium and cholesterol intake among PVHIV on highly-active antiretroviral therapy (HAART).
DESIGN AND SETTING: Cross-sectional study in nine Specialized STD/AIDS Healthcare Centers in São Paulo.
METHODS: Men and women aged 20 to 59 years, on HAART for at least three months, were included. Nutrient intake was assessed using 24-hour food recall applied in person and repeated among 30% of the population by telephone. The between and within-person variances were corrected.
RESULTS: 507 individuals were evaluated: 58% male, mean age 41.7 years (standard deviation, SD = 7.8). The mean time since HIV diagnosis was 6.6 years (SD = 4.1), and since HAART onset, 5.1 years (SD = 3.3). More than 20% of the population presented intake above the recommendations for saturated fat, choles-terol and/or sodium, and below the recommendations for iber. The recommended maximum tolerable sodium level was exceeded by 99% of the sample, and 86% of men and 94% of women did not reach the daily recommendations for calcium. Protein, carbohydrate and total fat intakes were adequate for the majority of the population.
CONCLUSIONS: A signiicant portion of the population presented inappropriate intake of saturated fat, sodium, iber and calcium. Interventions aimed at improving PLHIV’s dietary quality are needed.
RESUMO
CONTEXTO E OBJETIVO: O número de pessoas vivendo com HIV (PVH) no Brasil oscila entre 600.000 e 890.000. A avaliação de dietas é relevante para o planejamento de ações de saúde e melhoria da qualidade de vida desses indivíduos. Este estudo visa estimar a prevalência de inadequação do consumo de prote-ínas, lipídios totais, lipídios saturados, carboidratos, ibras, sódio, cálcio e colesterol em PVH em terapia antirretroviral de alta atividade (TARV).
TIPO DE ESTUDO E LOCAL: Estudo transversal em nove Centros de Assistência Especializados em DST/Aids localizados em São Paulo.
MÉTODOS: Homens e mulheres com idade entre 20 e 59 anos, em TARV por no mínimo 3 meses, foram incluídos. O consumo de nutrientes foi avaliado com um recordatório alimentar de 24 horas aplicado pes-soalmente e repetido em 30% da população por telefone. A variabilidade intra e interpessoal foi corrigida.
RESULTADOS: Foram avaliados 507 indivíduos, 58% homens e idade média de 41,7 anos (desvio padrão, DP = 7,8). O tempo médio de infecção por HIV foi de 6,6 anos (DP = 4,1), e de TARV, de 5,1 anos (DP = 3,3). Mais que 20% da população apresentou consumo acima das recomendações para lipídios saturados, colesterol e/ou sódio, e abaixo para ibras. Excederam a recomendação máxima tolerada para sódio 99% da amos-tra, enquanto 86% dos homens e 94% das mulheres não atingiram as recomendações diárias para o cálcio. O consumo de proteínas, carboidratos e lipídios totais mostrou-se adequado para a maioria da população.
CONCLUSÕES: Uma importante parcela da população apresentou consumo inadequado para lipídios satu-rados, sódio, ibras e cálcio. Intervenções que visem melhorar a qualidade da dieta de PVH são necessárias. IBSc. Doctoral Student of Public Health Nutrition,
Department of Nutrition, Faculdade de Saúde Pública, Universidade de São Paulo (FSP-USP), São Paulo, Brazil.
IIPhD. Assistant Professor, Department of
Nutrition, Faculdade de Saúde Pública, Universidade de São Paulo (FSP-USP), São Paulo, Brazil.
KEY WORDS:
Eating. Diet. HIV.
Antiretroviral therapy, highly active. Adult.
PALAVRAS-CHAVE:
Ingestão de alimentos. Dieta.
HIV.
OR IG IN A L A R T IC L E | Giudici KV, Duran ACFL, Jaime PC
INTRODUCTION
Since the irst notiication of AIDS in Brazil, in 1980, the number of individuals infected by the human immunodeiciency virus (HIV) has been increasing greatly. Estimates of the numbers of people living with HIV (PLHIV) in Brazil range from 600,000 to 890,000 individuals,1 although the number of notiied cases from
1980 to June 2011 total 608,230 (65.4% men), which corresponds to an incidence rate of 17.9 cases per 100,000 inhabitants.2
In 1996, universal access to highly-active antiretroviral therapy (HAART) through the public healthcare system was established by the Brazilian Ministry of Health. Meanwhile, the HIV-derived mortality rates have decreased, followed by a decline in associated opportunistic infections and hospitaliza-tion, along with an increase in survival.2 Fiteen years later, the
Brazilian program of universal access to HAART beneits over 200,000 PLHIV,3 which corresponds to antiretroviral therapy
coverage of 97% of live notiied cases and 50 to 89% of the entire HIV-infected population in the country.4
Following these important changes, HIV infection has started to be considered a chronic and potentially manageable disease. However, side efects secondary to prolonged use of HAART have brought new demands for healthcare services spe-cializing in caring for PLHIV.5,6
Among the side efects of HAART are gastrointestinal prob-lems and lipodystrophy. he latter is a syndrome deined as a set of changes that includes fat loss in peripheral areas (face, but-tocks, arms and legs) and fat gain in central portions of the body (abdomen, neck and chest). HAART also produces metabolic alterations as side efects, such as hypercholesterolemia, hyper-triglyceridemia, insulin resistance and lactic acidosis.7,8 hese
metabolic changes do not afect all patients on HAART, and this supports the hypothesis that they are caused not only by this drug but also by genetics and behavioral variables like food consump-tion and stress.8
Healthier eating may ofset or at least minimize these side efects, and this, along with the already known beneits of a healthy diet,5 gives rise to the need for food intake assessment in this group.
Assessing food intake has become important in planning actions relating to care for PLHIV, among the new demands that form part of caring for this population. Knowing how appropriate this group’s diet is plays an important role in planning healthcare actions, whether for monitoring or for intervening. Moreover, this provides backing for establishing hypotheses about the rela-tionship between diet and health.9
OBJECTIVE
his study aimed to investigate the prevalence of inappropriate intake of protein, total fat, saturated fat, carbohydrate, dietary iber, sodium, calcium and cholesterol among people living with HIV who were on HAART in the city of São Paulo, Brazil.
METHODS
Data on the participants in this cross-sectional study were gath-ered at nine of the iteen Specialized Community Healthcare Centers for sexually transmitted diseases/acquired immunodei-ciency syndrome (STD/AIDS) that are administered through the municipal STD/AIDS program. hese Community Healthcare Centers were located in four diferent geographical regions of the city of São Paulo, and no socioeconomic diferences were found when they were compared with the Centers that could not be included in the study due to infrastructure problems at the time of the data collection.
Adults (aged 20-59 years) living with HIV who had been on HAART for at least three months were invited to join the study. Participants were chosen using a consecutive cumulative approach between November 2007 and June 2008. Patients who agreed to participate were admitted ater signing an informed consent form, and were fully informed about the objectives and procedures of the research.
Ater interviews, all the participants received brief nutri-tional counseling promoting healthy eating, physical activity and prevention of biochemical and morphological changes, in accor-dance with the recommendations of the Dietary Guidelines for the Brazilian Population10 and the Nutritional Recommendations
for Individuals Living with HIV/AIDS.11 hey were also referred
to the dietitians at the STD/AIDS Specialized Community Healthcare Centers, if necessary. he Ethics Committees of both the School of Public Health, University of São Paulo (Faculdade de Saúde Pública, Universidade de São Paulo, FSP-USP) and the Health Department of the municipality of São Paulo approved this study. Subject anonymity and information conidentiality were ensured at all times.
Macronutrient intake (protein, total fat, saturated fat, carbo-hydrate and dietary iber) and micronutrient intake (sodium, cal-cium and cholesterol) were assessed by means of a 24-hour food recall that was applied to 540 individuals. hese subjects were interviewed in person by a dietitian (who was also the ieldwork coordinator) or by trained undergraduate nutrition students under the supervision of the same dietitian. A second 24-hour food recall was applied on non-consecutive days, within a one-week interval, to 30% of the sample (n = 161). his second mea-surement was made via telephone by the same evaluator, and only if the participant agreed to be contacted. It enabled correc-tion of the within-individual variability in food intake.12
Out of the 540 participants, 32 were excluded from the pres-ent analysis because they reported a total energy intake below the third percentile (768.4 kcal) or above the 97th percentile
(5,680.7 kcal), and therefore were considered outliers (possible dietary intake underreporting or overreporting, i.e. the intakes were considered unlikely to be correct13). Another participant
I n a d e q u a te food intake among adults living with HIV | ORIGINAL ARTICLE
507 individuals were then analyzed. Among these, 31% gave responses for a second 24-hour food recall.
Detailed descriptions of food types and serving sizes con-sumed the day before the interview were obtained using rigorous standardization, and these data were inputted into the NutWin sotware (Departamento de Informática em Saúde/Escola Paulista de Medicina [DIS-EPM], São Paulo, Brazil). Standardizations were based on Brazilian Dietary Guidelines.14,15
Foods that were not found in the NutWin sotware datasets were included by using the following nutrient databases hierarchi-cally: TACO (Tabela Brasileira de Composição de Alimentos),16
TBCA-USP (Tabela Brasileira de Composição de Alimentos-USP)17 and NNDSR-USDA (National Nutrient Database for
Standard Reference, United States Department of Agriculture).18
For any processed foods for which nutritional information was not available, data were obtained from the nutritional fact labels, available on the food companies’ websites.
Sociodemographic data were collected using a standard-ized questionnaire and included age, gender and education level. Clinical data, which included CD4 cell count (cells/mm3)
ana-lyzed by means of low cytometry (FACSCalibur, BD) and viral load (copies/ml) measured using branched deoxyribonucleic acid (DNA) assay (Versant440, Siemens), were obtained from the participants’ medical iles. he maximum time interval between the interview date and the date of obtaining the clinical data was approximately six months. he dates of the irst positive HIV diagnosis and onset of HAART use were also obtained from the participants’ medical iles. he viral load was analyzed as a dichotomous variable (detectable or undetectable), taking the threshold to be 50 copies/ml. he sample sizes for the analyses of CD4 cell count and viral load were 501 and 473, respectively, due to missing values.
Body mass index (BMI) was used to characterize the nutri-tional status of the population, and it was estimated from self-reported measurements of height and weight. his methodology has been validated and published elsewhere.19
Statistical analysis
Initially, descriptive analysis was performed. Food intake was presented as absolute measurements and density (total intake of each nutrient per 1,000 kcal consumed). Means were com-pared using Student’s t test, and categorical variables were ana-lyzed using Pearson’s chi-square test. he signiicance level accepted was 5%. he statistical analyses were performed using SPSS (Statistical Package for the Social Sciences), version 17.0 (SPSS Inc., Chicago, IL, USA).
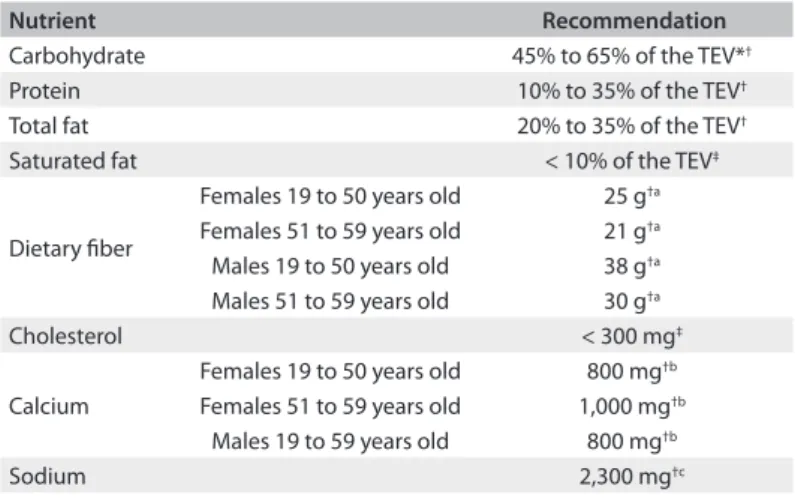
he prevalence of inadequate food intake was estimated by comparing the population’s intake with the dietary reference intake (DRI) reference values for carbohydrates, lipids, proteins, dietary iber, calcium and sodium.20 For micronutrients, the estimated
average requirement (EAR) was the recommended standard. Since for dietary iber intake there are still not enough studies to allow the establishment of EAR values, iber intake was assessed using adequate intake (AI) values. Although this did not allow the per-centage of inadequate intake to be estimated, it allowed us to con-clude whether the intake was probably adequate.
Sodium intake was evaluated based on its upper limit (UL) of tolerable intake. Although its EAR is available, the general popula-tion’s intake is usually much higher than what is recommended,21
and easily surpasses this threshold. herefore, it is more realistic to ascertain its appropriateness in relation to the maximum tol-erated level. For saturated fat and cholesterol, the reference val-ues recommended by the World Health Organization22 (which
are also the recommendations of the Dietary Guidelines for the Brazilian Population10) were used, since no established DRI
val-ues are yet available for either of these nutrients (Table 1). he Iowa State University (ISU) method, developed by Nusser et al.,23 was used to adjust the between and
within-indi-vidual distribution of the variability. his procedure requires at least a second 24-hour food recall to be conducted on a subsam-ple of the study population, and creates descriptive measure-ments of intake and the between and within-individual variance components. Variance component estimates and models for esti-mating the distribution of the usual intake were developed on the PC-side sotware, version 1.0.23
he adequacy of carbohydrate, protein and fat intake (equivalent to proportional ranges from the total energy intake) was estimated as the sum of percentages above and below the range of nutrient recommendations. For the other nutrients, the percentages relating to the intake below the recommended level (in the case of dietary iber and calcium) or above the rec-ommended level (in the case of saturated fat, cholesterol and sodium) were used.
Nutrient Recommendation
Carbohydrate 45% to 65% of the TEV*†
Protein 10% to 35% of the TEV†
Total fat 20% to 35% of the TEV†
Saturated fat < 10% of the TEV‡
Dietary iber
Females 19 to 50 years old 25 g†a
Females 51 to 59 years old 21 g†a
Males 19 to 50 years old 38 g†a
Males 51 to 59 years old 30 g†a
Cholesterol < 300 mg‡
Calcium
Females 19 to 50 years old 800 mg†b
Females 51 to 59 years old 1,000 mg†b
Males 19 to 59 years old 800 mg†b
Sodium 2,300 mg†c
Table 1. Food intake recommendations
ORIGINAL ARTICLE | Giudici KV, Duran ACFL, Jaime PC
All the nutrient levels in the study population were homoge-neous regarding gender and age, except for calcium and dietary iber, for which the results were presented stratiied by age and gender (Table 1).
RESULTS
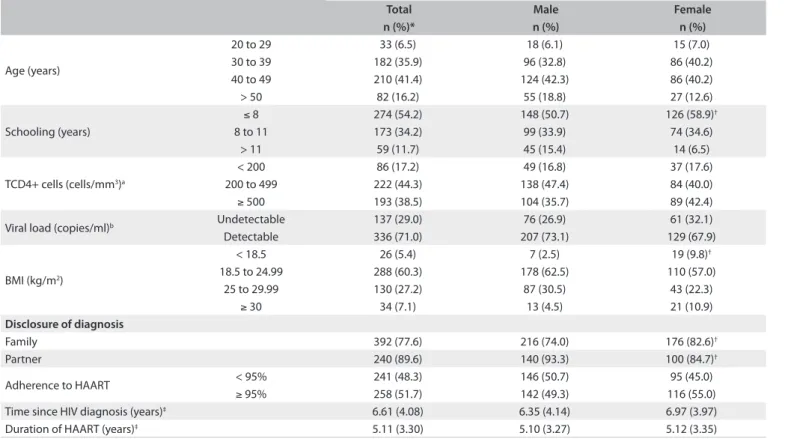
A total of 507 patients were evaluated, with a mean age of 41.7 years (standard deviation, SD = 7.8 years), of whom 57.8% were men. he majority reported that they had had eight years of education or less (54.2%), and 60.3% of the sample presented healthy weight (BMI between 18.5 and 24.9 kg/m2). Only 5.4%
were underweight, whereas 34.3% were overweight or obese. he mean time since the irst HIV-positive diagnosis was 6.6 years (SD = 4.1 years), and the mean time since the onset of HAART use was 5.1 years (SD = 3.3) (Table 2).
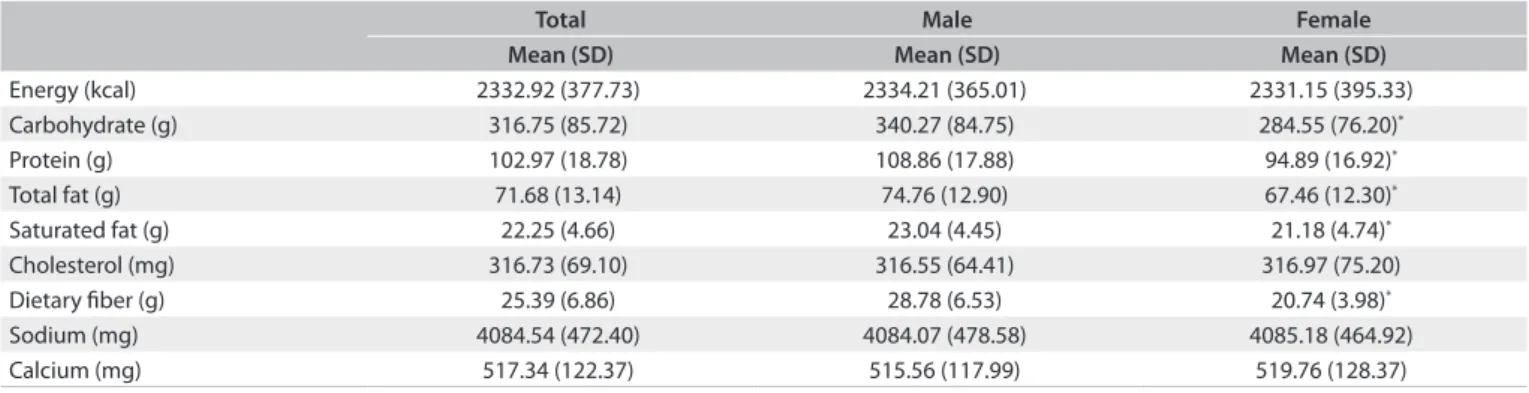
Ater correcting for both the between and the within-individ-ual variability, the mean habitwithin-individ-ual energy intake of the population was 2,333 kcal (SD = 377 kcal) (Table 3). he mean sodium and calcium intake were respectively 4,084.5 mg (SD = 472.4 mg) and 517.3 mg (SD = 122.4 mg). he macronutrient intake dif-fered signiicantly according to gender (P < 0.01). Men had higher intakes of carbohydrates (340.3 g, SD = 84.8 g versus 284.6 g, SD = 76.2 g), protein (108.9 g, SD = 17.9 g versus 94.9 g, SD = 16.9 g),
total fat (74.8 g, SD = 12.9 g versus 67.5 g, SD = 12.3 g) and satu-rated fat (23.0 g, SD = 4.5 g versus 21.2 g, SD = 4.7 g).
he mean intake of saturated fat was 9.6 g/1,000 kcal (SD = 1.7 g) (Table 4). Sodium and calcium presented mean den-sities of 1775.0 mg (SD = 218.4 mg) and 223.1 mg (SD = 45.5 mg) per 1,000 kcal, respectively.
he macronutrient intake was within the recommended range for the majority of the population, except for dietary iber, which was low for 65% of the sample (Table 5).
Using the UL of 2,300 mg to evaluate the proportion of indi-viduals with excessive sodium intake, it was found that 99% had an intake above the maximum tolerable level. For calcium, among women between 19 and 50 years old, 94% had an intake below the recommended level (800 mg). Among women over 50 years old, none of them reached the recommendation (1,000 mg). Among men, 86% had inadequate intake.
DISCUSSION
his study examined the prevalence of inadequate food con-sumption among adults living with HIV in São Paulo, Brazil. he analysis revealed that there was high prevalence of inappro-priate levels of saturated fat, cholesterol, calcium, dietary iber and sodium.
Total Male Female
n (%)* n (%) n (%)
Age (years)
20 to 29 33 (6.5) 18 (6.1) 15 (7.0)
30 to 39 182 (35.9) 96 (32.8) 86 (40.2)
40 to 49 210 (41.4) 124 (42.3) 86 (40.2)
> 50 82 (16.2) 55 (18.8) 27 (12.6)
Schooling (years)
≤ 8 274 (54.2) 148 (50.7) 126 (58.9)†
8 to 11 173 (34.2) 99 (33.9) 74 (34.6)
> 11 59 (11.7) 45 (15.4) 14 (6.5)
TCD4+ cells (cells/mm3)a
< 200 86 (17.2) 49 (16.8) 37 (17.6)
200 to 499 222 (44.3) 138 (47.4) 84 (40.0)
≥ 500 193 (38.5) 104 (35.7) 89 (42.4)
Viral load (copies/ml)b Undetectable 137 (29.0) 76 (26.9) 61 (32.1)
Detectable 336 (71.0) 207 (73.1) 129 (67.9)
BMI (kg/m2)
< 18.5 26 (5.4) 7 (2.5) 19 (9.8)†
18.5 to 24.99 288 (60.3) 178 (62.5) 110 (57.0)
25 to 29.99 130 (27.2) 87 (30.5) 43 (22.3)
≥ 30 34 (7.1) 13 (4.5) 21 (10.9)
Disclosure of diagnosis
Family 392 (77.6) 216 (74.0) 176 (82.6)†
Partner 240 (89.6) 140 (93.3) 100 (84.7)†
Adherence to HAART < 95% 241 (48.3) 146 (50.7) 95 (45.0)
≥ 95% 258 (51.7) 142 (49.3) 116 (55.0)
Time since HIV diagnosis (years)‡ 6.61 (4.08) 6.35 (4.14) 6.97 (3.97)
Duration of HAART (years)‡ 5.11 (3.30) 5.10 (3.27) 5.12 (3.35)
Table 2. Characterization of the studied population according to gender (São Paulo, 2008)
Inadequate food intake among adults living with HIV | ORIGINAL ARTICLE
he prevalence of intake below or above the recommenda-tions was lower than 8% for carbohydrates, protein and total fat, despite the excessive intake of some nutrients and insuicient intake of others. Diferent results were found by Hendricks et al.24
in a study among American PLHIV, in which the intake of total fat was higher than the recommended level for more than half of the population.
Excessive saturated fat and cholesterol intake is associated with some of the side efects from antiretroviral therapy and may result in a disturbing propensity towards deposition of visceral fat and increased risk of cardiovascular diseases.7 On the other hand,
the levels of dietary iber, which is known to be a protective factor against cardiovascular diseases, and helps to control insulin resis-tance and dyslipidemia,25,26 were inadequate in 65% of the
pop-ulation. his proportion reached 84% among men between 19 and 50 years. Similar results were observed in an American study on PLHIV, in which the recommended amount of iber intake per day (20 g/day) was lower than the values used in the present study. Even so, more than half of the individuals presented lower intake of iber, especially among obese women (94%).24
hese results suggest that this population may have a low-quality diet, characterized by a low intake of whole grains, fruits and vegetables, which are good sources of iber, thus corroborat-ing previous indcorroborat-ings from a sample of adults livcorroborat-ing with HIV in the city of São Paulo.27
he majority of the population had a low calcium intake, which has been associated with osteoporosis, hypertension, obe-sity and cervical cancer.28 A similar result was observed by Leite
and Sampaio.29
However, the sodium intake was high for virtually the entire population. his result expresses a potential risk of adverse health efects, such as gastric cancer, hypertension, osteoporosis, stroke and cardiovascular diseases, which are closely connected with other risks arising from inadequate intake (excessive or insui-cient) of saturated fat, iber and cholesterol, for example.30-32
here is still a scarcity in the literature of studies estimating sodium intake in the population, and even more so in relation
to PLHIV, in part because of the diiculty in measuring its con-sumption. Another limitation is the lack of accurate measurement of the sodium content of foods consumed by individuals in most food composition databases. A study using data from the Brazilian Family Budget Survey (Pesquisa de Orçamentos Familiares, POF) from 2002-2003 showed that the average amount of sodium avail-able for consumption was 4.5 g per person per day, and was even higher in rural households than in urban ones.33
he prevalence of overweight or obesity was high in this popu-lation (34%), especially among women, and this corroborates what has been observed in the Brazilian population in general. Between 1975 and 2003, the prevalence of obesity in adults increased from 2.7% in men and 7.4% in women to 8.8% and 13.0% respectively.34
In 2009, it was seen that obesity had continued to increase: its prevalence was 12.5% in men and 16.9% in women.35 Data from
telephone-based surveillance of risk and protective factors for chronic diseases (Vigilância de Fatores de Risco e Proteção para Doenças Crônicas por Inquérito Telefônico, VIGITEL) collected in 27 Brazilian state capitals in 2010 showed that the prevalence of overweight (BMI ≥ 25 kg/m2) was 48.5% (95% conidence interval,
CI: 45.2-51.8) and obesity (BMI ≥ 30 kg/m2), 15.0% (95% CI
12.8-17.2) in the city of São Paulo.36
he issue of the increasing prevalence of overweight in HIV-infected populations, also shown by Jaime et al.,37 corroborates
the trend of the nutritional transition process observed in the Brazilian population, from a malnutrition proile to a proile anchored in overweight.38 hese results derive directly from the
choices that people make relating to their own food intake and physical activity.
his study is subject to a few limitations. One is in relation to the sampling method chosen, which was a convenience sample, although improved through a consecutive cumulative approach. Another limitation relates to the method chosen for measuring food intake: 24-hour food recalls depend on the interviewee’s memory, and refer to the current diet, not the habitual diet. On the other hand, it was possible to reduce the efects of both the between and the within-individual variances, thereby making it
Total Male Female
Mean (SD) Mean (SD) Mean (SD)
Energy (kcal) 2332.92 (377.73) 2334.21 (365.01) 2331.15 (395.33)
Carbohydrate (g) 316.75 (85.72) 340.27 (84.75) 284.55 (76.20)*
Protein (g) 102.97 (18.78) 108.86 (17.88) 94.89 (16.92)*
Total fat (g) 71.68 (13.14) 74.76 (12.90) 67.46 (12.30)*
Saturated fat (g) 22.25 (4.66) 23.04 (4.45) 21.18 (4.74)*
Cholesterol (mg) 316.73 (69.10) 316.55 (64.41) 316.97 (75.20)
Dietary iber (g) 25.39 (6.86) 28.78 (6.53) 20.74 (3.98)*
Sodium (mg) 4084.54 (472.40) 4084.07 (478.58) 4085.18 (464.92)
Calcium (mg) 517.34 (122.37) 515.56 (117.99) 519.76 (128.37)
Table 3. Food intake adjusted according to the within-individual variability, among adults living with HIV (São Paulo, 2008)
ORIGINAL ARTICLE | Giudici KV, Duran ACFL, Jaime PC
possible to improve the measurement accuracy. Moreover, this methodology has been shown to be adequate.12,39
hirdly, we chose to apply the second 24-hour food recall to only 30% of the sample via telephone. Although the accuracy of this approach might be limited in a group of low education level, it has been shown that interviews conducted by telephone to col-lect dietary data have good reproducibility, and that respondents of diferent ages and education levels understand the questions and have no diiculty in answering them.40
As obesity among HIV-infected populations becomes an important issue, the prevalence of metabolic syndrome may increase, thus requiring new clinical care for these speciic condi-tions in this population.24 In the general population, there is
exten-sive evidence of beneicial efects derived from maintaining nor-mal levels of plasma lipoproteins, with weight control and blood pressure control, in order to reduce the risk of cardiovascular dis-eases and increase the quality of life.41 hus, diet has an important
role in modifying these risk factors among people living with HIV.
CONCLUSIONS
Most of the population reported an adequate intake of macro-nutrients, except for saturated fat and dietary iber. Moreover, virtually the entire sample had excessive sodium intake and low calcium intake. Actions to promote healthy eating should be included in designing public policies, with the aim of improving the quality of life of PLHIV.
REFERENCES
1. Joint United Nations Programme on HIV/AIDS (UNAIDS)/World
Health Organization (WHO). AIDS epidemic update: November 2009.
Geneva: World Health Organization; 2009. Available from: http://
data.unaids.org/pub/report/2009/jc1700_epi_update_2009_en.pdf.
Accessed in 2012 (Aug 7).
2. Ministério da Saúde. Secretaria de Vigilância em Saúde. Departamento
de DST, Aisa e Hepatites Virais. Boletim Epidemiológico - Aids e DST.
Brasília: Ministério da Saúde; 2011. Available from: http://www.aids.
gov.br/publicacao/2011/boletim_epidemiologico_2011. Accessed
in 2012 (Aug 7).
3. Monitor aids. Indicadores. Número de pacientes em terapia ARV.
Available from: http://www.sistemas.aids.gov.br/monitoraids/#.
Accessed in 2012 (Aug 7).
4. Joint United Nations Programme on HIV/AIDS (UNAIDS)/World Health
Organization (WHO). Global report: UNAIDS report on the global aids
epidemic 2010. Geneva: World Health Organization; 2010. Available
from: http://www.unaids.org/globalreport/documents/20101123_
GlobalReport_full_en.pdf. Accessed in 2012 (Aug 7).
5. Food and nutrition technical assistance (FANTA) project. HIV/AIDS:
a guide for nutritional care and support. 2nd edition. Washington:
Academy for Educational Development; 2004. Available from: http://
www.fantaproject.org/downloads/pdfs/HIVAIDS_Guide02.pdf.
Accessed in 2012 (Aug 7).
6. Fields-Gardner C, Fergusson P; American Dietetic Association;
Dietitians of Canada. Position of the American Dietetic Association
and Dietitians of Canada: nutrition intervention in the care of persons
with human immunodeiciency virus infection. J Am Diet Assoc.
2004;104(9):1425-41.
7. Monier PL, Wilcox R. Metabolic complications associated with the use
of highly active antiretroviral therapy in HIV-1-infected adults. Am J
Med Sci. 2004;328(1):48-56.
8. Tien PC, Benson C, Zolopa AR, et al. The study of fat redistribution
and metabolic change in HIV infection (FRAM): methods, design, and
sample characteristics. Am J Epidemiol. 2006;163(9):860-9.
9. Slater B, Marchioni DL, Fisberg RM. Estimando a prevalência da
ingestão inadequada de nutrientes. [Estimating prevalence of
inadequate nutrient intake]. Rev Saude Publica. 2004;38(4):599-605.
10. Ministério da Saúde. Secretaria de Atenção à Saúde. Departamento
de Atenção Básica. Coordenação-Geral de Política de Alimentação e
Nutrição. Guia alimentar para a população brasileira. Promovendo a
alimentação saudável. Série A. Normas e Manuais Técnicos. Brasília:
Nutrient
Intake above or below the recommendations
%
Carbohydrate (% TEV) 6.40*
Protein (% TEV) 0.00*
Total fat (% TEV) 7.18*
Saturated fat (% TEV) 24.63ª
Cholesterol (mg) 53.69ª
Sodium (mg) 99.28b
Calcium (mg)
19 to 50-year-old females (n = 191) 93.92*
51 to 59-year-old females (n = 23) 100.00*
19 to 59-year-old males (n = 293) 86.05*
Dietary iber (g)
19 to 50-year-old females (n = 191) 73.97†
51 to 59-year-old females (n = 23) 67.24†
19 to 50-year-old males (n = 248) 81.83†
51 to 59-year-old males (n = 45) 69.83†
Table 5. Prevalence of food intake above or below the
recommendations among adults living with HIV (São Paulo, 2008)
TEV = total energy value; *Inadequate intake; †Below the recommended adequate intake; ªAbove the levels recommended by the World Health Organization; bAbove the recommended tolerable upper intake limit.
Mean (SD)
Carbohydrate (g/1000 kcal) 134.51 (21.76)
Protein (g/1000 kcal) 44.34 (5.72)
Total fat (g/1000 kcal) 30.84 (3.64)
Saturated fat (g/1000 kcal) 9.60 (1.69)
Cholesterol (mg/1000 kcal) 136.40 (23.77)
Dietary iber (g/1000 kcal) 10.97 (2.68)
Sodium (mg/1000 kcal) 1774.99 (218.44)
Calcium (mg/1000 kcal) 223.05 (45.48)
Table 4. Food intake density adjusted according to the within-individual
variability, among adults living with HIV (São Paulo, 2008)
Inadequate food intake among adults living with HIV | ORIGINAL ARTICLE
Ministério da Saúde; 2006. Available from: http://189.28.128.100/
nutricao/docs/geral/guia_alimentar_conteudo.pdf. Accessed in
2012 (Aug 7).
11. Ministério da Saúde. Secretaria em Vigilância em Saúde. Secretaria
de atenção à Saúde. Programa Nacional de DST e Aids. Manual
clínico de alimentação e nutrição na assistência a adultos infectados
pelo HIV. Série Manuais no 71. Brasília: Ministério da Saúde; 2006.
Available from: http://www.aids.gov.br/sites/default/iles/manual_
alimentacao_nutricao.pdf. Accessed in 2012 (Aug 7).
12. Verly Junior E. Prevalência de inadequação da ingestão de nutrientes
entre adolescentes do município de São Paulo [dissertation].
São Paulo: Faculdade de Saúde Pública da Universidade de São
Paulo; 2009. Available from: http://www.teses.usp.br/teses/
disponiveis/6/6138/tde-08092009-084842/pt-br.php. Accessed in
2012 (Aug 7).
13. World Health Organization. Food and Agriculture Organization of the
United Nations. The United Nations University. Energy and protein
requirements. Technical Report Series 724. Geneva: World Health
Organization; 1985. Available from: http://www.fao.org/docrep/003/
AA040E/AA040E00.HTM. Accessed in 2012 (Sep 4).
14. Fisberg RM, Villar BS. Manual de receitas e medidas caseiras para
cálculo de inquéritos alimentares: manual elaborado para auxiliar o
processamento de dados de inquéritos alimentares [Handbook of
recipes and home measures for nutritional surveys calculation]. São
Paulo: Signus; 2002.
15. Pinheiro ABV. Tabela para avaliação de consumo alimentar em
medidas caseiras. 5a ed. São Paulo: Atheneu; 2004.
16. Tabela brasileira de composição de alimentos. 4a ed. rev. ampl.
Campinas: NEPA/UNICAMP; 2011. Available from: http://www.
unicamp.br/nepa/taco/contar/taco_4_edicao_ampliada_e_revisada.
pdf?arquivo=taco_4_versao_ampliada_e_revisada.pdf&PHPSESSID=
fd444402ec77b703d4bfdba1aa1c2314. Accessed in 2012 (Aug 7).
17. Departamento de Alimentos e Nutrição Experimental FCP/USP.
TBCA USP 5.0 Tabela brasileira de composição de alimentos. Projeto
integrado de composição de alimentos. BRASILFOODS. Available
from: http://www.fcf.usp.br/tabela. Accessed in 2012 (Aug 7).
18. USDA Nutrient Data Laboratory. Agricultural Research Service. USDA
Nutrient Database for Standard Reference, Release 14. Available from:
http://www.nal.usda.gov/fnic/foodcomp/Data/SR14/sr14.html.
Accessed in 2012 (Aug 7).
19. Duran AC, Florindo AA, Jaime PC. Can self-reported height and
weight be used among people living with HIV/AIDS? Int J STD AIDS.
2012;23(4):e1-6.
20. Institute of Medicine of the National Academies. Background
information. Dietary reference intakes tables and application.
Washington: National Academies Press; 2010. Available from: http://
www.iom.edu/Activities/Nutrition/SummaryDRIs/DRI-Tables.aspx.
Accessed in 2012 (Aug 7).
21. Bisi Molina Mdel C, Cunha Rde S, Herkenhoff LF, Mill JG.
Hipertensão arterial e consumo de sal em população urbana
[Hypertension and salt intake in an urban population]. Rev Saude
Publica. 2003;37(6): 743-50.
22. FAO Corporate Document Repository. Diet nutrition and the
prevention of chronic diseases. Who Technical Report Series 916.
Report of a joint WHO/FAO expert consultation. World Health
Organization. Food and Agriculture Organization of the United
Nations. Geneva: World Health Organization; 2003. Available from:
http://www.fao.org/DOCREP/005/AC911E/AC911E00.HTM. Accessed
in 2012 (Aug 7).
23. Nusser SM, Carriquiry AL, Dodd KW, Fuller WA. A semiparametric
transformation approach to estimating usual daily intake distributions.
Journal of the American Statistical Association. 1996;91(436):1440-9.
Available from: http://www.jstor.org/discover/10.2307/2291570?ui
d=3737664&uid=2129&uid=2&uid=70&uid=4&sid=55967047503.
Accessed in 2012 (Aug 7).
24. Hendricks KM, Willis K, Houser R, Jones CY. Obesity in HIV-infection:
dietary correlates. J Am Coll Nutr.2006;25(4):321-31.
25. Neumann AICP, Shirassu MM, Fisberg RM. Consumo de alimentos de
risco e proteção para doenças cardiovasculares entre funcionários
públicos [Consumption of protective and promotive foods in
cardiovascular diseases among public employees]. Rev Nutr.
2006;19(1):19-28.
26. Hendricks KM, Dong KR, Tang AM, et al. High-iber diet in HIV-positive
men is associated with lower risk of developing fat deposition. Am J
Clin Nutr. 2003;78(4):790-5.
27. Duran AC, Almeida LB, Segurado AA, Jaime PC. Diet quality of persons
living with HIV/AIDS on highly active antiretroviral therapy. J Hum
Nutr Diet. 2008;21(4):346-50.
28. Pereira GAP, Genaro PS, Pinheiro MM, Szejnfeld VL, Martini LA.
Cálcio dietético: estratégias para otimizar o consumo [Dietary
calcium: strategies to optimize intake]. Rev Bras Reumatol.
2009;49(2): 164-80.
29. Leite LH, Sampaio AB. Dietary calcium, dairy food intake and
metabolic abnormalities in HIV-infected individuals. J Hum Nutr Diet.
2010;23(5):535-43.
30. Dickinson BD, Havas S; Council on Science and Public Health,
American Medical Association. Reducing the population burden
of cardiovascular disease by reducing sodium intake: a report
of the Council on Science and Public Health. Arch Intern Med.
2007;167(14):1460-8.
31. Frassetto LA, Morris RC Jr, Sellmeyer DE, Sebastian A. Adverse efects
of sodium chloride on bone in the aging human population resulting
from habitual consumption of typical American diets. J Nutr.
2008;138(2):419S-422S.
32. Tsugane S, Sasazuki S. Diet and the risk of gastric cancer: review of
epidemiological evidence. Gastric Cancer.2007;10(2):75-83.
33. Sarno F, Claro RM, Levy RB, et al. Estimativa de consumo de sódio
pela população brasileira, 2002-2003 [Estimated sodium intake
by the Brazilian population, 2002-2003]. Rev Saude Publica.
ORIGINAL ARTICLE | Giudici KV, Duran ACFL, Jaime PC
34. Monteiro CA, Conde WL, Popkin BM. Income-speciic trends in
obesity in Brazil: 1975-2003. Am J Public Health. 2007;97(10):1808-12.
35. Instituto Brasileiro de Geograia e Estatística. Pesquisa de Orçamentos
Familiares 2008-2009. Antropometria e estado nutricional de
crianças, adolescentes e adultos no Brasil. Brasília: Instituto Brasileiro
de Geograia e Estatística; 2010. Available from: http://www.ibge.gov.
br/home/estatistica/populacao/condicaodevida/pof/2008_2009_
encaa/comentario.pdf. Accessed in 2012 (Aug 7).
36. Brasil. Ministério da Saúde. Secretaria de Vigilância em Saúde.
Secretaria de Gestão Estratégica e Participativa. Vigitel Brasil 2010:
vigilância de fatores de risco e proteção para doenças crônicas por
inquérito telefônico/Ministério da Saúde Secretaria de Vigilância
em Saúde. Secretaria de Gestão Estratégica e Participativa. Brasília:
Ministério da Saúde; 2011. Available from: http://portal.saude.gov.br/
portal/arquivos/pdf/vigitel_2010_preliminar_web.pdf. Accessed in
2012 (Aug 7).
37. Jaime PC, Florindo AA, Latorre MRDO, et al. Prevalência de
sobrepeso e obesidade abdominal em indíviduos portadores
de HIV/AIDS, em uso de terapia antiretroviral de alta potência
[Prevalence of overweight and central obesity in HIV/AIDS
patients treated with highly active antiretroviral therapy]. Rev Bras
Epidemiol.2004;7(1): 65-72.
38. Barreto SM, Pinheiro ARO, Sichieri R, et al. Análise da estratégia global
para alimentação, atividade física e saúde, da Organização Mundial
da Saúde [Analysis of the global strategy on diet, physical activity
and health of the World Health Organization]. Epidemiologia e
Serviços de Saúde. 2005;14(1):41-68. Available from: http://portal.
saude.gov.br/portal/arquivos/pdf/4artigo_analise_global.pdf.
Accessed in 2012 (Aug 7).
39. Guenther PM, Kott PS, Carriquiry AL. Development of an approach for
estimating usual nutrient intake distributions at the population level.
J Nutr. 1997;127(6):1106-12.
40. Monteiro CA, Moura EC, Jaime PC, Claro RM. Validade de indicadores
do consumo de alimentos e bebidas obtidos por inquérito telefônico.
[Validity of food and beverage intake data obtained by telephone
survey]. Rev Saude Publica. 2008;42(4):582-9.
41. Krauss RM, Eckel RH, Howard B, et al. Revision 2000: a statement
for healthcare professionals from the Nutrition Committee of the
American Heart Association. J Nutr. 2001;131(1):132-46.
Sources of funding: Giudici KV received a Junior Scientist’s Scholarship from the Brazilian National Council of Scientiic and Technological
Development (CNPq), protocol number 119817/2009-8, and Duran AC
received a Master’s Scholarship from the Research Support Foundation
of the State of São Paulo (FAPESP), protocol number 2006/05460-6
Conlict of interest: None
Date of irst submission: February 23, 2012
Last received: June 4, 2012
Accepted: September 4, 2012
Address for correspondence:
Kelly Virecoulon Giudici
Av. Dr. Arnaldo, 715
Cerqueira César — São Paulo (SP) — Brasil
CEP 01246-904
Tel. (+55 11) 3061-7866