○ ○ ○ ○ ○ ○ ○ ○ ○ ○ ○ ○ABSTRACT○ ○ ○ ○ ○ ○
Original A
rticle
○ ○ ○ ○ ○ ○ ○ ○ ○ ○ ○ ○ ○ ○ ○ ○ ○ ○ ○ ○ Introduction
Fetal growth may at any time during the gestational period be affected by several fac-tors that can cause significant or minimal losses to the fetus. Maternal or environmen-tal restrictive factors acting early in feenvironmen-tal life may damage the final cell population. On the other hand, any aggravating circumstance acting late in the gestational period may re-duce the final fetus size. Accordingly, these factors may cause diseases to either fetus or newborn and thus interfere with neonatal morbidity and mortality.1
There are several methods for evaluating intrauterine growth. The curves relating birth weight to gestational age are valuable tools and classify the newborns as small, appropriate or large for gestational age if below the 10th per-centile, between the 10th and 90th percentiles or above the 90th percentile of the distribu-tion, respectively. They also correlate neonatal morbidity and mortality.2 These intrauterine growth curves have undoubtedly been most valuable for identifying newborns at risk, thereby allowing better allocation of funds and optimization of appropriate resources1,2. These curves, however, are directly dependent on knowledge of the gestational age, which is sometimes difficult to obtain.3
Several newborn anthropometric relation-ships have also been associated with morbid-ity and mortalmorbid-ity, such as weight/length in-dex, ponderal inin-dex, body mass inin-dex, cephalic perimeter/thoracic perimeter, expected weight/actual weight and weight/placental weight, among others.4,5 These parameters could also be used for identifying newborns
at risk provided they are non-invasive and pre-cise and have low cost.
The relationship between weight and length as a means of nutritional evaluation is based on the fact that biologically there seems to be greater protection for length increases than for weight increase. In 1989, Kramer et al.6 verified that full term undernourished infants had weight losses of up to 31% but length de-creases of only 6%. As fat and muscle mass ac-cumulate up to the end of the gestational pe-riod, it can easily be understood that the rela-tionship between weight and length increases with gestational age.7 Therefore, the establish-ment of a curve that takes into account weight and length could translate any abnormalities in fetal growth, and this would be independ-ent of prior knowledge of the gestational age.
Thus, the purpose of the present study was to evaluate the usefulness of weight and length measurements taken at birth, to identify some perinatal diseases selected on the basis of their frequency and importance among a population of high socioeconomic level.
○ ○ ○ ○ ○ ○ ○ ○ ○ ○ ○ ○ ○ ○ ○ ○ ○ ○ ○ ○ Methods
Based on a newborn population consist-ing of 9,675 consecutive live births in the ma-ternity ward of Hospital Israelita Albert Ein-stein, São Paulo, Brazil, from 1995 to Janu-ary 1998, a retrospective study was conducted to evaluate these newborns’ weight and length data at birth. This hospital unit provides ma-ternal care for pregnant patients referred by private obstetricians who are not hospital employees but are duly authorized to use the hospital facilities.
• Gloria Maria Dall Colletto
relationship at birth to
predict neonatal diseases
Instituto de Ensino e Pesquisa, Hospital Israelita Albert Einstein,
São Paulo, Brazil
CONTEXT: Intrauterine growth curves are extremely useful for classifying newborn children and pre-dicting neonatal diseases. However, such curves rely on knowledge of the gestational age, which is not always easily obtained. Therefore, the study of other anthropometric measurements and their interrelationship is always desirable, in order to attain such objectives.
OBJECTIVE: To evaluate whether newborns’ birth weight and length can identify neonatal diseases, independent of knowledge of the gestational age. TYPE OF STUDY: Retrospective study.
SETTING: Institute of Teaching and Research of Hospi-tal Israelita Albert Einstein, São Paulo, Brazil. PARTICIPANTS: During the period from February
1995 to January 1998, 8,397 live newborns were studied in the hospital’s maternity ward. PROCEDURES: The weight and length of live newborns
were obtained at birth, thus allowing the analysis of weight-for-length adequacy, i.e. the distribution of birth weight for each class of birth lenght. These measurements were determined for the first 4,634 live newborns and the 10th and 90th percentiles were established. These parameters were applied to the next 3,763 consecutive newborns of the same popu-lation. The relationships between these variables and some neonatal diseases were investigated. The significance level adopted was p < 0.05. MAIN MEASUREMENTS: Birth weight and length,
weight-for-length adequacy (10th and 90th percen-tiles for weight distribution in each 1-cm length class), weight/length index (10th and 90th percen-tiles of newborn’s weight divided by the length) and frequent neonatal diseases in this population. RESULTS: There was a significant association of ad-equacy and index with the following affections: asphyxia, jaundice, hypoglycemia, hypo-magnesemia, congenital pneumonia, pulmonary hypertension and sepsis. Additionally, there was a relationship between the index and respiratory distress syndrome, transient tachypnea and per-sistent ductus arteriosus.
CONCLUSIONS: Weight-for-length adequacy and weight/length index alone, without the knowledge of gestational age, were able to identify newborns at risk for some selected neonatal diseases. KEY WORDS: Newborn. Weight. Crown-rump length.
The main characteristics of the mothers have already been described in a previous re-port.8 These women were an average of 31.1 years old, 61.1% were university graduates and 88.25% married, with an average of 2 previ-ous pregnancies and 10 prenatal consultations. They were representative of a high socioeco-nomic group.
Data was gathered from 9,675 children and two samples were designated: sample 1, composed of the first consecutive 5,000 newborns, and sample 2, including the re-maining 4,675 records. All twins and those newborns whose data on gestational age, sex, birth weight or length were lacking, and those presenting length damage due to congenital malformations, were excluded. Therefore, sample 1 consisted of 4,634 newborns and sample 2 was made up of 3,763 newborns.
Sample 1 was used for calculating and determining newborns’ weight-for-length ad-equacy parameters and weight/length index, with the respective 10th and 90th percentiles. Sample 2 was used for applying the above
pa-rameters and verifying any associations of length adequacy and weight-for-length index with some neonatal diseases se-lected by frequency or importance among the population sample. This approach was cho-sen in order to avoid methodological bias.
All information was taken from the data bank that was available in the neonatal unit at the time of the study. It was gathered from the information registered in perinatal records that was entered by the obstetric nursing team and/or neonatologist attending the delivery. The information was compiled using the EPI-Info 6.04 program.
The following data were studied: 1) ges-tational age, based on the mother’s obstetric history and calculated from the first day of her last normal period using Naegele’s rule, converting the number of days into full weeks. This approach was adopted because all the pregnant women had prenatal care and were able to inform about their menstrual history. 2) Weight, which was obtained soon after birth by using a digital electric balance for newborns
of capacity 10 kg and sensitivity of 5 grams; and length, using a wood anthropometric lin-ear ruler with one wedge fixed and one slid-ing caliper, recordslid-ing in centimeters to one decimal place.9 The staff neonatologist took this measurement within four to six hours of the birth. Lengths measured by different staff neonatologists were considered to be valid, be-cause of a previous test performed between these measurements and those taken by only one researcher (JRDL) which showed r = 0.94 (95% CI of 0.84-0.91)10. 3) Data related to neonatal diagnoses, which was based on clini-cal and laboratory criteria, as indicated by protocols adopted at the neonatal unit dur-ing the study period.
The weight-for-length relationship was established in two ways: weight-for-length adequacy and weight-for-length index, both calculated from sample 1 data.
For the purposes of adequacy calculations, the lengths were listed and grouped into 1-cm classes, thereby transforming this continu-ous variable into a discrete variable. For each
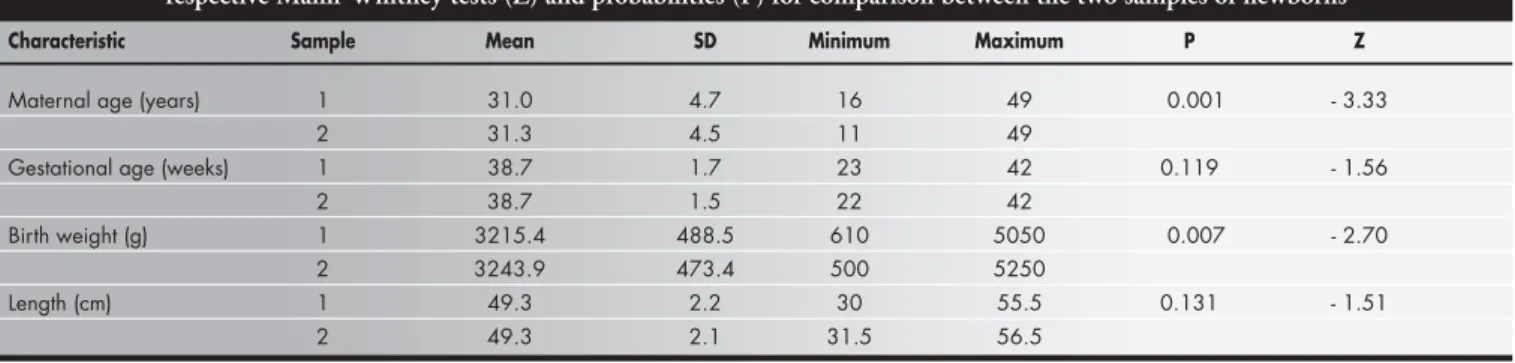
Table 1. Mean and standard deviation (SD) of the characteristics of samples 1 (n = 4,634) and 2 (n = 3,763) and their respective Mann-Whitney tests (Z) and probabilities (P) for comparison between the two samples of newborns
Characteristic Sample Mean SD Minimum Maximum P Z
Maternal age (years) 1 31.0 4.7 16 49 0.001 - 3.33 2 31.3 4.5 11 49
Gestational age (weeks) 1 38.7 1.7 23 42 0.119 - 1.56 2 38.7 1.5 22 42
Birth weight (g) 1 3215.4 488.5 610 5050 0.007 - 2.70 2 3243.9 473.4 500 5250
Length (cm) 1 49.3 2.2 30 55.5 0.131 - 1.51 2 49.3 2.1 31.5 56.5
Table 2. Values of the 10th and 90th percentiles of the birth weight-for-length distribution and their adjusted values in 4,634 newborns
Length (cm) 90th Percentile 10th Percentile 90th Percentile Adjusted 10th Percentile Adjusted
40 1,687 999 1,777 989
41 1,835 1,220 1,967 1,206
42 2,241 1,607 2,158 1,420
43 2,530 1,357 2,353 1,632
44 2,570 1,720 2,549 1,841
45 2,832 2,097 2,749 2,049
46 2,960 2,310 2,950 2,254
47 3,180 2,550 3,155 2,457
48 3,330 2,710 3,361 2,658
49 3,530 2,883 3,570 2,856
50 3,727 3,060 3,782 3,053
51 3,914 3,201 3,996 3,247
52 4,180 3,440 4,213 4,339
53 4,320 3,556 4,432 3,628
54 4,710 3,729 4,653 3,816
length class, the weight distribution was checked with the identification of the 10th and 90th percentiles. These two cutoff points, the 10th and 90th percentiles, gave rise to the fol-lowing newborn classification: “small for length” for newborns below the 10th percen-tile; “appropriate for length” for newborns between the 10th and 90th percentiles, inclu-sive; and “large for length” for newborns over the 90th percentile.
For the weight-for-length index calcula-tion, the quotient of each newborn’s weight divided by the length was used. This was done for all newborns in sample 1. The 10th and 90th percentiles were also calculated. The newborns were then classified as “small index-for-length”, “appropriate index-for-length” and “large index-for-length” according to their positioning below the 10th percentile, between the 10th and 90th percentiles (inclusive) and over the 90th percentile, respectively.
The newborns were also classified accord-ing to their gestational age (under or over 37 weeks, calculated according to Naegele’s rule) with regard to adequacy and index.
In sample 2, the associations between ad-equacy and weight-for-length index (considered as independent variables) and variables related to some neonatal diseases were studied. The most frequent and important diseases consid-ered were asphyxia (light, mild and severe, ac-cording to one-minute Apgar scores of 0-3, 4-6 and 7-10, respectively), physiological jaun-dice, respiratory distress syndrome (hyaline membrane disease of the newborn), transient tachypnea, congenital pneumonia, pulmonary hypertension, sepsis, hypoglycemia, hypo-magnesemia, congenital dislocation of the hip, persistent ductus arteriosus, pneumomediasti-num, pneumothorax and birth trauma. All of these were taken as dependent variables.
The statistical methodology considered arithmetical means, standard deviation and the minimum and maximum values used for de-scribing samples. The accumulated frequency was used for calculating weight-for-length per-centile distributions and index distributions. Linear regression and correlation coefficient and their significance were used for checking weight/length correlations. Samples were com-pared using the Mann-Whitney tests. All the aforementioned statistical tests were processed using the Statistical Package for Social Sciences (SPSS) V9.0 software (2000).
The present study was approved by the Research Ethics Committee of the Institution. Since all data were obtained from medical records, patients’ prior formal consent was not necessary.
Figure 1. Regression lines for weight/length distribution at birth for the 10th and 90th percentiles.
Figure 2. Histogram frequency of the weight/length (W/L) index.
○ ○ ○ ○ ○ ○ ○ ○ ○ ○ ○ ○ ○ ○ ○ ○ ○ ○ ○ ○ Results
Comparison between samples 1 and 2 according to the Mann-Whitney test showed that maternal age and newborn weight were significantly higher in sample 2 and that ges-tational age and newborn length were similar in the two samples, as can be seen in Table 1.
Table 2 shows the 10th and 90th percen-tiles of the weight distribution for each length in sample 1 and their adjusted values. The best-fit values for adjusting these data were obtained by quadratic regression analysis, rep-resented by the equations below:
Figure 3. Neonatal disease frequency and weight-for-length adequacy.
○ ○ ○ ○ ○ ○ ○ ○ ○ ○ ○ ○ ○ ○ ○ ○ ○ ○ ○ ○ Discussion
The evaluation of newborns according to weight and length parameters is usually ac-complished by using the ponderal index or body mass index.11 The simple relationship between weight and length has been used for comparing growth among children over a cer-tain period of time4,12 but it is not usually used for investigating the association with neonatal diseases. For this reason, the present paper deals with this matter.
The newborn weight and length data taken from our population of high socio-economic level were subjected to various methods of analysis. It was noted that weight and length variables were positively and almost linearly correlated, thereby al-lowing the establishment of the weight-for-length adequacy and its 10th and 90th per-centiles and thus identifying newborns as “small-for-length”, “appropriate-for-length” and “large-for-length”.
The 10th and 90th percentiles were also calculated with regard to the weight-for-length index, thereby allowing newborns below the 10th percentile to be classified as having “small index-for-length”, those between the 10th and 90th percentiles (inclusive) as “appropriate in-dex-for-length” and those above the 90th per-centile as “large index-for-length”.
The relationship between gestational age and weight-for-length adequacy showed no differences in relation to preterm newborns in the three adequacy categories (small, ap-propriate and large for length). Conversely, there was a significant difference between the preterm newborn frequency in the three in-dex categories, with the highest frequency noted for “small index-for-length” and the lowest for “large index-for-length”. This dif-ference in behavior can be explained on the basis of how these parameters were designed. The weight-for-length adequacy classification subdivided the sample into three categories: small, appropriate and large for each length class. Length increases as gestational age in-creases,5 but for each length there was a weight stratification in the sample. Since length is correlated with gestational age, it can be seen that there was an indirect correlation with the interference of the gestational age.
There was a higher preterm frequency for “small index-for-length” than for the “appro-priate” and “large” categories. Since fatty de-posits and muscle mass increase as pregnancy progresses,7 the weight/length quotient is lower for preterm than for full term infants. This suggests not only that undernourished Figure 1 depicts the adjusted data for
weight and length and Figure 2 shows the graphical representation of the index distri-bution with the values of the 10th, 50th and 90th percentiles for that distribution. Consid-ering all the newborns, 10% had a weight-for-length of less than 56.33 and 10% had more than 74.20.
Among the newborns classified by the weight-for-length index, the preterm propor-tions were 43.2, 3.1 and 0.9% for small, ap-propriate and large index-for-length catego-ries, respectively. However, for newborns clas-sified by adequacy, the proportions of preterm infants were 13.1, 6.6 and 3.1%, for the small, appropriate and large-for-length categories, respectively.
Figure 3 shows that, of all the diseases studied in sample 2, severe asphyxia (but not all of the grades of this disease), hypoglycemia, hypomagnesemia, physiological jaundice,
pulmonary hypertension, respiratory distress syndrome, congenital pneumonia and septi-cemia were shown to be associated with ad-equacy (p < 0.05). The most frequent diseases among the “small for length” infants were physiological jaundice, hypoglycemia and se-vere asphyxia, as can be seen in Figure 3.
full term newborns will be found in the “small index-for-length” category, but also preterm newborns that are not necessarily undernour-ished. Within the “large index-for-length” cat-egory there were more full term newborns and fewer preterm newborns. In evaluating the Kramer et al.13 paper on restriction of intrau-terine growth, it was possible to calculate from their data how many infants in the “small in-dex-for-length” category the authors would have had. It was seen that newborns consid-ered to be undernourished would also be clas-sified as such by the weight-for-length index established in the present study.
Sample 2 was described according to the same characteristics as sample 1. Over the whole study period, no changes took place in the Institution that could have interfered in the composition of the population attended. However, the two populations differed in terms of maternal age and newborn weight. Concerning maternal age, Duccini dal Colletto et al.14 demonstrated a rising trend from 1995 to 1998 when studying data from the same hospital.
When analyzing associations between dis-eases and the two methods of correlating weight to length, it was taken into account that adequacy evaluates body proportions without being influenced by gestational age, whereas the index is influenced by gestational age. It was thus noted that some diseases cor-related via both methods, some only to the weight-for-length index and others did not correlate to either of the methods.
Thus, severe asphyxia, hypoglycemia, physiological jaundice, pulmonary hyperten-sion, congenital pneumonia and sepsis showed a similar tendency to be more frequent within the “small weight-for-length” category. In all of these diseases, their association with intrau-terine restriction can explain this relationship. In 1990, Villar et al.15 found a relationship between ponderal index below the 10th per-centile and severe asphyxia, meconium aspi-ration syndrome, hypoglycemia and infection. In calculating a weight-for-length index based on the data gathered by these authors, it was found that the same relationship would be found for the weight-for-length index below the 10th percentile.
With regard to respiratory distress syndrome, different levels of asphyxia, persistent ductus ar-teriosus and transient tachypnea, the association was noted only for the index and the greatest incidence was noted among the “small index-for-length” newborns. Therefore, one can specu-late that prematurity was significantly important in the genesis of these diseases. The “small
in-dex-for-length” category represented not only the undernourished full term newborns but also the preterm newborns and probably all those of very low birth weight, where almost all disease oc-currences are concentrated.16 In 1997, Williams and O’Brien,1 concluded that below the 10th percentile the simple weight for length correla-tion was associated not only with perinatal de-pression, in accordance with the data of this study, but also with dysmaturity, cerebral palsy and higher mortality.
Hypomagnesemia has been shown to be associated both with adequacy and index, with higher incidence occurring within the “large-for-length” and “large index-“large-for-length” cat-egories. Among our samples, there was prob-ably no occurrence in preterm newborns due to preventive measures routinely taken in the neonatal unit, with early administration of calcium and magnesium via the hydration se-rum given to these children.
Birth trauma, congenital dislocation of the hip and pneumothorax did not show an asso-ciation with either adequacy or index.
○ ○ ○ ○ ○ ○ ○ ○ ○ ○ ○ ○ ○ ○ ○ ○ ○ ○ ○ ○ Conclusions
The almost linear correlation between weight and length allowed the construction of a curve considering only the two param-eters of weight and length, as well as the iden-tification of the 10th and 90th percentiles, in-dependent of knowledge of the gestational age. The classification of newborns into small, appropriate and large for length, or into small, appropriate or large index-for-length, allowed the identification of children at risk for some neonatal diseases. It is not necessary to know the gestational age for either classification and they are independent of each other. The same newborns may therefore be identified with regard to their risk for diseases either by
Relação entre peso e comprimento ao nascimento para predizer afecções neonatais
CONTEXTO: As curvas de crescimento intra-uterino têm sido extremamente úteis para a classificação de recém-nascido, bem como para predizer doenças neonatais. Contudo, dependem do conhecimento da idade gestacional, que nem sempre é facilmente obtida. Assim, o estudo de outras medidas antropométricas, e suas inter-relações, tem sido proposto para as mesmas finalidades.
OBJETIVO: Estabelecer a utilidade das medidas de peso e comprimento ao nascer na identificação de algumas doenças, inde-pendentemente do conhecimento da idade gestacional.
TIPO DE ESTUDO: Estudo retrospectivo.
LOCAL: Instituto de Ensino e Pesquisa Albert Einstein, São Paulo, Brasil.
PARTICIPANTES: Foram estudados 8.397 nascidos vivos na maternidade do Hospital Israelita Albert Einstein, no período com-preendido entre fevereiro de 1995 e janeiro de 1998.
PROCEDIMENTOS: Peso e comprimento dos recém-nascidos, obtidos ao nascimento, permitiram o estudo da adequação do peso por classes do comprimento e o índice peso/ comprimento. Foram calculados os percentis
○ ○ ○ ○ ○ ○ ○ ○ ○ ○ ○ ○ ○ ○ ○ ○ ○ ○ ○ ○ ○ ○ ○ ○ ○ ○ ○ ○ ○ ○ ○ ○ ○ ○ ○ ○ ○ ○ ○ ○ ○ ○ RESUMO
José Ricardo Dias Bertagnon, MD. School of Medi-cine, Universidade de Santo Amaro, São Paulo, Brazil. Conceição Aparecida de Mattos Segre, PhD. Instituto
de Ensino e Pesquisa, Hospital Israelita Albert Einstein, São Paulo, Brazil.
Gloria Maria Dall Colletto, PhD. Institutode Ciências BiológicasInstituto, Universidade de São Paulo, Brazil.
Sources of funding: None Conflict of interest: None
Date of first submission: October 7, 2002 Last received: February 27, 2003 Accepted: May 19, 2003
Address for correspondence: José Ricardo Dias Bertagnon
R. Francisco Romeiro Sobrinho, 222 São Paulo/SP — Brasil — CEP 04710-18 Tel. (+55 11) 5181-5330
Fax (+55 11) 5084-2420 E-mail: [email protected]
COPYRIGHT © 2003, Associação Paulista de Medicina ○ ○ Publishing information○ ○ ○ ○ ○ ○ ○ ○ ○ ○ ○ ○ ○ ○ ○ ○ ○ ○
10 e 90. Os parâmetros obtidos entre os primeiros 4.634 recém-nascidos foram aplicados aos sucessivos 3.763 nascidos vivos. Os recém-nascidos foram classificados em pequenos, adequados ou grandes, conforme estivessem abaixo, entre ou acima dos percentis 10 e 90. Foram pesquisadas associações dessas variáveis com algumas afecções neonatais, pelo teste do qui quadrado (p < 0,05).
VARIÁVEIS ESTUDADAS: Peso e comprimento ao nascimento, adequação do peso por classes do comprimento, índice peso/comprimento, e afecções neonatais mais freqüentes nessa população.
RESULTADOS: A adequação e índice mostra-ram-se significativamente associados às seguintes afecções: asfixia, icterícia, huipo-glicemia, hipomagnesemia, pneumonia congênita, hipertensão pulmonar e sepse. O índice ainda se relacionou à síndrome do desconforto respiratório, taquipnéia transi-tória e persistência do canal arterial.
CONCLUSÕES: As medidas de peso e com-primento ao nascer são facilmente obtidas e podem discriminar recém-nascidos de risco para algumas das principais morbidades neonatais, independentemente do conhe-cimento da idade gestacional.
PALAVRAS-CHAVE: Recém-nascido. Peso. Comprimento. Índice de massa corporal. 1. Williams MC, O’Brien WF. A comparison of birth weight and
weight/length ratio for gestation as correlates of perinatal mor-bidity. J Perinatol 1997;17(5):346-50.
2. Lubchenco LO. The high-risk infant. Philadelphia: WB
Saunders; 1976.
3. Sparks JW. Intrauterine growth and nutrition. In: Polin RA, Fox WW, eds. Fetal and neonatal physiology. 2nd ed. Philadel-phia: WB Saunders; 1998.p.267-89.
4. Leung SS, Lau JT, Tse LY, Oppenheimer SJ. Weight-for-age
and weight-for-height references for Hong Kong children from birth to 18 years. J Paediatr Child Health 1996;32(2):103-9. 5. Cole TJ, Henson GL, Tremble JM, Colley NV. Birthweight for
length: ponderal index, body mass index or Benn index? Ann Hum Biol 1997;24 (4):289-98.
6. Kramer MS, McLean FH, Olivier M, Willis DM, Usher RH. Body proportionality and head and length ‘sparing’ in growth retarded neonates: a critical reappraisal. Pediatrics 1989;84(4):717-23.
○ ○ ○ ○ ○ ○ ○ ○ ○ ○ ○ ○ ○ ○ ○ ○ ○ ○ ○ ○ ○ ○ ○ ○ ○ ○ ○ ○ ○ ○ ○ ○ ○ ○ ○ ○ ○ ○ ○ ○ ○ ○ ○ ○ ○ ○ ○ ○ ○ ○ ○ ○ ○ ○ ○ ○ ○ ○ ○ ○ ○ ○ ○ ○ REFERENCES
7. Rosso P, Kava R. Effects of food restriction on cardiac output and blood flow to the uterus and placenta in the pregnant rat. J Nutr 1980;110(12):2350-4.
8. Segre CAM, Colletto GMDD, Bertagnon JRD. Intrauterine
growth curves of a high-income population. Acta Med Auxol 2001;33(3):151-7.
9. Segre CAM. Procedimentos técnicos. In: Segre CAM.
Perinatologia. Fundamentos e prática. São Paulo: Sarvier; 2002. p.802-6.
10. Bertagnon JRD. Relações entre peso e comprimento ao nascer para prognosticar afecções neonatais. [Relationship between birth weight and height to predict neonatal diseases]. [thesis]. São Paulo: Instituto de Assistência Médica do Servidor Público Estadual de São Paulo; 2002.
11. Dombrowski MP, Berry SM, Johnson MP, Saleh AA, Sokol RJ. Birth weight-length ratios, ponderal indexes, placental weights, and birth weight-placenta ratios in a large population. Arch
Pediatr Adolesc Med 1994;148(5):508-12.
12. Gardosi J. Customized growth curves. Clin Obstet Gynecol 1997;40(4):715-22.
13. Kramer MS, Olivier M, McLean FH, Willis DM, Usher RH. Impact of intrauterine growth retardation and body propor-tionality on fetal and neonatal outcome. Pediatrics 1990;86(5):707-13.
14. Duccini dal Colletto GMDD, de Mattos Segre CAM, Beiguelman B. Twinning rate in a sample from a Brazilian hos-pital with a high standard of reproductive care. São Paulo Med J 2001;119 (6):216-9.
15. Villar J, deOnis M, Kestler E, Bolanos F, Cerezo R, Bernedes H. The differential neonatal morbidity of intrauterine growth retar-dation syndrome. Am J Obstet Gynecol 1990;163 (1 Pt 1):151-7. 16. Segre CAM. Recém-nascido pré-termo. In: Segre CAM. Perinatologia. Fundamentos e prática. São Paulo: Sarvier; 2002. p.232-51.
equacy or the weight-for-length index.
○ ○ ○ ○ ○ ○ ○ ○ ○ ○ ○ ○ ○ ○ ○ ○ ○ ○ ○ ○ Final remarks
Adequacy represents factors related to cer-tain neonatal diseases and one can speculate that adequacy could possibly help in clarify-ing their pathophysiological origins. The
weight-for-length index represents factors as-sociated not only with intrauterine growth restriction but also with prematurity. As the weight-for-length index proved to be more discriminating, its application would therefore seem to be more useful.
Although the results presented here may contribute towards identifying some diseases