Bone mineral density and body composition in adolescents
with failure to thrive
Densidade mineral óssea e composição corporal em adolescentes com déficit de crescimento
Thiago Sacchetto de Andrade1, Luiz Anderson Lopes2, Marcelo de Medeiros Pinheiro3, Vera Lucia Szejnfeld4,
José Augusto de Aguiar Carrazedo Taddei5
ABSTRACT
Objective: To evaluate bone mineral mass in adolescents with failure to thrive in relation to body composition. Methods: A case-control study involving 126 adolescents (15 to 19 years), in final puberty maturation being 76 eutrophic and 50 with failure to thrive (genetic or constitutional delay of growth), of matching ages, gender and pubertal maturation. The weight, height and calculated Z score for height/age and body mass index; bone mineral content, bone mineral density and adjusted bone mineral density were established for total body, lower back and femur; total fat-free mass and height-adjusted fat-free mass index, total fat mass and height-height-adjusted. The statistical analyses were performed using the Student’s t-test (weight, height and body composition); Mann-Whitney test (bone mass) and multiple linear regression (bone mass determinants). Results: weight, height and height/age Z-score were significantly higher among eutrophic subjects. Both groups did not show statistically significant differences for fat mass, percentage of fat mass, total fat mass height adjusted and fat-free mass index height sadjusted. However, total free fat maass was smaller for the failure to thrive group. Conclusions: There was no statistically significant difference for bone mass measurements among adolescents with failure to thrive; however, the factors that determine bone mass formation should be better studied due to the positive correlation with free fat mass detected in these individuals.
Keywords: Bone density; Body composition; Adolescent; Growth disorders
RESUMO
Objetivos: Avaliar a massa mineral óssea de adolescentes com déficit de crescimento, correlacionando-a com alguns aspectos de sua
composição corporal. Métodos: Estudo caso-controle envolvendo 126 adolescentes (15 a 19 anos de idade), nos estádios finais da puberdade sendo 76 eutróficos e 50 com déficit de crescimento, familiar ou atraso constitucional do crescimento, pareados segundo a idade, o gênero e o grau de estadiamento puberal. Foram medidos o peso, a estatura e calculados escore Z de estatura/idade e o índice de massa corpórea; foram determinados o conteúdo mineral ósseo, a densidade mineral óssea e a densidade mineral óssea ajustada do corpo total, coluna lombar e fêmur; massa magra total e corrigida para a estatura, massa gorda total e corrigida para a estatura. Utilizaram-se os testes t de Student (peso, estatura e composição corporal) e de Mann-Whitney (massa óssea), e a regressão linear múltipla (determinantes da massa óssea). Resultados: O peso, a estatura e o Z-estatura/idade foram significativamente maiores entre os eutróficos. Os dois grupos não apresentaram diferença significativa para a massa gorda, percentagem de massa gorda, massa magra total corrigida para estatura e massa gorda total corrigida para estatura. Contudo, a massa magra foi menor para o grupo dom déficit de crescimento. Conclusões: Não foi encontrada diferença significativa entre as medidas de massa óssea de adolescentes com déficit de crescimento, contudo os fatores determinantes da formação da massa óssea devem ser mais bem estudados devido à correlação positiva com massa magra total detectada entre estes indivíduos com déficit de crescimento.
Descritores: Densidade óssea; Composição corporal; Adolescente; Transtornos do crescimento
INTRODUCTION
Knowledge about the biology of bone tissue and of the human skeleton building process has enabled
Study carried out at Nutrology sector, of Departament of Pediatrics, of Universidade Federal de São Paulo – UNIFESP, São Paulo (SP), Brazil
1 Master’s degree student in Health Sciences, Nutrology Sector of Department of Pediatrics at Universidade Federal de São Paulo – UNIFESP, São Paulo (SP), Brazil.
2 PhD; Visiting professor at Universidade Federal de São Paulo – UNIFESP, São Paulo (SP), Brazil; Full professor at Universidade de Santo Amaro – UNISA, São Paulo (SP), Brazil.
3 PhD; Associate professor at the Universidade Federal de São Paulo – UNIFESP, São Paulo (SP), Brazil; Head of the Osteoporosis Outpatients Clinic, Rheumatology Sector, Department of Internal Medicine at Universidade Federal de São Paulo – UNIFESP, São Paulo (SP), Brazil.
4 PhD; Adjunct professor of Rheumatology Sector of Department of Internal Medicine at Universidade Federal de Medicina – UNIFESP, São Paulo (SP), Brazil.
5 Post-doctorate degree; Adjunct professor of Nutrology Sector of Department of Pediatrics at Universidade Federal São Paulo – UNIFESP, São Paulo (SP), Brazil.
Corresponding author: Luiz Anderson Lopes – Rua Loefgreen, 1647 – Vila Clementino – CEP 04040-032 – São Paulo (SP), Brasil – Tel.: (11) 5539 1783 – e-mail: [email protected]
identification of risk factors at different age groups. When corrected, these factors can imply lower likelihood of some diseases, such as osteoporosis
and osteopenia in adulthood(1). Of special interest
are those associated with the growth process which, when implying less gains detected by means of anthropometry (failure to thrive), could be associated to reduced bone mass formation, bone resistance and, consequently, greater susceptibility to bone fractures at older ages.
During childhood and adolescence, both bone deposition and bone mass formation exceed resorption, leading to increased bone mineral content (BMC) and bone mineral density (BMD) in phases that coincide with accelerated weight and height growth. It is during the final stages of puberty (11 to 14 years for girls and 13 to 17 for boys) and adulthood that greater bone mass formation is observed, characterizing the so-called
“peak bone mass”(2).
Approximately 60 to 80% of variation in bone mass quantity – for growth and bone formation – is
caused by genetic(3), environmental, nutritional (low
ingestion of nutrients and inadequate weight for age) and behavioral (physical activities, alcoholism and smoking) factors that can modulate the expression of this genetic potential, associated or not with a disease(3-10).
The prevalence of failure to thrive in children younger than 5 years old has progressively declined in developing countries in the past 20 years (from 47% in 1980 to 33% in 2000; and 29% in 2005 – approximately
181.9 million children)(11)
.
Today, a secular trend in growth of individuals is observed, reaching heights that are, in average, taller than those of previous generations. This phenomenon may not occur in certain situations/countries because of lack of basic health resources for the population, and this deprivation may impair the expression of the genetic growth potential and imply a longer
maturation time(12) and failure to thrive; coincidently,
these same factors can be implicated in lower bone formation.
The importance of bone size (calcium reserve) and its likely interaction with disorders related to less bone mass has been studied, as well as the correlation of some body composition factors such as lean mass and\ or fat mass in the bone formation process, especially
in situations like obesity and malnutrition(13).
OBJECTIVE
To evaluate bone mineral mass in adolescents with failure to thrive, correlating it with some aspects of their body composition.
METHODS
This case-control study was part of the ECCHOS project (Clinical Studies on Growth, Blood Pressure, Obesity and Oral Health), performed in the city of São Paulo (SP), Brazil, from June to December 2002.
For the selection of cases and controls, a team made up of nutritionists and pediatricians was trained and evaluated 1,420 individuals of both genders aging between 15 and 19 years and enrolled in the same high school in the city of São Paulo, who agreed to voluntarily participate and, together with their parents/guardians, signed a consent form.
Weight (W) was assessed by means of an
adult-type digital scale (Kratos) of 50-gram accuracy.
Height (H) was measured with the portable
stadiometer (Alturexata®), with a scale in millimeters
(mm). Both procedures were carried out according to
international standards(14) and the results were used
to calculate the Z score for height adjusted for age and gender (H/A) and the Body Mass Index (BMI); both indicators were analyzed according to references from the Centers for Disease Control and Prevention
(CDC, 2000)(15-16).
In accordance with the anthropometric data obtained, we selected 126 individuals of both genders who were in final stages of puberty [W > IV and F > IV (boys) W > IV and L > IV (girls)] according to their height and weight ratio (BMI). Among these, 76 individuals (39 males) were classified as eutrophic
(-1.5 Z ≥ H/A ≤ +1.5 Z and the BMI was between 5th
and 85th percentiles) and 50 individuals (20 males)
had failure to thrive of genetic origin or constitutional
growth delay (-3.0 Z ≥ H/A ≤ -1.5 Z and BMI between
the 5th and 85th percentiles)(15-16). The Control Group
matched the study group in age, gender and degree of pubertal staging.
All individuals selected were referred to the Care Unit of the Nutrology Course, Department of Pediatrics, Universidade Federal de São Paulo (UNIFESP-EPM), where data regarding weight, height and pubertal staging were confirmed during pediatric consultation. The bone densitometry test was scheduled and performed in the Rheumatology Outpatients Clinic UNIFESP.
Bone Densitometry (DXA)
The procedures to analyze bone mineral density (BMD) and body composition (bone densitometry - DXA) were performed through the same device
(LUNAR DPX-L, software for pediatric tests –
version 1.5) by the same trained technician. The values regarding bone mass (bone mineral content – BMC
bone mineral adjusted density (BMAD) and total body bone area, lumbar spine (L2L4), and total femur were obtained from all adolescents. The BMAD was calculated based on the equation BMAD = BMD x
[4/(π x width)](17). The body composition data studied
were: total lean mass, fat mass percentage and total fat mass; in addition to the relations between total fat-free mass and height (skeletal lean mass index) and total fat mass and height (skeletal fat mass index)(18).
The data collected was encoded and typed by two
different typists into the Epi-Info 6.0 software(19); the
two sets of data generated were then compared using the “Validate” subroutine of this same software, aiming to correct eventual typing errors.
Statistical analysis
The data was presented as mean ± standard deviation
and confidence intervals. The distribution of variables of interest was assessed and tested as to its normality. The Student’s t-test was used to assess the difference between the anthropometry data and body composition variables between the groups. The bone mass measures (DXA) were compared by means of the Mann-Whitney test in function of their distribution (not normal). Multiple linear regressions were used to analyze the determining factors of bone mass for the entire group. All statistical models used had the bone mass as dependent variable. As for independent variables, we used gender, anthropometry (W, H, BW, BH) and the body composition values. The choice of parameters included in the regression model was based on multiple analysis. The multiple regression analysis was carried out exclusively for the BMC and BMD for the entire body and the lumbar spine, and BMD of the femur, according to gender. The results were shown by means of the correlation coefficient, p
values and adjusted R2. As significant, the values of p
< 0.05 and 95% were established. The entire statistical
analysis was developed based on the Stata 9.0 (Stata Corporation, College Station, TX) statistical software
package(20).
RESULTS
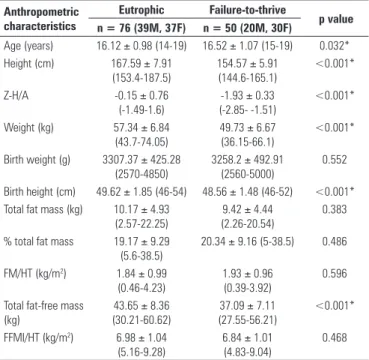
This study involved 126 individuals who were broken down into two groups. The Control Group was made up of 76 eutrophic individuals (39 boys) and the Failure-to-thrive Group (study group) comprised 50 individuals (20 boys). As expected, the variables W, H and the Z-score of height for age (Z-H/A), height at birth and lean mass (FFM) of the eutrophic students were significantly higher (Table 1).
When divided by gender, the results described for the male adolescents showed statistically significant differences for W, H and Z-H/A, birth weight (BW), birth height (BH), and total lean mass (FFM). Concerning fat mass (FM), fat mass percentage (%FM), skeletal lean mass index (SLMI) and skeletal fat mass index (SFMI), there were no statistically significant differences between the groups. Nonetheless, a lower total FFM was observed in the group with failure to thrive (Table 2).
Table 1. Anthropometric characteristics of eutrophic and failure-to-thrive adolescents, sample size (n) and statistical results: mean ± SD (95%CI)
Anthropometric characteristics
Eutrophic Failure-to-thrive
p value n = 76 (39M, 37F) n = 50 (20M, 30F)
Age (years) 16.12 ± 0.98 (14-19) 16.52 ± 1.07 (15-19) 0.032*
Height (cm) 167.59 ± 7.91
(153.4-187.5)
154.57 ± 5.91 (144.6-165.1)
<0.001*
Z-H/A -0.15 ± 0.76
(-1.49-1.6)
-1.93 ± 0.33 (-2.85- -1.51)
<0.001*
Weight (kg) 57.34 ± 6.84
(43.7-74.05)
49.73 ± 6.67 (36.15-66.1)
<0.001*
Birth weight (g) 3307.37 ± 425.28 (2570-4850)
3258.2 ± 492.91 (2560-5000)
0.552
Birth height (cm) 49.62 ± 1.85 (46-54) 48.56 ± 1.48 (46-52) <0.001* Total fat mass (kg) 10.17 ± 4.93
(2.57-22.25)
9.42 ± 4.44 (2.26-20.54)
0.383
% total fat mass 19.17 ± 9.29 (5.6-38.5)
20.34 ± 9.16 (5-38.5) 0.486
FM/HT (kg/m2) 1.84 ± 0.99
(0.46-4.23)
1.93 ± 0.96 (0.39-3.92)
0.596
Total fat-free mass (kg)
43.65 ± 8.36 (30.21-60.62)
37.09 ± 7.11 (27.55-56.21)
<0.001*
FFMI/HT (kg/m2) 6.98 ± 1.04
(5.16-9.28)
6.84 ± 1.01 (4.83-9.04)
0.468
Values expressed in mean ± SD (minimum - maximum: range);
M: male; F: female; FFMI/HT: skeletal lean mass index; FM/HT: skeletal fat mass index. *Significant difference and p < 0.05 (Student’s t-test);
Table 2. Anthropometric characteristics of male eutrophic and failure-to-thrive adolescents, sample size (n) and statistical results: mean ± SD (95%CI)
Anthropometric characteristics
Eutrophic Failure-to-thrive
p value n = 39 n = 20
Age (years) 16.20 ± 0.95 (15-19) 16.95 ± 1.19 (15-19) 0.012*
Height (cm) 173.35 ± 5.89
(164-187.5)
161.07 ± 2.52 (157-165.1)
<0.001*
Z-H/A -0.12 ± 0.81
(-1.49-1.6)
-1.92 ± 0.24 (-2.26- -1.54)
<0.001*
Weight (kg) 61.13 ± 5.81
(47.55-74.05)
54.11 ± 6.25 (44.5-66.1)
<0.001*
Birth weight (g) 3454.61 ± 491.33 (2570-4850)
3166.5 ± 549.13 (2650-5000)
0.045*
Birth height (cm) 50.31 ± 1.68 (47-54) 49.1 ± 1.28 (46.5-51) 0.007* Total fat mass (kg) 7.05 ± 3.31 (2.57-13.68) 6.07 ± 3.37 (2.26-12.29) 0.289 % Total fat mass 12.02 ± 5.13 (5.6-23.5) 11.59 ± 5.88 (5-24.6) 0.777 FM/HT (kg/m2) ±
SD (95%CI)
1.14 ± 0.56 (0.46-2.47)
1.07 ± 0.63 (0.39-2.56)
0.683
Total fat-free mass (kg)
50.67 ± 4.89 (41.76-60.62)
44.77 ± 4.46 (37.56-56.21)
<0.001*
FFMI/HT (kg/m2) 7.74 ± 0.74 (6.31-9.28) 7.80 ± 0.74 (6.50-9.04) 0.747
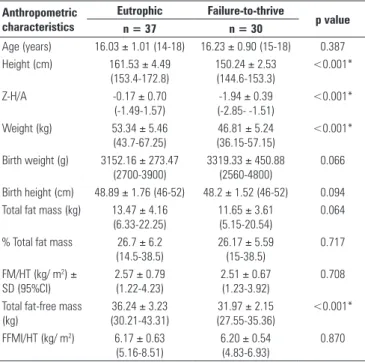
Similar results were found for female adolescents, except for the variables BW and BH, which were not statistically significant (Table 3).
Similar results are described for the same variables when split by gender, except for the BMAD variables (Tables 5 and 6).
Table 3. Anthropometric characteristics of female eutrophic and failure-to-thrive adolescents, sample size (n) and statistical results: mean ± SD (95%CI)
Anthropometric characteristics
Eutrophic Failure-to-thrive
p value n = 37 n = 30
Age (years) 16.03 ± 1.01 (14-18) 16.23 ± 0.90 (15-18) 0.387
Height (cm) 161.53 ± 4.49
(153.4-172.8)
150.24 ± 2.53 (144.6-153.3)
<0.001*
Z-H/A -0.17 ± 0.70
(-1.49-1.57)
-1.94 ± 0.39 (-2.85- -1.51)
<0.001*
Weight (kg) 53.34 ± 5.46
(43.7-67.25)
46.81 ± 5.24 (36.15-57.15)
<0.001*
Birth weight (g) 3152.16 ± 273.47 (2700-3900)
3319.33 ± 450.88 (2560-4800)
0.066
Birth height (cm) 48.89 ± 1.76 (46-52) 48.2 ± 1.52 (46-52) 0.094 Total fat mass (kg) 13.47 ± 4.16
(6.33-22.25)
11.65 ± 3.61 (5.15-20.54)
0.064
% Total fat mass 26.7 ± 6.2
(14.5-38.5)
26.17 ± 5.59 (15-38.5)
0.717
FM/HT (kg/ m2) ±
SD (95%CI)
2.57 ± 0.79 (1.22-4.23)
2.51 ± 0.67 (1.23-3.92)
0.708
Total fat-free mass (kg)
36.24 ± 3.23 (30.21-43.31)
31.97 ± 2.15 (27.55-35.36)
<0.001*
FFMI/HT (kg/ m2) 6.17 ± 0.63
(5.16-8.51)
6.20 ± 0.54 (4.83-6.93)
0.870
Values expressed in mean ± SD (minimum - maximum: range); FFMI/HT: skeletal lean mass index; FM/HT: skeletal fat mass index. *Significant difference and p < 0.05 (Student’s t-test);
On Table 4, the total body and lumbar spine (L2-L4) BMC, as well as bone area and lumbar spine BMAD, were significantly higher among eutrophic students.
Table 4. Bone mineral density (DXA) of eutrophic and failure-to-thrive individuals, per body region. Sample size (n) and statistical results: mean ± SD (95%CI)
Bone mineral density
Eutrophic Failure-to-thrive p value n = 76 (39M, 37F) n = 50 (20M, 30F)
Total body
BMC (g) 2445.64 ± 417.32
(1697-3406)
2120.22 ± 333.33 (1583-3129)
<0.001*
BMD (g/cm2) 1.12 ± 0.08
(0.94-1.36)
1.11 ± 0.67 (0.97-1.29)
0.637
Spine (L2L4) Bone area (cm2)
41.41 ± 4.83 (29.46-52.62)
36.42 ± 4.35 (28.86-47.13)
<0.001*
BMC (g) 47.41 ± 8.59
(28.87-68.2)
41.30 ± 7.79 (26.96-65.34)
<0.001*
BMAD (g/cm3) 0.36 ± 0.04
(0.27-0.44)
0.38 ± 0.04 (0.28-0.5) 0.009*
BMD (g/cm2) 1.14 ± 0.12
(0.88-1.49)
1.13 ± 0.12 (0.91-1.41)
0.643
Femur
BMD (g/cm2) 1.07 ± 0.15
(0.78-1.42)
1.06 ± 0.13 (0.82-1.38)
0.990
Values expressed in mean ± SD (minimum - maximum: range);
M: male; F: female; BMC: bone mineral content; BMD: bone mineral density; BMAD: bone mineral adjusted density.
*Significant difference and p < 0.05 (Mann-Whitney test)
Table 5. Bone mineral density (DXA) of male eutrophic and failure-to-thrive individuals, per body region. Sample size (n) and statistical results: mean; ± SD (95%CI)
Boné mineral density
Eutrophic Failure-to-thrive
p value
n= 39 n = 20
Body Total
BMC (g) 2729.31 ± 357.78
(2037-3406)
2399.9 ± 290.25 (1957-3129)
<0.001*
BMD (g/cm2) 1.15 ± 0.09
(0.97-1.36)
1.13 ± 0.07 (1.01-1.29)
0.471
Spine (L2L4) Bone area (cm2)
44.74 ± 3.83 (34.74-52.62)
40.49 ± 3.29 (32.97-47.13)
<0.001*
BMC (g) 51.69 ± 8.76
(35.62-68.2)
46.48 ± 8.49 (35.79-65.34)
0.044*
BMAD (g/cm3) 0.34 ± 0.03
(0.27-0.44)
0.36 ± 0.04 (0.28-0.44)
0.078
BMD (g/cm2) 1.15 ± 0.14
(0.88-1.49)
1.14 ± 0.14 (0.95-1.41)
0.737
Femur
BMD (g/cm2) 1.14 ± 0.15
(0.85-1.42)
1.14 ± 0.13 (0.92-1.38)
0.962
Values expressed in mean ± SD (minimum - maximum: range);
BMC: bone mineral content; BMD: bone mineral density; BMAD: bone mineral adjusted density. *Significant difference and p < 0.05 (Mann-Whitney test).
Table 6. Bone mineral density (DXA) of female eutrophic and failure-to-thrive individuals, per body region. Sample size (N) and statistical results: mean ± SD (95%CI)
Bone mineral density
Eutrophic Failure-to-thrive p value
n= 37 n= 30
Body Total
BMC (g) 2146.65 ± 220.56
(1697-2658)
1933.77 ± 206.48 (1583-2367)
<0.001*
BMD (g/cm2) 1.10 ± 0.06
(0.94-1.25)
1.10 ± 0.06 (0.97-1.20)
0.488
Spine (L2L4) Bone area (cm2)
37.89 ± 2.89 (29.46-43.88)
33.71 ± 2.42 (28.86-37.81)
<0.001*
BMC (g) 42.9 ± 5.66
(28.87-53.98)
37.86 ± 4.96 (26.96-44.72)
<0.001*
BMAD (g/cm3) 0.38 ± 0.03
(0.31-0.44)
0.40 ± 0.04 (0.33-0.50)
0.149
BMD (g/cm2) 1.13 ± 0.10
(0.92-1.36)
1.12 ± 0.11 (0.91-1.32)
0.925
Femur
BMD (g/cm2) 1.00 ± 0.10
(0.78-1.23)
1.01 ± 0.90 (0.82-1.18)
0.449
Values expressed in mean ± SD (minimum - maximum: range);
BMC: bone mineral content; BMD: bone mineral density; BMAD: bone mineral adjusted density. *Significant difference and p < 0.05 (Mann-Whitney test).
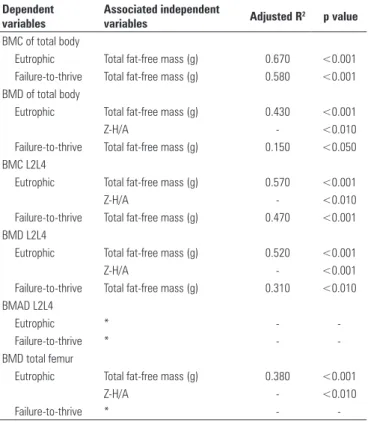
W and H (p < 0.05). The Z-H/A also showed statistical significance for the values of total BMD, BMC and BMD of the spine (L2L4) and BMD of the femur among male eutrophic adolescents. For the BMAD values, in the model studied, no significant independent variables were found (Table 7).
Table 7. Final multiple regression model for males, after adjustments for age, weight and height, per bone mass and body composition indicators
Dependent variables
Associated independent
variables Adjusted R2 p value BMC of total body
Eutrophic Total fat-free mass (g) 0.670 <0.001
Failure-to-thrive Total fat-free mass (g) 0.580 <0.001
BMD of total body
Eutrophic Total fat-free mass (g) 0.430 <0.001
Z-H/A - <0.010
Failure-to-thrive Total fat-free mass (g) 0.150 <0.050
BMC L2L4
Eutrophic Total fat-free mass (g) 0.570 <0.001
Z-H/A - <0.010
Failure-to-thrive Total fat-free mass (g) 0.470 <0.001
BMD L2L4
Eutrophic Total fat-free mass (g) 0.520 <0.001
Z-H/A - <0.001
Failure-to-thrive Total fat-free mass (g) 0.310 <0.010
BMAD L2L4
Eutrophic * -
-Failure-to-thrive * -
-BMD total femur
Eutrophic Total fat-free mass (g) 0.380 <0.001
Z-H/A - <0.010
Failure-to-thrive * -
-BMC: bone mineral content; BMD: bone mineral density; BMAD: bone mineral adjusted density. *No significant independent variable was found in the model.
For male adolescents with failure to thrive, the lean mass was more associated with BMC than with BMD.
In the model used for eutrophic female adolescents, the multiple regression analysis showed that weight was the variable mostly associated with BMC and BMD in the three sites studied. As for girls with failure to thrive, W (BMC and BMD) and age (BMD L2L4 and BMAD) were more important. For these adolescents, FFM was significantly associated with total and L2L4 lumbar spine BMC (Table 8).
DISCUSSION
The criteria used to include adolescents in the study showed that age, weight and height were not enough to define the situation of failure to thrive. There was concern to not include those with very affected Z-H/A indicators, who were more likely to present impaired bone formation due to genetic or hormone disorders, for instance. With the same objective, the interval proposed
Table 8. Final multiple regression model for females, after adjustments for age, weight and height, per bone mass and body composition indicators
Dependent variables Associated
independent variables Adjusted R2 p value BMC of total body
Eutrophic Weight (kg) 0.630 <0.001
Failure-to-thrive Weight (kg) 0.550 <0.001
Total fat-free mass (g) - <0.030
BMD of total body
Eutrophic Weight (kg) 0.400 <0.001
Z-H/A - <0.001
Failure-to-thrive Weight (kg) 0.210 <0.010
BMC (L2L4)
Eutrophic Weight (kg) 0.210 <0.001
Failure-to-thrive Total fat-free mass (g) - <0.010
Age 0.350 <0.030
BMD (L2L4)
Eutrophic Weight (kg) 0.120 <0.020
Failure-to-thrive Age 0.360 <0.010
Z-H/A - <0.010
BMAD (L2L4)
Eutrophic *
-Failure-to-thrive Height 0.320 <0.010
Age - <0.030
BMD of total femur
Eutrophic Weight (kg) 0.360 <0.001
Z-H/A - <0.020
Failure-to-thrive * -
-BMC: bone mineral content; BMD: bone mineral density; BMAD: bone mineral adjusted density. *No significant independent variable was found in the model.
to adjust the BMI for eutrophic and failure-to-thrive adolescents could represent lower risks of modification in body composition due to weight deficit or excess.
According to the data collected, the adolescents with failure to thrive had lower birth weight and height, although weight lower than 2.500 g and height shorter than 46 cm were not described, and these are threshold values for the two variables at the time of birth after
proper gestational period(21).
The statistical significance regarding male
adolescents for BW and BH can be different insofar as the distribution of data is concerned, without relevant clinical implication considering the higher risk of bone mass reduction, since premature newborn or those with indicators of intrauterine malnutrition were
excluded(21).
Lopes et al.(22) described that low birth weight (BW
< 2.500 g) and low birth height (BH < 46 cm) can be considered risk factors and are present in about 30% of cases of failure to thrive diagnosed in children and adolescents.
the FFM was lower for the group with failure to thrive regardless of gender, it may suggest that a shorter limb size can be a confounding factor in the interpretation of such variable; when corrected in function of height by means of the skeletal lean mass index (SLMI), such difference was not noticed.
It is known that bone mass and the growth process result from the interaction between genetic information, organic factors (hormones, organic maturation, bone disorders) and environmental factors (diet, exposure to contaminants, smoking, alcohol consumption, emotional and socioeconomic factors, amongst others), in such a way that these individuals, when leading a healthy lifestyle, are more likely to develop proper bone mass formation, body composition and growth process(4,5,9,18,22).
Since they do no present signs indicating diseases of any etiology, the factors associated with body composition gain relevance in the study regarding the correlation of bone mass formation modulating factors. Some studies showed the influence of lean mass in this process and stressed the importance of situations that represent – within physiological boundaries – mechanical
stress factor for the bone(23). This work overload can be
represented by excess weight or continuous physical
activity during a minimum of eight months(24-27).
At the onset of puberty, between 9 and 11 years old, no significant differences are described regarding bone mass between boys and girls. Notwithstanding, boys have higher values, which, initially, can be explained by the larger size and area of the bones, associated with changes in body composition (more fat-free mass) when
compared to girls(28).
Rauch et al.(13) showed that the acquisition of
muscle mass during the puberty growth spurt precedes the increase in bone mass, suggesting that the increase in muscle mass and, consequently, that of strength can stimulate bone formation and strength. On the other
hand, BMD and FFM are age-dependant(23,29).
Kyle et al.(30) suggested that the lean mass must be
taken into account in the assessment of nutritional status of healthy or sick individuals and that the reduction in its content may imply in a reduction in bone mass (sarcopenia) and can be associated with functional disorders and morbidity.
Young et al.(31) demonstrated that FFM has more
impact on bone mass gain than FM during puberty. On the other hand, after puberty, the fat mass has an even more important effect. Some studies performed in Canada and Mexico with female children, adolescents and young adults stressed that the percentage of body fat adjusted for
weight is negatively associated with BMD(32-33).
Wang et al.(34) evaluated young women and showed
that both the FFM and the FM are important for the
acquisition of bone mass and that the lower association between FFM and BMD, adjusted for weight, may stem from just the greater impact on the lean mass.
A longitudinal, observational study involving 387 adolescents showed that the increase in BMI was associated with greater FFM in boys aged 12
to 17 years(35). Another study suggested that muscle
mass and bone density are genetically determined(36).
Notwithstanding, some authors underlined that proper dietary habits and physical activities during childhood and adolescence may have a positive impact on bone
mass acquisition(25-27).
In the present study, we found difficulties in assessing food consumption and quantifying physical activities. Although studied, the reference scale used did not allow a proper processing of the results, thus compromising the interpretation of these variables, which did not show significant results after analysis.
In order to complement the discussion concerning formation of bone mass, it would be interesting to have data regarding the sexual maturation process of these adolescents. Thus, we could not approach the influence of physiological changes during the maturation process (early or late maturators) in the process of growth and bone mass formation.
These data could help understand the significance found for BMC and BMD (L2L4) values among female adolescents, demonstrated by independent variables such as age. Thus, girls with failure to thrive who started their maturation processes at earlier ages could have higher BMD scores.
CONCLUSIONS
Based on the data described, it can be concluded that adolescents with genetic or constitutional failure to thrive do not present a higher risk of developing osteopenia or osteoporosis in adult life. However, the influence of body composition, especially FFM, in the process of bone mass formation must be further detailed in longitudinal studies. Moreover, some measures to promote healthy lifestyles should be defined.
REFERENCES
1. Russell RG, Espina B, Hulley P. Bone biology and the pathogenesis of osteoporosis. Curr Opin Rheumatol. 2006;18 Suppl 1:S3-10.
2. Campos LM, Liphaus BL, Silva CA, Pereira RM. Osteoporose na infância e na adolescência. J Pediatr (Rio J). 2003;79(6):481-8.
3. Wang MC, Crawford PB, Hudes M, Van Loan M, Siemering K, Bachrach LK. Diet in midpuberty and sedentary activity in prepuberty predict peak bone mass. Am J Clin Nutr. 2003;77(2):495-503.
4. Rimoim DI, Horton WA. Short stature. Part I. J Pediatr. 1978;92(4):523-8. 5. Vásquez Garibay EM, Vallarta Corona G, Sánchez Talamantes E, Nápoles
factor asociado a desnutrición primaria grave en el niño. Bol Med Hosp Infant Mex. 1995;52(12):698-705.
6. Nóbrega FJ, Campos AL. Distúrbios nutricionais e fraco vínculo mãe/filho. Rio de Janeiro: Revinter; 1996. p. 173.
7. Nelson DB, Edgil AE. Family dynamics in families with very low birth weight and full-term infants: a pilot study. J Pediatr Nurs. 1998;13(2):95-103. 8. Frongillo EA Jr. Symposium: Causes and Etiology of Stunting. Introduction. J
Nutr. 1999;129(2S Suppl):529S-30S.
9. Szejnfeld VL. Epidemiologia da osteoporose e fraturas. In: Szejnfeld VL. Osteoporose: diagnóstico e tratamento. São Paulo: Sarvier; 2000. p. 63-74.
10. Boschi V, Siervo M, D’Orsi P, Margiotta N, Trapanese E, Basile F, et al. Body composition, eating behavior, food-body concerns and eating disorders in adolescent girls. Ann Nutr Metab. 2003;47(6):284-93.
11. de Onis M, Frongillo EA, Blössner M. Is malnutrition declining? An analysis of changes in levels of child malnutrition since 1980. Bull World Health Organ. 2000;78(10):1222-33.
12. Taddei JA. Desvios nutricionais em menores de cinco anos: evidências dos inquéritos antropométricos nacionais [Tese]. São Paulo: Universidade Federal de São Paulo; 2000.
13. Rauch F, Bailey DA, Baxter-Jones A, Mirwald R, Faulkner R. The muscle-bone unit during the pubertal growth spurt. Bone. 2004;34(5):771-5.
14. Jelliffe DB. Evaluación del estado de nutrición de la comunidad: con especial referencia a las encuestas en las regiones en desarrollo. Ginebra: Organización Mundial de la Salud; 1968. (OMS-Series de Monografias, 53).
15. Centers for Disease Control and Prevention. CDC growth charts [Internet] [cited 2010 May 25]. Available from: http://www.cdc.gov/growthcharts/ 16. Centers for Disease Control and Prevention. BMI percentile calculator for child
and teen [Internet] [cited 2010 May 25]. Available from: http://apps.nccd.cdc. gov/dnpabmi/Calculator.aspx
17. Kröger H, Kotaniemi A, Vainio P, Alhava E. Bone densitometry of the spine and femur in children by dual-energy x-ray absorptiometry. Bone Miner. 1992;17(1):75-85.
18. Baumgartner RN, Koehler KM, Gallagher D, Romero L, Heymsfield SB, Ross RR, et al. Epidemiology of sarcopenia among the elderly in New Mexico. Am J Epidemiol. 1998;147(8):755-63.
19. Epi Info [computer program] version 6.02: a word processing, database and statistic program for epidemiology on microcomputers. Atlanta (GA): Center for Disease Control and Prevention; 1997.
20. StataCorp. Stata statistical software: Intercooled Stata 9.1 for windows. College Station (TX): Stata Corporation; 2005.
21. Haschke F, van’t Hof MA. Influence of early nutrition on growth. In: Martorell R, Haschke F, editors. Nutrition and growth. Philadelphia: Lippincott Williams & Wilkins; 2001.p. 97-122. [Nestlé Nutrition Institute Workshop Series: Pediatric Program, v.47].
22. Lopes LA, Azevedo TC, Vitalle MS, Torre LP, Moraes DE, Fisberg M. Deficiência do crescimento: características antropométricas de crianças e de seus pais, em atendimento ambulatorial. Rev Paul Pediatr.1992;10(39):115-23. 23. Fricke O, Schoenau E. The “Functional muscle bone unit”: Probing the relevance
of mechanical signals for bone development in children and adolescents. Growth Horm IGF Res. 2007;17(1):1-9.
24. Morris FL, Naughton GA, Gibbs JL, Carlson JS, Wark JD. Prospective ten-month exercise intervention in pre-menarcheal girls: positive effects on bone and lean mass. J Bone Miner Res. 1997;12(9):1453-62.
25. McKay HA, Petit MA, Schutz RW, Prior JC, Barr SI, Khan KM. Augmented trochanteric bone mineral density after modified physical education classes: a randomized school-based exercise intervention study in prepubescent and early pubescent children. J Pediatr. 2000;136(2):156-62.
26. Bradney M, Pearce G, Naughton G, Sullivan C, Bass S, Beck T, et al. Moderate exercise during growth in prepubertal boys: changes in bone mass, size, volumetric density, and bone strength: a controlled prospective study. J Bone Miner Res. 1998;13(12):1814-21.
27. Cobayashi F, Lopes LA, Taddei JA. Densidade mineral óssea de adolescentes com sobrepeso e obesidade. J Pediatr (Rio J). 2005; 81(4):337-42. 28. Maynard LM, Guo SS, Chumlea WC, Roche AF, Wisemandle WA, Zeller CM
et al. Total-body and regional bone mineral content and area bone mineral density in children aged 8-18 y: the Fels Longitudinal Study. Am J Clin Nutr. 1998;68(5):1111-7.
29. Högler W, Briody J, Woodhead HJ, Chan A, Cowell CT. Importance of lean mass in the interpretation of total body densitometry in children and adolescents. J Pediatr. 2003;143(1):81-8.
30. Kyle UG, Schutz Y, Dupertuis YM, Pichard C. Body composition interpretation. Contributions of the fat-free mass index and the body fat mass index. Nutrition. 2003;19(7-8):597-604.
31. Young D, Hopper JL, Macinnis RJ, Nowson CA, Hoang NH, Wark JD. Changes in body composition as determinants of longitudinal changes in bone mineral measures in 8 to 26-year-old female twins. Osteoporos Int. 2001;12(6):506-15. 32. Weiler HA, Janzen L, Green K, Grabowski J, Seshia MM, Yuen KC. Percent
body fat and bone mass in healthy Canadian females 10 to 19 years of age. Bone. 2000;27(2):203-7.
33. Lazcano-Ponce E, Tamayo J, Cruz-Valdez A, Díaz R, Hernández B, Del Cueto R, et al. Peak bone mineral area density and determinants among females aged 9 to 24 years in Mexico. Osteoporos Int. 2003;14(7):539-47.
34. Wang MC, Bachrach LK, Van Loan M, Hudes M, Flegal KM, Crawford PB. The relative contributions of lean tissue mass and fat mass to bone density in young women. Bone. 2005;37(4):474-81.
35. Maynard LM, Wisemandle W, Roche AF, Chumlea WC, Guo SS, Siervogel RM. Childhood body composition in relation to body mass index. Pediatrics. 2001;107(2):344-50.