Rita Adriana Gomes de SouzaI
Mauro Felippe Felix MedianoII Amanda de Moura SouzaIII
Rosely SichieriIV
I Instituto de Saúde Coletiva. Universidade Federal de Mato Grosso. Cuiabá, MT, Brasil II Instituto de Pesquisa Clínica Evandro
Chagas. Fundação Oswaldo Cruz. Rio de Janeiro, RJ, Brasil
III Programa de Pós-Graduação em Saúde Coletiva. Departamento de Epidemiologia. Instituto de Medicina Social. Universidade do Estado do Rio de Janeiro. Rio de Janeiro, RJ, Brasil
IV Departamento de Epidemiologia. Instituto de Medicina Social. Universidade do Estado do Rio de Janeiro. Rio de Janeiro, RJ, Brasil
Correspondence:
Rita Adriana Gomes de Souza Instituto de Saúde Coletiva
Universidade Federal de Mato Grosso. Av. Fernando Corrêa da Costa, 2367 1Bloco CCBSIII 2º piso - Boa Esperança 78060-900 Cuiabá, MT, Brasil E-mail: [email protected] Received: 1/11/2011 Approved: 10/7/2012
Article available from: www.scielo.br/rsp
Reducing the use of sugar in
public schools: a randomized
cluster trial
ABSTRACT
OBJECTIVE: To test the effi cacy of nutritional guidelines for school lunch cooks aiming to reduce added sugar in school meals and their own sugar intake.
METHODS: A controlled randomized cluster trial was carried out in twenty public schools in the municipality of Niteroi in Rio de Janeiro, Southeastern Brazil, from March to December 2007. A nutrition educational program was implemented in the schools in question through messages, activities and printed educational materials encouraging reduced levels of added sugar in school meals and in the school lunch cooks’ own intake. The reduced availability of added sugar in schools was evaluated using spreadsheets including data on the monthly use of food item supplies. The cooks’ individual food intake was evaluated by a Food Frequency Questionnaire. Anthropometric measurements were taken according to standardized techniques and variation in weight was measured throughout the duration of the study.
RESULTS: There was a more marked reduction in the intervention schools compared to the control schools (-6.0 kg versus 0.34 kg), but no statistically signifi cant difference (p = 0.21), although the study power was low. Both groups of school lunch cooks showed a reduction in the consumption of sweets and sweetened beverages, but the difference in sugar intake was not statistically signifi cant. Weight loss and a reduction in total energy consumption occurred in both groups, but the difference between them was not statistically signifi cant, and there was no alteration in the percentages of adequacy of macronutrients in relation to energy consumption.
CONCLUSIONS: The strategy of reducing the use and consumption of sugar by school lunch cooks from public schools could not be proved to be effective.
Obesity is viewed as a global epidemic. It refl ects the complex interaction of genetic, metabolic, cultural, environmental, socio-economic and behavioral factors, although it’s most basic explanation lies in energy intake.19 Consumption of carbohydrates, principally in the form of simple sugars, has increased over the last 20 years, as have rates of obesity and being overweight.9
The share of energy coming from consuming sugar increased from 13.1% to 16.0% between 1977 and 1996, and, between 1994 and 1996 in the United States,10 over 30% of carbohydrates consumed came from sugar. In Brazil, the world’s largest producer of sugar, its relative share of total energy, as determined in the Pesquisas de Orçamento Familiar (POF – Household Budget Surveys), was around 13%. However, the main sources of sugar have changed: soft drinks, which represented 0.8% of sugar intake in 1988, increased to 1.3% in 1996, 1.5% in 20035 and 1.8% in 2008.a
Although there is no consensus on the impact of sugar intake in isolation on obesity and other health conditions,13 its increase has meant that, in Brazil and the United States,b the public are advised to choose food and drink which will decrease their added sugar intake. In 2003, the World Health Organization (WHO), suggested that added sugars should provide no more than 10% of energy intake in the diet.22 This recommen-dation appears in the Brazilian food guide developed and distributed by the Ministry of Health.c
Although there are no known effective strategies to prevent or treat excessive weight gain,7 a strategy to prevent this would be more viable than the entire popula-tion losing weight. Small, cumulative changes in diet and physical activity may have greater impact if developed with children who are not at risk of being overweight.12
Children and adolescents are the focus of efforts to prevent obesity,1 thus schools are the ideal situation in which to set up interventions. They provide the opportu-nity for continued, intense contact with children throu-ghout their formative years and have infrastructure, offering the greatest potential to positively infl uence infant-juvenile health.21
In Niterói, RJ, Southeastern Brazil, intervention studies with schoolchildren aiming at reducing consumption of soft drinks showed that a small decrease in their consumption was replaced by the consumption of juices with high levels of added sugar16 and that the school lunch cooks participated very little in reducing added sugar. INTRODUCTION
This study aimed to analyze the effectiveness of nutri-tional education activities with school lunch cooks in reducing added sugar in school lunches and in their own consumption.
METHODS
A controlled randomized cluster trial carried out in 20 municipal schools in the municipality of Niterói between March and December 2007. The 36 municipal schools were distributed among fi ve areas; 20 were selected from three areas (one, two and fi ve) which had similar demographic and socio-economic characteristics.
One of the three areas was randomly selected to receive intervention (seven schools) and another to be the control (seven schools), aiming thus to reduce contamination between the groups. Of the seven schools in the third area, three were randomly allocated to the intervention group and three to the control group (one school was undergoing building work). This area was the most distant from the center of Niterói and had a lower popula-tion density, meaning the schools were not close together and there was less chance of contamination.
Five male workers were excluded and those consid-ered eligible to take part were non-pregnant females working as school lunch cooks in participating schools, regardless of shift. Six (6.3%) refused to participate in the study; the intervention groups was made up of 47 individuals and the control group of 48 (Figure).
Data on consumption for children in public schools in Niterói (34.5 g; standard deviation (SD): 26.0 g) from a 2005 cross-sectional study16 was used in order to esti-mate the necessary sample size for evaluating changes in the intake and availability of sugar. There would be 36 individuals needed in each group for a 10% decrease in intake (3.4 g), supposing 80% of power and a 0.05 level of signifi cance. A suitable sample would be made up of 80 school lunch cooks, taking into consideration that the schools were randomly selected and the partic-ipation rate was 80%14 (Figure).
A Nutritional Education Program was established in the intervention schools for a period of seven months in the 2007 academic year, using messages and activities which encouraged reducing the sugar added to school meals and in the cooks’ own intake.
The school lunch cooks taking part in the intervention took part in fi ve activities. The fi rst two included
a Instituto Brasileiro de Geografi a e Estatística. Pesquisa de orçamentos familiares 2008-2009: avaliação nutricional da disponibilidade domiciliar de alimentos no Brasil. Rio de Janeiro; 2010.
b United States Department of Agriculture, Center for Nutrition Policy and Promotion. Report of the Dietary Guidelines Advisory Committee on the Dietary Guidelines for Americans. Washington (DC); 2010.
two sections on sugar intake (approaching topics such as obesity and sugar intake and foods which are sources of sugars in Brazil, dietary recommendations and encouragement to reduce sugar in food). The third activity was to substitute sugar in coffee with powdered milk. To accomplish this, a tin of powdered milk was provided to encourage this substitution and an information card promoting this change was placed where the coffee was made. The fourth activity included a section on food labelling; the fi fth was a competition involving reduced sugar recipes. The activities took place monthly in the school and lasted around 20 minutes. Three research assistants were trained to carry out these activities.
Participants received educational material encouraging them to reduce sugar and products branded with the project logo such as mugs, bags and magnets. The schools were provided with banners and fridge magnets.
Demographic and socio-economic data, and informa-tion about health, physical activity and sugar intake for both groups were collected through interviews and the beginning of the academic year.
The school lunch cooks in the control group and the intervention group took part in three discussion segments on encouraging healthy eating, promoted by the municipal Education Department, in one of the participant schools, at the beginning of the academic year. These meetings aimed to enable the team and the participant to get to know each other.
The assessment of the availability of sugar and foods which are sources of sugar (donuts, milky coffee, banana cereal, chocolate cereal, chocolate milk, lacteal fl our powdered drink mix, cake mix) in schools took place fortnightly. In this study, there was a baseline assessment (mean of two fortnights in March) and
Intervention 9 schools 41 school lunch cooks Losses:
2 asked to be exempt 1 sabbatical 1 retirement 1 pregnancy 1 transferred to creche
Intervention 10 schools 47 school lunch cooks
Control 10 schools 48 school lunch cooks Randomiztation
20 schools 95 school lunch cooks
20 schools 101 school lunch cooks
Invited to participate: 20 school 130 school lunch cooks
Exclusions:
6 not working as school lunch cooks,a
5 men 1 request to be exempt
7 doctor’s notes 3 maternity leaves 4 left the position,
3 retired
Refusals to participate: 6
Losses: 2 on medical leave 1 asked to be exempt
1 retired 1 pregnancy
1 school did not give the number of pupilsc
Baseline
Control 10 schools 43 school lunch cooks End of
study 1 school started
building workb
a School lunch cooks who, for health reasons, have other positions in the school.
b It was not possible to evaluate the food items stored, but the school lunch cooks in this school continued to participate in the study.
c It was not possible to calculate the food items stored per capita, but the school lunch cooks in this school continued to participate in the study.
another carried out at the end of the study (mean of two fortnights in September). Spreadsheets containing data on the availability of the items were used. At these times, the number of pupils receiving school meals and the number of days on which they were served were recorded. The per capita availability of sugar, in grams, in the schools, was obtained by dividing the availability of sugar, in grams, by the mean monthly number of days on which school meals were served and by the number of pupils in the school.
The school lunch cooks’ individual intake was assessed using a Food Frequency Questionnaire (FFQ).15 The questionnaire included an item on adding refi ned table sugar to coffee, sugar and other foods. The items considered to be sweets were: ice-cream, candies, chocolate, chocolate milk, milk pudding and cookies. Sugary drinks were: soft drinks, juice and mate tea. Responses to frequency of consumption included eight options: three or more times/day, 2-3 times/day, once/day, 5-6 times/week, 2-4 times/week, 1 once/week, 1-3/month and never/almost never,
which were transformed into daily frequency. Once/ day, e.g, corresponded to 0.14 (1/7). The food items in question had three response options for the portion, with the exception of milk pudding, which had two response options. The FFQ was applied at the baseline and at the end of the study.
Weight was measured at the baseline, in the fi fth month and at the end of the study, using light clothing and the same digital scale (Tanita, model BC 533 Inner Scan), calibrated to 0.1 kg and with a maximum capacity of 150 kg. The individuals had to stand straight, arms beside the body, looking straight ahead, according to the technique recommended in the equipment manual and utilized by Lohman et al6 (1988). Height was measured at the baseline (mean of two measure-ments) in the position described above, although with feet together and with claves, shoulders and buttocks touching the wall. A portable stadiometer (Seca, model Body Metter 208) was used. Height and weight were used to calculate body mass index (BMI = weight (kg)/ height (meters)2) and nutritional state was classifi ed,
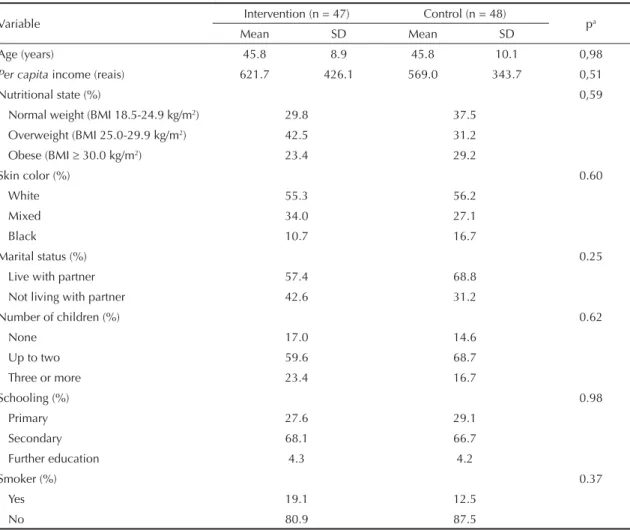
Table 1. Characteristics of the school lunch cooks at the baseline. Niterói, RJ, Southeastern Brazil, 2007.
Variable Intervention (n = 47) Control (n = 48) pa
Mean SD Mean SD
Age (years) 45.8 8.9 45.8 10.1 0,98
Per capita income (reais) 621.7 426.1 569.0 343.7 0,51
Nutritional state (%) 0,59
Normal weight (BMI 18.5-24.9 kg/m2) 29.8 37.5
Overweight (BMI 25.0-29.9 kg/m2) 42.5 31.2
Obese (BMI 30.0 kg/m2) 23.4 29.2
Skin color (%) 0.60
White 55.3 56.2
Mixed 34.0 27.1
Black 10.7 16.7
Marital status (%) 0.25
Live with partner 57.4 68.8
Not living with partner 42.6 31.2
Number of children (%) 0.62
None 17.0 14.6
Up to two 59.6 68.7
Three or more 23.4 16.7
Schooling (%) 0.98
Primary 27.6 29.1
Secondary 68.1 66.7
Further education 4.3 4.2
Smoker (%) 0.37
Yes 19.1 12.5
No 80.9 87.5
according to the WHO23 into normal weight (BMI: 18.5 to 24.9 kg/m2), overweight (BMI: 25.0 to 29.9 kg/m2) and obese (BMI ≥ 30.0 kg/m2).
The characteristics of the two groups were compared at the baseline using the Student’s t-test for continuous variables and the chi-squared test for categorical vari-ables, and were similar for both groups (Table 1). Mean age was approximately 46 years old, and income per capita around 600 reais. The majority of the women were overweight (BMI ≥ 25.0 kg/m2), white and lived with a partner, had up to two children, had fi nished high school and were non-smokers.
Changes in the availability of sugar in the schools and in individual consumption were assessed using the paired t-test. Fluctuations in weight were evaluated using regression analysis of mixed effects for repeated measures, equivalent to intention-to-treat analysis and take into consideration the conglomerate effect. Weight underwent a logarithmic transformation as it did not have normal distribution. The analyses were carried out using Statistical Analyses System software, version 9.1. (SAS Institute Inc., Cary, NC, USA). The level of signifi cance adopted was 5%.
This study was carried out following the standards required by the Helsinki Declaration and was approved by the Research Ethics Committee of the Institute of Social Medicine, Universidade do Estado do Rio de Janeiro (Process No. 26/2006, approved 12/14/2006). The aims of the study and the confi dentiality of its results were explained to the participants. All partici-pants read and signed a consent form.
RESULTS
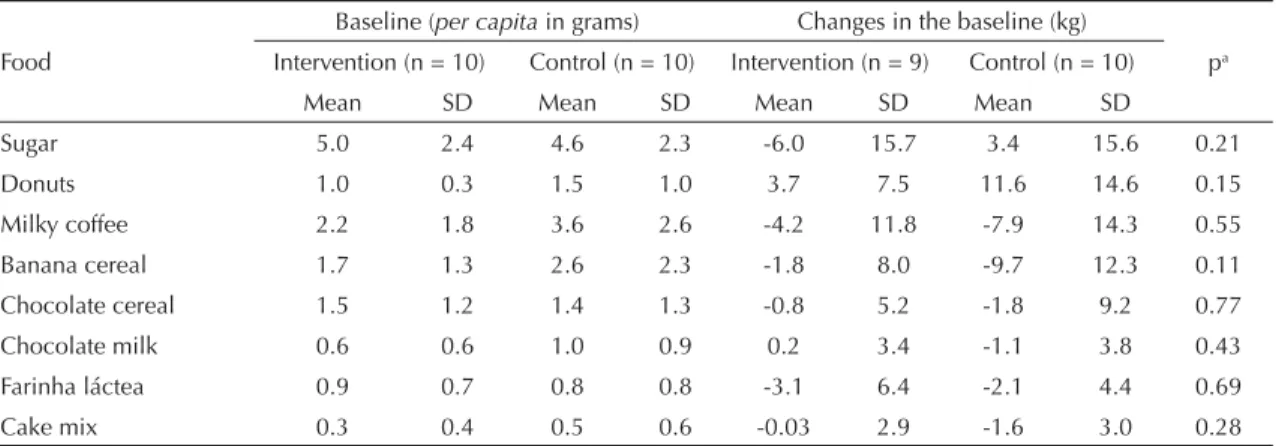
In the intervention group, there was a loss of 12.8% during the study, and of 10.4% in the control group (Figure), none of which were related to the interven-tion. The follow up time was practically identical for both groups (8.8 months for the intervention group and 8.9 months for the control group). One school in the intervention group started building work in the middle of the study and it was therefore impossible to evaluate the food items stored. One school in the control group did not provide the number of pupils and it was there-fore impossible to assess the per capita availability of sugar and foods which are sources of sugar, although the school lunch cooks continued to participate in Table 2. Mean and standard deviation (SD) for availability of sugar and foods which are sources of sugar, in school in both groups at the baseline and at the end of the study. Niterói, RJ, Southeastern Brazil, 2007.
Baseline (per capita in grams) Changes in the baseline (kg)
Food Intervention (n = 10) Control (n = 10) Intervention (n = 9) Control (n = 10) pa
Mean SD Mean SD Mean SD Mean SD
Sugar 5.0 2.4 4.6 2.3 -6.0 15.7 3.4 15.6 0.21
Donuts 1.0 0.3 1.5 1.0 3.7 7.5 11.6 14.6 0.15
Milky coffee 2.2 1.8 3.6 2.6 -4.2 11.8 -7.9 14.3 0.55
Banana cereal 1.7 1.3 2.6 2.3 -1.8 8.0 -9.7 12.3 0.11
Chocolate cereal 1.5 1.2 1.4 1.3 -0.8 5.2 -1.8 9.2 0.77
Chocolate milk 0.6 0.6 1.0 0.9 0.2 3.4 -1.1 3.8 0.43
Farinha láctea 0.9 0.7 0.8 0.8 -3.1 6.4 -2.1 4.4 0.69
Cake mix 0.3 0.4 0.5 0.6 -0.03 2.9 -1.6 3.0 0.28
a Paired t-test
Table 3. Mean and standard deviation (SD) of the daily portionsa of sugar, sweets and drinks at the baseline and at the end of the study between the groups. Niterói, RJ, Southeastern Brazil, 2007.
Food or food group
Intervention Control Change in the baseline
Baseline (n = 45)
End of study (n = 40)
Baseline (n = 43)
End of study (n = 39)
Intervention (n = 40)
Control (n = 39) pe
Mean SD Mean SD Mean SD Mean SD Mean SD Mean SD
Sugarb 1.7 1.9 2.0 1.8 1.8 2.0 1.5 1.7 0.3 1.7 -0.4 2.3 0.10
Sweetsc 1.4 1.7 0.8 0.8 1.1 1.3 0.9 1.1 -0.6 1.5 -0.2 1.2 0.18
Sugary drinksd 2.3 2.1 1.9 2.7 3.0 3.6 1.4 1.3 -0.5 2.3 -1.8 3.6 0.07
a Daily portion = daily frequency x number of portions b Added sugar
c Ice-cream, candies, chocolate, chocolate milk, milk pudding, cookies d Soft drinks, mate tea, juice
Reducing sugar in sc
hools
Souza RA
G et al
Variable
Baseline End of study Changes at the baseline
Intervention (n = 45)
Control
(n = 43) p
Intervention (n = 40)
Control
(n = 39) Intervention Control pb
Mean SD Mean SD Mean SD Mean SD Mean SD Mean SD
Energy (kcal) 3,791 2,385 3,888 2,390 0.85 2,839 1,904 2,906 2,064 -1,056 2,475 -1,149 2,737 0.88
Carbohydrate (%) 60.6 5.2 59.5 9.8 0.50 59.4 5.8 58.1 6.3 -1.1 6.9 -1.6 10.7 0.81
Protein (%) 12.2 2.5 12.4 2.8 0.67 13.0 2.5 13.1 2.8 0.9 2.9 0.8 3.5 0.90
Lipid (%) 27.2 3.7 28.1 7.5 0.49 27.5 4.3 28.8 4.5 0.2 5.1 0.8 8.0 0.70
Energy from added
sugar (%) 2.1 2.4 2.9 4.9 0.34 3.7 3.7 4.0 5.0 1.6 3.7 1.1 5.2 0.62
Energy from sweets
(%) 2.6 3.5 2.5 2.8 0.87 2.1 2.3 2.9 3.1 -0.28 3.7 0.28 2.8 0.46
Energy from sugary
drinks (%) 4.2 3.4 5.8 7.0 0.19 4.0 4.5 4.1 3.5 -0.25 4.6 -2.1 7.0 0.18
Total energy for the items in question (%)
8.9 6.8 11.2 9.4 0.20 9.8 8.3 11.0 8.7 1.11 8.0 -0.65 9.0 0.36
Weight (kg)
Baseline 5th month End of study pc
Intervention 68.7 68.7 67.3 0.74
Control 69.1 68.5 68.9
a Mean percentage share in relation to energy intake b Paired t-test
the study. Six women, (two in the intervention group and four in the control group) who had daily energy intakes of above ten thousand calories, and one in the control group who did not complete the FFQ were not included in analyses related to food intake.
The per capital available sugar was higher at the base-line, and there was a reduction in availability in the intervention group, compared with the control group, by the end of the study (-6.4 kg versus 3.4 kg). The items analyzed showed a reduction in the availability in both groups at the end of the study, with the exception of donuts in both groups, and chocolate milk in the intervention group. However, the differences were not statistically signifi cant (Table 2).
Consumption of sweets and sugary drinks underwent a reduction in both groups. Sugar intake increased in the intervention group and fell in the control group, although the differences were not statistically signifi cant (Table 3).
Although there was a signifi cant decline in total energy intake (on average, 1,100 calories), there was no change in the percentage share of macronutrients in relation to energy intake, nor was there a signifi cant change only in items in the intervention. Sugary drinks were those which made the highest contribution to the total percentage of energy. The school lunch cooks in the intervention group managed to maintain weight loss until the end of the study, although the difference was not statistically signifi cant (p = 0.74); 15 school lunch cooks (15.8%) (nine in the intervention group and six in the control group) lost at least 5% of their initial weight (Table 4).
DISCUSSION
The strategy of small changes in behavior to negatively offset the energy balance has been proposed as a way to reduce the obesity epidemic,4 although there is no consensus on this.18 The data of this study suggest it is possible to reduce the availability of sugar and foods which are sources of sugar in schools. Although there was no reduction in the intake of sugar, sweets and sugary drinks in the intervention group compared with the control group, there was a reduction in the total calorie intake of the two groups and there was weight loss, although neither of these reductions were statistically signifi cant.
A recent systematic review13 concluded that sugar intake is not related to adverse health effects, such as obesity and metabolic syndrome, and some authors believe that sugar intake has no direct causal link to obesity. In spite of this, sugar contributes to high caloric density of the diet,2,11 which can lead to weigh gain.8 A meta-analysis, including the fi nancing of the project as a variable, showed that studies fi nanced by the food industry are those which show preferably negative results.20 Moreover, it is believed that a high sugar diet may also contain lower levels of micronutrients (dilution effect)3 and may be nutritionally defi cient.13
There was no decrease in the school lunch cooks’ carbohydrate intake, an aim of the study, nor was there a decrease in protein or lipid intake. Studies show that the adoption of multiple dietary strategies, aiming to improve dietary quality, may be more effective than focusing on one single strategy.1,17 Reducing added sugar and solid fats is encouraged as they account for 355 of calories in the North American diet.
Measures regarding the production of foods with high sugar content may be more satisfactory than focusing on the consumer. Our focus on the school lunch cooks was justifi ed by their importance in the schools’ health eating process. The diffi culty in making them reduce their sugar intake may indicate diffi culties in implemen-ting these changes in school meals due to the school lunch cooks themselves. However, it is possible, as shown in this study, to reduce sugar content based on policies which combine reducing availability and nutrition education activities.
The power of the study was compromised as the muni-cipal Department of Education had taken measures to develop healthy eating strategies, leading to reductions in the availability of sugar in schools, in the same year in which the study was carried out. This explains the fi gures found, which were lower than those used in calculating the sample size.
1. Bluford DA, Sherry B, Scanlon KS. Interventions to prevent or treat obesity in preschool children: a review of evaluated programs. Obesity (Silver Spring). 2007;15(6):1356-72. DOI:10.1038/oby.2007.163
2. Coulston A, Johnson RK. Sugar and sugars: myths and realities. J Am Diet Assoc. 2002;102(3):351-3. DOI:10.1016/S0002-8223(02)90082-9
3. Frary CD, Johnson RJ, Wang MQ. Children and adolescents’ choices of foods and beverages high in added sugars are associated with intakes of key nutrients and food groups. J Adolesc Health. 2004;34(1):56-63. DOI:10.1016/S1054-139X(03)00248-9
4. Hill JO. Can a small-changes approach help address the obesity epidemic? A report of the Joint Task Force of the American Society for Nutrition, Institute of Food Technologists, and International Food Information Council. Am J Clin Nutr. 2009;89(2):477-84. DOI:10.3945/ajcn.2008.26566
5. Levy-Costa RB, Sichieri R, Pontes N dos S, Monteiro CA. Disponibilidade domiciliar de alimentos no Brasil: distribuição e evolução (1974-2003). Rev Saude Publica. 2005;39(4): 530-40. DOI:10.1590/S0034-89102005000400003
6. Lohman TG, Roche AF, Martorell R. Anthropometric standardization reference manual. Illinois: Human Kinetics Books; 1988.
7. Malik VS, Schulze MB, Hu FB. Intake of sugar-sweetened beverages and weight gain: a systematic review. Am J Clin Nutr. 2006;84(2):274-88.
8. Mann J. Free sugars and human health: suffi cient evidence for action? Lancet. 2004; 363(9414):1068-70. DOI:10.1016/S0140-6736(04)15844-3
9. Monteiro CA. Nutrition and health. The issue is not food, nor nutrients, so much as processing.
Public Health Nutr. 2009;12(5):729-31.
DOI:10.1017/S1368980009005291
10. Popkin BM, Nielsen SJ. The sweetening of the world’s diet. Obes Res. 2003;11(11):1325-32. DOI:10.1038/oby.2003.179
11. Prentice AM, Jebb SA. Fast foods, energy density and obesity: a possible mechanistic link. Obes Rev. 2003;4(4):187-94. DOI:10.1046/j.1467-789X.2003.00117.x
12. Rodearmel SJ, Wyatt HR, Stroebele N, Smith SM, Ogden LG, Hill JO. Small changes in dietary sugar and physical activity as an approach to preventing excessive weight gain: the America on the Move
family study. Pediatrics. 2007;120(4):e869-79. DOI:10.1542/peds.2006-2927
13. Ruxton CH, Gardner EJ, McNulty HM. Is sugar consumption detrimental to health? A review of the evidence 1995-2006. Crit Rev Food Sci Nutr.
2010;50(1):1-19. DOI:10.1080/10408390802248569
14. Sato T. Sample size calculations with compliance information. Stat Med. 2000;19(19):2689-97. DOI:10.1002/1097-0258(20001015)19:19<2689::AID-SIM555>3.0.CO;2-0
15. Sichieri R, Everhart JE. Validity of a Brazilian Food Frequency Questionnaire against dietary recalls and estimated energy intake. Nutr Res. 1998;18(10):1649-59. DOI:10.1016/S0271-5317(98)00151-1
16. Sichieri R, Trotte AP, de Souza RA, Veiga GV. School randomised trial on prevention of excessive weight gain by discouraging students from drinking sodas. Public Health Nutr. 2009;12(2):197-202. DOI:10.1017/S1368980008002644
17. Sigman-Grant M, Morita J. Defi ning and interpreting intakes of sugars. Am J Clin Nutr. 2003;78(4):815-26.
18. Swinburn BA, Sacks G, Lo SK, Westerterp KR, Rush EC, Rosenbaum M, et al. Estimating the changes in energy fl ux that characterize the rise in obesity prevalence. Am J Clin Nutr. 2009;89(6):1723-8. DOI:10.3945/ajcn.2008.27061
19. Swinburn B, Sacks G, Ravussin E. Increased food energy supply is more than suffi cient to explain the US epidemic of obesity. Am J Clin Nutr. 2009;90(6):1453-6. DOI:10.3945/ajcn.2009.28595
20. Vartanian LR, Schwartz MB, Brownell KD. Effects of soft drink consumption on nutrition and health: a systematic review and meta-analysis. Am J Public Health. 2007;97(4):667-75. DOI:10.2105/AJPH.2005.083782
21. Wolf AM, Woodworth KA. Obesity prevention: recommended strategies and challenges.
Am J Med. 2009;122(4 Suppl 1):S19-23.
DOI:10.1016/j.amjmed.2009.01.004
22. World Health Organization; Food and Agriculture Organization. Diet, nutrition and the prevention of chronic diseases. Report of a Joint WHO/FAO Expert Consultation. Geneva; 2003. (Technical Report Series, 916).
23. World Health Organization. Physical status: the use and interpretation of anthropometry. Report of a WHO Expert Committee. Geneva; 1995. (Technical Report Series, 854).
REFERENCES