*Corresponding author. E-mail: anacarolinacorreacafe@gmail.com.br (A.C.C. Café).
aUniversidade Federal de São João del-Rei (UFSJ), Divinópolis, MG, Brazil.
Received on November 23, 2016; approved on April 04, 2017; available online on February 22, 2018.
INTAKE OF SUGAR-SWEETENED BEVERAGES,
MILK AND ITS ASSOCIATION WITH BODY MASS
INDEX IN ADOLESCENCE: A SYSTEMATIC REVIEW
Consumo de bebidas açucaradas, leite e sua associação
com o índice de massa corporal na adolescência:
uma revisão sistemática
Ana Carolina Corrêa Café
a,*, Carlos Alexandre de Oliveira Lopes
a,
Rommel Larcher Rachid Novais
a, Wendell Costa Bila
a, Daniely Karoline da Silva
a,
Márcia Christina Caetano Romano
a, Joel Alves Lamounier
aObjective: To systematize literature references addressing the association of sugar-sweetened beverage (SSB) and milk intake with body mass index (BMI) in adolescents.
Data source: A search was carried out in PubMed (US National
Library of Medicine National Institutes of Health) and BVS (Virtual Library in Health). The descriptors used were: adolescents, young adult, beverages, drinking, obesity, overweight, BMI, and nutritional status. The following filters were applied: age ranging
from 10 to 19 years, studies published in Portuguese or English language between 2011-2015.
Data synthesis: Thirty studies were selected (22 cross-sectional
studies, 4 cohort studies, 1 randomized clinical trial, 1 case-control
study, and 1 quasi-experimental study). There was association
between the intake of these beverages and increase in BMI in 55% of all 20 studies that dealt with sugary drinks. When it came to soft drinks, 100% of studies reported association with increase in BMI. As to milk intake, only one article showed association with increased BMI. Three articles reported milk as a protection factor against increase in BMI; three studies found no association between this intake and BMI. Nineteen studies had representative
samples and 20 surveys reported random samples. Among papers using questionnaires, 84% had been validated.
Conclusions:There is no consensus in the literature about the
association between SSB or milk intake and BMI in adolescents. Keywords: Adolescent; Beverages; Obesity; Body mass index.
ABSTRACT
Objetivo: Sistematizar as referências da literatura relacionadas à
associação entre consumo de bebidas açucaradas não alcoólicas,
leite e índice de massa corporal (IMC) em adolescentes.
Fontes de dados: Realizou-se a pesquisa dos artigos nos portais PubMed (US National Library of Medicine National Institutes of Health) e BVS (Biblioteca Virtual em Saúde). Os descritores foram: adolescente,
adulto jovem, bebidas, ingestão de líquidos, obesidade, sobrepeso,
IMC e estado nutricional. Utilizaram-se os filtros: idade entre 10 e 19 anos e artigos em português e inglês, publicados entre 2011 e 2015.
Síntese dos dados: Trinta estudos foram selecionados
(22 transversais, 4 coortes, 1 ensaio clínico aleatório, 1
caso-controle e 1 quase experimental). Dos 20 estudos que abordaram bebidas açucaradas em geral, 55% encontraram associação entre
consumo e aumento do IMC. Em relação aos estudos sobre a
ingestão de refrigerantes, todos apresentaram associação entre
consumo e aumento do IMC. Dos estudos sobre leite, somente um demonstrou associação entre consumo e aumento do IMC. Três artigos mostraram proteção entre consumo de leite e aumento do IMC, e três trabalhos não encontraram associação de seu consumo com aumento do IMC. Dezenove estudos possuíam
amostras representativas e outros 20 declararam ter amostras aleatórias. Dos artigos com questionários, 84% eram validados.
Conclusões:Verifica-se que não há consenso na literatura
pesquisada sobre a associação entre consumo de bebidas
açucaradas não alcoólicas, leite e IMC de adolescentes. Palavras-chave: Adolescente; Bebidas; Obesidade; Índice de
massa corporal.
INTRODUCTION
Over the last decades, the world — Brazil included — has seen changes in food and nutritional patterns, which has resulted in increased obesity and reduced malnutrition rates. The phenomenon of epidemiological and nutritional transition affects both children and adolescents.1 Among
factors related, changes in lifestyle and eating habits play an important role. Among other foods and beverages con-sumed by the population, a greater intake of sugar-sweet-ened non-alcoholic beverages has been seen. At the same time, the intake of milk and dairy products has decreased, especially among adolescents.2-5
Among environmental causes of obesity in adolescence, changes in their nutritional pattern motivated by political and economic transformations are pointed out and occur in all nations. The strong trend towards consumption of pro-cessed and ultra-propro-cessed foods and beverages is broad. Special emphasis should be given to the high consumption of sugary drinks. The international literature on the topic includes papers addressing soft drinks, sweetened juices, powdered juices, boxed juices, sports drinks, water, sweetened tea and energy drinks fitted within the category of sugar-sweetened beverage (SSB).6,7 The excessive intake of this type of beverage is one of
the main factors contributing to the obesity epidemic in Brazil and across the world.2,3,5,8
In this scenario of changes, the intake of soft drinks in Brazilian households has increased 400% from 1975 to 2003 and 16% from 2003 to 2009.4 This considerable increase is
alarming, as there is evidence that this type of drink is asso-ciated with higher calorie intake and excessive weight gain in adolescents.8 As to milk, consumption rates were shown to
reduce in 40% between 1975 and 2003 and in 10% between 2003 and 2009.4
A likely explanation for sugary drinks to increase body mass index (BMI) is the fact that the intake of liquid carbohy-drates causes less satiety than solid carbohycarbohy-drates, which leads to higher total energy consumed.9 On the other hand,
sev-eral studies in the literature suggest that milk and dairy prod-ucts in whole versions are protective against obesity, which is explained by the influence of protein, calcium, and fat-solu-ble vitamins mechanism of action, and by the fact that they induce more satiety.10-13
Adolescents are influenced in school, by friends and the media, which directly interferes in the formation of their eating habits.14 Eating inadequacies at this age can
deter-mine how puberty will evolve, with growth rate delay and even interruption.15 At this stage of life, adolescents start
gaining more autonomy, deciding what, when and how to eat. Eating out comes accompanied by modifications.
Snacks over main meals, breakfast omission and low con-sumption of fruits, vegetables, milk, and dairy products can pose consequences such as inadequate calcium, fiber and water intake.16
The strength of media and social valorization of ultra-pro-cessed foods, nowadays accessible to a large portion of the population, stimulate the consumption of high-calorie prod-ucts.17 Among the wide range of food available, beverage was
the topic chosen for our study because it is currently and con-stantly present in discussions published in the literature and in the media.18-21 Brazilian non-alcoholic beverage companies
agreed by consensus not to air advertises about soft drinks and artificial juices for children up to 12 years of age.19 In addition,
the end of commercialization of these drinks in schools across the country is in discussion.18 According to these companies,
the end of advertising aimed at this age group is a global trend, inspired by other countries’examples.19 In Brazil, draft bills
on the subject, such as 4,910/2016 and 1,755/2007, are in the pipeline.22 Market research has shown that there will be
a drop in consumption of soft drinks in the future, and com-panies seem to be preparing for it commercially.18
Sugary drinks is a theme in ascendancy in foreign research, but is still little discussed in Brazil. Despite the large number of international papers addressing the topic, there is still no consensus on the relationship between intake of sugar-sweet-ened non-alcoholic drinks or milk and obesity in adolescents. The aim of this study was to systematize the literature refer-ences studying the association between intake of sugar-sweet-ened non-alcoholic drinks or milk and BMI in adolescents. This research may support clinical practice of pediatric health professionals and collaborate with further studies, the differ-ential being the systematic review that evaluates whether a questionnaire on the consumption of certain beverages has been validated, and the analysis of evidence level according to study design, sample randomness and representativeness in the papers selected.
METHOD
were “or” and “and”. The following combinations were used in Portuguese: (adolescente OR adulto jovem) AND ( bebi-das OR ingestão de líquidos) AND (obesidade OR sobrepeso) AND (índice de massa corporal OR estado nutricional); in English, combinations were: (adolescent OR young adult) AND (beverages OR drinking) AND (obesity OR over-weight) AND (body mass index OR nutritional status). Later on, filters were applied: age range between 10 and 19 years, as recommended by the World Health Organization (WHO); and articles published in Portuguese and English between January 1, 2011 and July 31, 2015, when the last search was made.
Critically and independently selected publications were evaluated by two authors. Doubts about the selection of articles were evaluated and agreed among researchers until a consensus was reached. In order to classify the level of evidence of articles, the categorization by the Agency for Healthcare Research and Quality (AHRQ) of 201623 was
used, according to which level 1 is considered the greatest strength of evidence and includes meta-analyzes of multi-ple controlled studies. Individual projects with experimental design, such as randomized clinical trials, are considered as level 2. Cohort studies, case-control and quasi-experimental studies, such as non-randomized studies, are classified as level 3. Non-experimental studies such as cross-sectional ones are sorted as level of evidence 4. Case reports are level 5, and opinions of reputable authorities based on clinical compe-tence or opinions of expert committees and interpretations of non-research based information are at level 6.23
The search strategy was conducted according to the pro-posal by PRISMA (Preferred Reporting Items for Systematic Reviews and Meta-Analyzes, 2009) and to PICOS eligibil-ity criteria (participants, intervention, comparison, out-comes — results — and study design).24 From the guiding
question “Is there an association between consumption of sugar-sweetened non-alcoholic drinks or milk and BMI in adolescents”, PICOS criteria were: participants of both gen-ders and aging 10 to 19 years. The intervention considered was consumption of sugar-sweetened non-alcoholic bever-ages, such as juice and soda, or milk. As for comparison, the intake or no intake of the beverages in question was observed. For outcomes, it was analyzed whether the consumption of the mentioned beverages had relation with increase in BMI. In cases of association, it was verified whether it was direct or inverse. In direct association, beverage consump-tion increased BMI. Therefore, in inverse associaconsump-tion, con-sumption of beverages reduced BMI. Therefore, the studies selected were inputted to three tables taking into account their design and level of evidence.23
Table 1 covers articles with cross-sectional studies exclu-sively on sugar-sweetened beverage. Table 2 shows cross-sec-tional articles dealing with sugar-sweetened beverage and milk consumption. In Table 3 lists all articles with other study designs.
In order to evaluate possible risks of bias between studies, the instruments used to measure the intake of beverages was analyzed, being it a 24-hour record, the food frequency tionnaire (QFA) or any other tool. In the case of the ques-tionnaire, its validation was checked and assured. Also regard-ing instruments and anthropometry, possible self-registration of data was taken into account, or data collection by trained researchers. In order to evaluate other possible bias risks in each study, the item limitation, to cover the limitations of each arti-cle chosen for the literature review, was included in the data collection tool.
RESULTS
The search with descriptors, according to the mentioned com-binations, first retrieved 907 articles. Five repeated articles were removed at screening. After filtering and limiting them, 513 papers were excluded, with 389 articles remaining eligible. After reading of titles and abstracts, the following exclusion criteria were applied to 353 articles: pregnant women, alco-holic beverages, case reports, and literature reviews. A total of 36 eligible papers were read, of which six were excluded for not answering the research questioning. Finally, 30 studies that answered the guiding question of the investigation were included in the sample (Figure 1).
Among the studies evaluated, 22 (73.3%) reported associa-tion of the beverages intake with increased BMI. In all 30 arti-cles together, 34 types of beverage were evaluated: four artiarti-cles addressed two types of beverage in the same study, i.e., milk and sugary drinks. In the analysis comprising 34 beverages, 19 of them (56%) were shown to have a direct association with increase in BMI; six of them reported an inverse association, with reduction of BMI; and, finally, eight studies (26.7%) on nine types of beverage showed no association between their intake and BMI.
Among 30 papers selected for review, 18 (60.0%) addressed the relationship between sugar-sweetened beverages in general and BMI; five (16.7%) addressed only soft drinks intake; three
(10.0%) dealt only with milk intake; two (6.7%) of them were on the association of soft drink or milk with BMI; and two (6.7%) of them reported the relation between sugar-sweetened beverages in general or milk and BMI. Among all studies, 20 of them approached on sugary drinks; 7 exclusively addressed soft drinks and seven, milk.
From the 20 studies (66.7%) that addressed sugary drinks in general, 55% reported an association between their intake and increased BMI. The seven studies on soft drinks agreed 100% in their findings that there was an association between intake and increase in BMI, and one of them considered soft drinks in diet version in the analysis. Finally, from seven stud-ies on milk, only one (14.3%) showed association between its
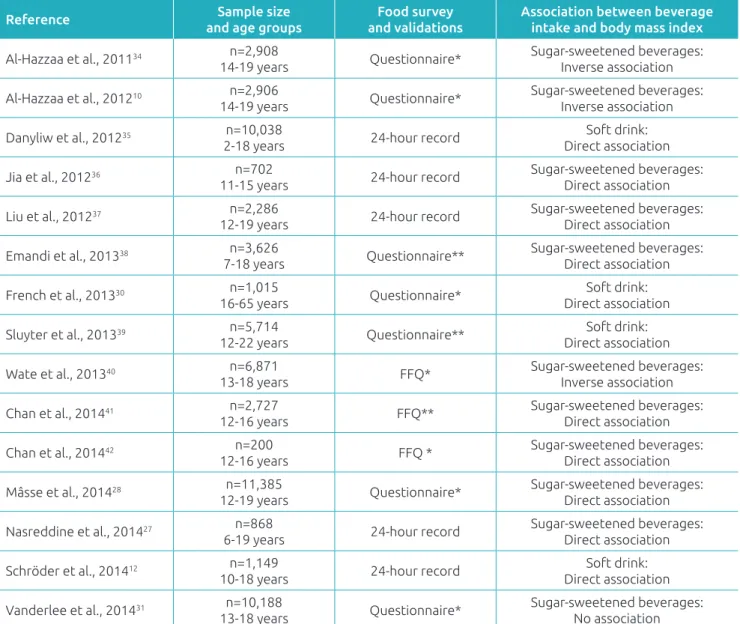
Table 1 Cross-sectional studies (n=15) that analyzed the association of sugar-sweetened beverages intake with
body mass index in adolescents.
Reference Sample size and age groups
Food survey and validations
Association between beverage intake and body mass index
Al-Hazzaa et al., 201134 n=2,908
14-19 years Questionnaire*
Sugar-sweetened beverages: Inverse association
Al-Hazzaa et al., 201210 n=2,906
14-19 years Questionnaire*
Sugar-sweetened beverages: Inverse association
Danyliw et al., 201235 n=10,038
2-18 years 24-hour record
Soft drink: Direct association
Jia et al., 201236 n=702
11-15 years 24-hour record
Sugar-sweetened beverages: Direct association
Liu et al., 201237 n=2,286
12-19 years 24-hour record
Sugar-sweetened beverages: Direct association Emandi et al., 201338 n=3,626
7-18 years Questionnaire**
Sugar-sweetened beverages: Direct association French et al., 201330 n=1,015
16-65 years Questionnaire*
Soft drink: Direct association Sluyter et al., 201339 n=5,714
12-22 years Questionnaire**
Soft drink: Direct association
Wate et al., 201340 n=6,871
13-18 years FFQ*
Sugar-sweetened beverages: Inverse association
Chan et al., 201441 n=2,727
12-16 years FFQ**
Sugar-sweetened beverages: Direct association
Chan et al., 201442 n=200
12-16 years FFQ *
Sugar-sweetened beverages: Direct association Mâsse et al., 201428 n=11,385
12-19 years Questionnaire*
Sugar-sweetened beverages: Direct association Nasreddine et al., 201427 n=868
6-19 years 24-hour record
Sugar-sweetened beverages: Direct association Schröder et al., 201412 n=1,149
10-18 years 24-hour record
Soft drink: Direct association Vanderlee et al., 201431 n=10,188
13-18 years Questionnaire*
intake and increased BMI, while three (42.8%) reported pro-tection from milk consumption against increase in BMI, and three found no association with increased or decreased BMI.
Regarding level-4 evidence and cross-sectional studies, in which a positive association between consumption and BMI
was found, eight (57.1%) were related to the intake of sug-ar-sweetened beverages in general; six (42.8%) were related only to soft drink intake; and one (7.1%) involved milk consump-tion. Among level-3 studies, in which an association between consumption and increased BMI was identified, 75% addressed
Table 2 Cross-sectional studies (n=7) that analyzed the association of milk and sugar-sweetened beverages intake
with body mass index in adolescents.
Reference Sample size and age groups
Food survey and validations
Association between beverage intake and body mass index
Abreu et al., 201443 n=1,209
15-18 years FFQ* Milk: No association
Gates et al., 201311 n=443 9-18 years
24-hour record
and questionnaire* Milk: Inverse association
Liu et al., 201244 n=14,332
2-19 years 24-hour record
Milk: Direct association Sugar-sweetened beverages:
Direct association Fayet et al., 201345 n=4,487
2-16 years 24-hour record Milk: No association
Albar et al., 201413 n=636
11-18 years Food diary
Milk: Inverse association Soft drink: Direct association
Beck et al., 201446 n=319
8-10 years FFQ*
Milk: Inverse association Soft drink: Direct association
Nassar et al., 201447 n=190
16-18 years Questionnaire*
Milk: No association Sugar-sweetened beverages:
No association N: number of subjects; FFQ: Food Frequency Questionnaire; *Validated questionnaire.
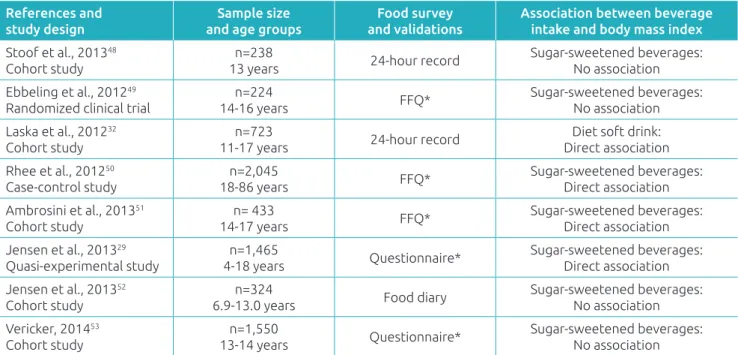
Table 3 Randomized clinical trials, cohort, case-control, quasi-experimental studies (n=8) that evaluated the
association of beverages intake with body mass index in adolescents. References and
study design
Sample size and age groups
Food survey and validations
Association between beverage intake and body mass index
Stoof et al., 201348 Cohort study
n=238
13 years 24-hour record
Sugar-sweetened beverages: No association Ebbeling et al., 201249
Randomized clinical trial
n=224
14-16 years FFQ*
Sugar-sweetened beverages: No association Laska et al., 201232
Cohort study
n=723
11-17 years 24-hour record
Diet soft drink: Direct association Rhee et al., 201250
Case-control study
n=2,045
18-86 years FFQ*
Sugar-sweetened beverages: Direct association Ambrosini et al., 201351
Cohort study
n= 433
14-17 years FFQ*
Sugar-sweetened beverages: Direct association Jensen et al., 201329
Quasi-experimental study
n=1,465
4-18 years Questionnaire*
Sugar-sweetened beverages: Direct association Jensen et al., 201352
Cohort study
n=324
6.9-13.0 years Food diary
Sugar-sweetened beverages: No association Vericker, 201453
Cohort study
n=1,550
13-14 years Questionnaire*
the ingestion of sugary beverages in general. In 42.9% of level 3 studies, there was no association between sugary beverages and BMI. Only one paper in this review was a randomized clinical trial in which the intake of sugar-sweetened beverage was not associated with BMI.
DISCUSSION
First to mention, we have seen a lack of national papers on the subject. It should be emphasized, though, that research on this topic is fundamental to discuss the association between BMI and the intake of these beverages.
Most studies were cross-sectional (73.3%), characterized as level 4 of evidence. Thus, the conduction of other types of study favoring the identification of risk factors for increased BMI in adolescents should be encouraged.12 Despite the smaller
number of studies that did not report association between these beverages and increase in BMI, 50% of them were level 3 or 2 of evidence, one of which was a randomized clinical trial with a high level of evidence, and three were cohort stud-ies (37.5%).23 Further studies on drinks and BMI are
there-fore needed in order for a stronger conclusion to be drawn. The systematic review by Malik et al. shows evidence that the non-intake of sugary beverages allows control and reduction of adiposity indicators.25 Another systematic review published
in 2013 pointed out signs to the establishment of a positive association between sugar-sweetened beverages and increased BMI. In the same review, however, one of the three articles selected did not report a significant association between BMI and their consumption.26
Regarding the stratification of beverages, the sugar-sweet-ened group had the highest number of publications (66.7%). There is an obstacle to identifying the beverages analyzed, as the term “sugar-sweetened drink” involves a variety of prod-ucts, making it difficult to sort and draw conclusions about each drink. Although there were more papers about sugary drinks, soft drinks, when analyzed in isolation, were mostly associated (100%) with increase in BMI, and this is a red flag for the drawbacks of their intake.
After evaluating the studies, we noticed that in order to measure the intake of beverages, general and food frequency questionnaires (FFQ) were frequently applied (60.0%), as well as food diaries (30%). Two articles (7.0%) used food diary and one applied an FFQ along with a 24-hour record, which strengthens knowledge about dietary habits. The negative points of these data collection instruments are worth noting: the 24-hour record is often underreported, as it depends on memory and there is the difficulty in estimating portion sizes, thus not representing the actual variability of day-to-day food intake.11,27 In some cases, questionnaires lacked information
Figure 1 Research flowchart: identification, screening, eligibility, and inclusion of scientific papers in systematic
review, according to PRISMA (2009).
Databases: PubMed, BVS, MEDLINE, Lilacs, Ibecs 907
papers identified
5 repeated articles excluded
513 papers excluded after the following filters were applied: age ranging from 10 to 19 years, published in the last five years.
353 papers excluded for matching exclusion criteria: pregnant women involved, alcoholic beverage involved, case reports, and literature reviews.
6 papers excluded for not answering the questioning of the study
902 eligible papers
389 papers to be analyzed
36 papers selected
30 papers included in review
Identification
Screening
Eligibility
about their validation. Among 19 articles using question-naires and FFQ, 84% had been validated. On the other hand, 24-hour reports and food diaries require no validation, only the annotation of all foods and beverages consumed by either the researcher or the participant.
The questionnaire being self-administered or adminis-tered by trained researchers was also something to consid-ered. From the total of questionnaires applied, 26% were self-reported by adolescents. Self-resport can induce errors that tend to mask or attenuate existing associations.28
In addi-tion, in two articles the questionnaire had been applied by phone call. It is known that questions answered by phone can have memory bias, sub-registration, and social desir-ability.29,30 In other cases, a record was applied in person.
The data collection instrument is a quality control measure when administered by trained researchers.27 In the study
by Albar et al., the food diary was kept for more than four consecutive days, during which a trained researcher visited each participant three times at their residence. This type of investigation allows greater food variability. The trained researcher’s visit makes it possible to review the diary, deal with problems, edit possible flaws — such as omissions —, and include more details.13
Regarding information collection to obtain BMI, there were also variations. In some studies, weight and height were obtained by self-report,28,31 which leads us to the complexity in
obtaining consistent conclusions, considering the tendency to overestimate height and underestimate weight.11 In addition,
the range of instruments used for data collection is an obstacle to the homogeneity of discussion about the findings.
As to sample representativeness and randomness, 19 (63.3%) studies had representative samples and 20 (66.7%) had random samples. Thus, it is difficult to judge whether the data collected in this group of articles were representative of a
population.32 The representativeness and randomness of
sam-ples are fundamental from the statistical point of view in order to extrapolate the information collected to the population.33
The limitations of this study are related to the difficulty in drawing conclusions from articles that, for the most part, do not evaluate individual follow-ups, the variety of collection instruments or the way they are applied. In addition, some articles do not bring descriptions of the randomness and rep-resentativeness of their samples.
The potential of this work is the detailed analysis of papers selected as to the evaluation of: relationship between sugary beverage or milk consumption and BMI of adolescents, the instruments used in studies, the randomness and representa-tiveness of their samples, the way surveys were carried out, and how anthropometric data were measured.
One can conclude that there is no consensus in the litera-ture about the association between the intake of sugar-sweet-ened non-alcoholic drinks or milk and the BMI of adolescents. The overall rate of consumption of sugar-sweetened non-alco-holic beverage by adolescents is high, and additional follow-up studies should be conducted to elucidate these effects on ado-lescents’ BMI and overall health.
ACKNOWLEDGMENTS
Fundação de Amparo à Pesquisa do Estado de Minas Gerais (FAPEMIG), Universidade Federal de São João del-Rei (UFSJ), and Universidade Federal de Ouro Preto (UFOP).
Funding
This study did not receive funding.
Conflict of interest
The authors declare no conflict of interests.
REFERENCES
1. Batista Filho M, Batista LV. Transição alimentar/nutricional
ou mutação antropológica? Cienc Cult. 2010;62:26-30.
2. Cimadon HM, Geremia R, Pellanda LC. Dietary habits and risk factors for atherosclerosis in students from Bento Gonçalves (state of Rio Grande do Sul). Arq Bras Cardiol.
2010;95:166-72.
3. Muito além do peso [filme]. Direção: Maria Estela Renner. São Paulo: Farinha Filmes Brasil; 2012. 4. Brasil. Ministério do Planejamento, Orçamento e gestão. Instituto Brasileiro de Geografia e Estatística – IBGE. Pesquisa de Orçamentos Familiares 2008–2009: Avaliação nutricional
da disponibilidade domiciliar de alimentos no Brasil. Rio de Janeiro: IBGE; 2010.
5. Committee on Accelerating Progress in Obesity Prevention Food; Committee on Accelerating Progress in Obesity Prevention Food; Glickman D, Parker L, Sim L, Cook H, et al. Accelerating progress in obesity prevention: Solving the weight of the nation. Washington, D.C.: National
Academies Press; 2012.
6. Malik VS, Schulze MB, Hu FB. Intake of sugar-sweetened
7. Association Heart Association. Sugar-sweetened beverages initiatives can help fight childhood obesity [homepage on internet]. [cited November 2015]. Available from: http:// www.heart.org/idc/groups/heart-public/@wcm/@adv/ documents/downloadable/ucm_462756.pdf
8. Ludwig DS, Peterson KE, Gortmaker SL. Relation between consumption of sugar-sweetened drinks and childhood
obesity: a prospective, observational analysis. Lancet. 2001;357:505-8.
9. Pan A, Hu FB. Effects of carbohydrates on satiety: differences between liquid and solid food. Curr Opin Clin Nutr Metab
Care. 2011;14:385-90.
10. Al-Hazzaa HM, Abahussain NA, Al-Sobayel HI, Qahwaji DM, Musaiger AO. Lifestyle factors associated with overweight and obesity among Saudi adolescents. BMC Public Health.
2012;12:1-11.
11. Gates M, Hanning RM, Gates A, Martin ID, Tsuji LJS. Intakes of milk and alternatives among on-reserve First Nations youth in northern and southern Ontario, Canada. Public Health Nutr. 2013;16:515-23.
12. Schröder H, Mendez MA, Ribas L, Funtikova AN, Gomez SF, Fito M, et al. Caloric beverage drinking patterns are differentially
associated with diet quality and adiposity among Spanish girls and boys. Eur J Pediatr. 2014;173:1169-77.
13. Albar SA, Alwan NA, Evans CE, Cade JE. Is there an association between food portion size and BMI among British adolescents? Br J Nutr. 2014;112:841-51.
14. World Health Organization. Health topics: adolescent health [homepage on the Internet]. [cited March 2016]. Available from: http://www.who.int/topics/adolescent_health/en/ 15. Sociedade Brasileira de Pediatria. Departamento de
Nutrologia. Manual de orientação para alimentação do lactente, do pré-escolar, do escolar, do adolescente e na escola. 3rd ed. Rio de Janeiro: SBP; 2012.
16. Teixeira AM, Philippi ST, Leal GV, Araki EL, Estima CC, Guerreiro
RE. Substituição de refeições por lanches em adolescentes. Rev Paul Pediatr. 2012;30.
17. Keller S, Schulz P. Distorted food pyramid in kids programmes:
a content analysis of television advertising watched in
Switzerland. Eur J Public Health. 2011;21:300-5.
18. Machado AP, Vines J. Empresas não venderão mais
refrigerantes para escolas. Folha de S.Paulo. 2016 Jun 23.
p. A16.
19. Bergamo M. Baixa Caloria. Folha de S.Paulo. 2016 Mar 2.
p. C2.
20. Criança e consumo. Iniciativa Alana [homepage on the Internet]. 2016 [cited September 2016]. Available from: http://criancaeconsumo.org.br/noticias/onu-governos-regulem-a-publicidade-dirigida-as-criancas/
21. Brasil. Conselho Nacional de Segurança Alimentar e Nutricional (CONSEA). Indústria de Suco e Refrigerante anuncia fim de propaganda para criança [homepage on the Internet]. 2016 [cited April 2016]. Available from: http://www4.planalto.gov. br/consea/comunicacao/noticias/2016/industria-de-suco-e-refrigerante-anuncia-fim-de-propaganda-para-crianca 22. Brasil. Portal da Câmara dos Deputados. Proposições
[homepage on the Internet]. Projeto de lei [cited October 2016]. Available from: http://www2.camara.leg.br/
23. Agency for Health Care Research and Quality (AHRQ) [homepage on the Internet]. Quality indicators [cited June 2016]. Available from: http://www.qualityindicators.
ahrq.gov
24. Moher D, Liberati A, Tetzlaff J, Altman DG, PRISMA Group.
Preferred reporting items for systematic reviews and
meta-Analyses: the PRISMA statement. PLoS Med. 2009;6. 25. Malik VS, Pan A, Willett WC, Hu FB. Sugar-sweetened
beverages and weight gain in children and adults: a systematic review and meta-analysis. Am J Clin Nutr. 2013;98:1084-102.
26. Jiménez-Cruz A, Gómez-Miranda LM, Bacardí-Gascón M. Randomized clinical trials of the effect of sugar sweetened
beverages consumption on adiposity in youngers than 16
y old; systematic review. Nutr Hosp. 2013;28:1797-801. 27. Nasreddine L, Naja F, Akl C, Chamieh MC, Karam S, Sibai
AM, et al. Dietary, lifestyle and socio-economic correlates of overweight, obesity and central adiposity in Lebanese children and adolescents. Nutrients. 2014;6:1038-62.
28. Mâsse LC, Niet-Fitzgerald JE, Watts AW, Naylor PJ, Saewyc
EM. Associations between the school food environment,
student consumption and body mass index of Canadian adolescents. Int J Behav Nutr Phys Act. 2014;11:1-9. 29. Jensen BW, Nichols M, Allender S, Silva-Sanigorski A, Millar
L, Kremer P, et al. Inconsistent associations between sweet drink intake and 2-year change in BMI among Victorian children and adolescents. Pediatr Obes. 2013;8:271-83. 30. French S, Rosenberg M, Wood L, Maitland C, Shilton T, Pratt
IS, et al. Soft drink consumption patterns among Western Australians. J Nutr Educ Behav. 2013;45:525-32.
31. Vanderlee L, Manske S, Murnaghan D, Hanning R, Hammond D. Sugar-sweetened beverage consumption among a subset of Canadian youth. J Sch Health. 2014;84:168-76. 32. Laska MN, Murray DM, Lytle LA, Harnack LJ. Longitudinal
associations between key dietary behaviors and weight
gain over time: transitions through the adolescent years.
Obesity (Silver Spring). 2012;20:118-25.
33. Vieira S. Introdução à bioestatística [recurso eletrônico].
Rio de Janeiro: Elsevier; 2011.
34. Al-Hazzaa HM, Abahussain NA, Al-Sobayel HI, Qahwaji DM, Musaiger AO. Physical activity, sedentary behaviors and
dietary habits among Saudi adolescents relative to age,
gender and region. Int J Behav Nutr Phys Act. 2011;8:1-14. 35. Danyliw AD, Vatanparast H, Nikpartow N, Whiting SJ.
Beverage patterns among Canadian children and relationship
to overweight and obesity. Appl Physiol Nutr Metab. 2012;37:900-6.
36. Jia M, Wang C, Zhang Y, Zheng Y, Zhang L, Huang Y, et al. Sugary beverage intakes and obesity prevalence among junior high school students in Beijing – a cross-sectional research on SSBs intake. Asia Pac J Clin Nutr. 2012;21:425-30. 37. Liu J, Chu Y, Frongillo E, Probst J. Generation and
acculturation status are associated with dietary intake
and body weight in Mexican American adolescents. J Nutr. 2012;142:298-305.
38. Emandi AC, Puiu M, Gafencu M, Pienar C. Overweight and
obesity in school age children in western Romania. Rev Med
39. Sluyter JD, Scragg RK, Plank LD, Waqa GD, Fotu KF, Swinburn BA. Sizing the association between lifestyle behaviours
and fatness in a large, heterogeneous sample of youth of
multiple ethnicities from 4 countries. Int J Behav Nutr Phys
Act. 2013;10:1-14.
40. Wate JT, Snowdon W, Millar L, Nichols M, Mavoa H, Goundar R,
et al. Adolescent dietary patterns in Fiji and their relationships
with standardized body mass index. Int J Behav Nutr Phys
Act. 2013;10:1-12.
41. Chan TF, Lin WT, Huang HL, Lee CY, Wu PW, Chiu YW, et al.
Consumption of sugar-sweetened beverages is associated with components of the metabolic syndrome in adolescents. Nutrients. 2014;6:2088-103.
42. Chan TF, Lin WT, Chen YL, Huang HL, Yang WZ, Lee CY, et al.
Elevated serum triglyceride and retinol-binding protein 4 levels associated with fructose-sweetened beverages in
adolescents. PloS One. 2014;9:1-9.
43. Abreu S, Santos R, Moreira C, Santos PC, Vale S, Soares-Miranda L, et al. Relationship of milk intake and physical
activity to abdominal obesity among adolescents. Pediatr
Obes. 2014;9:71-80.
44. Liu JH, Jones SJ, Sun H, Probst JC, Merchant AT, Cavicchia P. Diet, physical activity, and sedentary behaviors as risk factors
for childhood obesity: an urban and rural comparison. Child
Obes. 2012;8:440-8.
45. Fayet F, Ridges LA, Wright JK, Petocz P. Australian children who drink milk (plain or flavored) have higher milk and micronutrient intakes but similar body mass index to those who do not drink milk. Nutr Res. 2013;33:95-102.
46. Beck AL, Tschann J, Butte NF, Penilla C, Greenspan LC.
Association of beverage consumption with obesity in Mexican
American children. Public Health Nutr. 2014;17:338-44. 47. Nassar MF, AbdelKader AM, Al-Refaee FA, Al-Dhafiri SS.
Pattern of beverage intake and milk and dairy products sufficiency among high-school students in Kuwait. East Mediterr Health J. 2014;20:738-44.
48. Stoof SP, Twisk JW, Olthof MR. Is the intake of
sugar-containing beverages during adolescence related to adult
weight status? Public Health Nutr. 2013;16:1257-62. 49. Ebbeling CB, Feldman HA, Chomitz VR, Antonelli TA,
Gortmaker SL, Osganian SK, et al. A randomized trial of
sugar-sweetened beverages and adolescent body weight. N Engl J Med. 2012;367:1407-16.
50. Rhee JJ, Mattei J, Campos H. Association between commercial
and traditional sugar-sweetened beverages and measures of
adiposity in Costa Rica. Public Health Nutr. 2012;15:1347-54. 51. Ambrosini GL, Oddy WH, Huang RC, Mori TA, Beilin LJ, Jebb SA.
Prospective associations between sugar-sweetened beverage
intakes and cardiometabolic risk factors in adolescents. Am
J Clin Nutr. 2013;98:327-34.
52. Jensen BW, Nielsen BM, Husby I, Bugge A, El-Naaman B, Andersen LB, et al. Association between sweet drink intake
and adiposity in Danish children participating in a long-term
intervention study. Pediatr Obes. 2013;8:259-70.
53. Vericker TC. Children’s school-related food and physical
activity behaviors are associated with body mass index. J Acad Nutr Diet. 2014;114:250-6.