Encapsulating Peritoneal Sclerosis, a Complication of
Chronic Peritoneal Dialysis
Fabian R. Reimold1,2,3, Niko Braun3,4, Zsuzsanna K. Zsengelle´r5, Isaac E. Stillman1,5, S. Ananth Karumanchi1,2,6, Hakan R. Toka1,7, Joerg Latus3,4, Peter Fritz8, Dagmar Biegger8,9, Stephan Segerer10, M. Dominik Alscher3,4, Manoj K. Bhasin2,11., Seth L. Alper1,2,6
*.
1Renal Division, Beth Israel Deaconess Medical Center, Harvard Medical School, Boston, Massachusetts, United States of America,2Department of Medicine, Harvard Medical School, Boston, Massachusetts, United States of America,3Department of General Internal Medicine and Nephrology, Robert-Bosch Hospital, Stuttgart, Germany,
4Institute of Digital Medicine, Stuttgart, Germany,5Department of Pathology, Beth Israel Deaconess Medical Center and Harvard Medical School, Boston, Massachusetts, United States of America,6Center for Vascular Biology Research, Beth Israel Deaconess Medical Center and Harvard Medical School, Boston, Massachusetts, United States of America,7Division of Nephrology and Department of Medicine, Brigham and Women’s Hospital and Harvard Medical School, Boston, Massachusetts, United States of America, 8Division of Pathology, Department of Diagnostic Medicine, Robert-Bosch Hospital, Stuttgart, Germany,9Margarete Fischer-Bosch Institute of Clinical Pharmacology, Stuttgart, Germany,10Division of Nephrology, University Hospital Zurich, Zurich, Switzerland,11Division of Interdisciplinary Medicine and Biotechnology and Department of Medicine, Beth Israel Deaconess Medical Center and Harvard Medical School, Boston, Massachusetts, United States of America
Abstract
Encapsulating peritoneal sclerosis (EPS) is a devastating complication of peritoneal dialysis (PD), characterized by marked inflammation and severe fibrosis of the peritoneum, and associated with high morbidity and mortality. EPS can occur years after termination of PD and, in severe cases, leads to intestinal obstruction and ileus requiring surgical intervention. Despite ongoing research, the pathogenesis of EPS remains unclear. We performed a global transcriptome analysis of peritoneal tissue specimens from EPS patients, PD patients without EPS, and uremic patients without history of PD or EPS (Uremic). Unsupervised and supervised bioinformatics analysis revealed distinct transcriptional patterns that discriminated these three clinical groups. The analysis identified a signature of 219 genes expressed differentially in EPS as compared to PD and Uremic groups. Canonical pathway analysis of differentially expressed genes showed enrichment in several pathways, including antigen presentation, dendritic cell maturation, B cell development, chemokine signaling and humoral and cellular immunity (P value,0.05). Further interactive network analysis depicted effects of EPS-associated genes on networks linked to inflammation, immunological response, and cell proliferation. Gene expression changes were confirmed by qRT-PCR for a subset of the differentially expressed genes. EPS patient tissues exhibited elevated expression of genes encoding sulfatase1, thrombospondin 1, fibronectin 1 and alpha smooth muscle actin, among many others, while in EPS and PD tissues mRNAs encoding leptin and retinol-binding protein 4 were markedly down-regulated, compared to Uremic group patients. Immunolocalization of Collagen 1 alpha 1 revealed that Col1a1 protein was predominantly expressed in the submesothelial compact zone of EPS patient peritoneal samples, whereas PD patient peritoneal samples exhibited homogenous Col1a1 staining throughout the tissue samples. The results are compatible with the hypothesis that encapsulating peritoneal sclerosis is a distinct pathological process from the simple peritoneal fibrosis that accompanies all PD treatment.
Citation:Reimold FR, Braun N, Zsengelle´r ZK, Stillman IE, Karumanchi SA, et al. (2013) Transcriptional Patterns in Peritoneal Tissue of Encapsulating Peritoneal Sclerosis, a Complication of Chronic Peritoneal Dialysis. PLoS ONE 8(2): e56389. doi:10.1371/journal.pone.0056389
Editor:Andre Van Wijnen, University of Massachusetts Medical, United States of America
ReceivedNovember 5, 2012;AcceptedDecember 27, 2012;PublishedFebruary 13, 2013
Copyright:ß2013 Reimold et al. This is an open-access article distributed under the terms of the Creative Commons Attribution License, which permits unrestricted use, distribution, and reproduction in any medium, provided the original author and source are credited.
Funding:This work was supported by Baxter International, Inc. (NB, SS and MDA), the Howard Hughes Medical Institute (SAK) and NIH DK34854 (Harvard Digestive Diseases Center to SLA). FRR was supported by a Fellowship of the Robert Bosch Foundation. SS is supported by the Swiss National Science Foundation (32003B-129710). The funders had no role in study design, data collection and analysis, decision to publish, or preparation of the manuscript.
Competing Interests:The authors have the following interests. This study was partly funded by Baxter International, Inc. There are no patents, products in development or marketed products to declare. This does not alter the authors’ adherence to all the PLOS ONE policies on sharing data and materials, as detailed online in the guide for authors.
* E-mail: [email protected]
.These authors contributed equally to this work.
Introduction
Renal replacement therapy is currently restricted to renal transplantation, hemodialysis (HD), and peritoneal dialysis (PD). Peritoneal dialysis constitutes,10% of current renal replacement therapy in the US and in much of Europe, but up to 80% in Mexico and Taiwan [1]. However, reimbursement changes
expected to accompany health care reform in the US will promote renewed interest in and increased use of PD.
sporadic idiopathic EPS has been reported [6,7,8], prior duration of PD remains the most important risk factor identified to date [2,9]. EPS epidemiology has been complicated by regional differences in PD use and in reported EPS incidence, likely exacerbated by non-uniform diagnostic criteria. EPS rates among 7000 patients from Australia and New Zealand were 0.3% after 3 years on PD, 0.8% after 5 years, and 3.9% after 8 years [9], but 8.1% of UK patients treated with PD for 5 years developed EPS [10]. In a Japanese cohort of PD patients with overall EPS incidence of 2.5%, EPS was diagnosed in 17–70% of patients with PD duration.15 years [11,12,13]. 72% of EPS is recognized only after discontinuation of PD due to ultrafiltration failure, switch to hemodialysis, or transplantation [9]. Among transplanted PD patients in the Dutch multicenter EPS study, EPS was the fourth most common cause of death after infection, cardiovascular disease, and malignancy [14].
The pathogenesis of EPS remains incompletely understood. Simple peritoneal fibrosis accompanies nearly all PD treatment, resulting in gradual impairment of ultrafiltration that can necessitate transition to HD [15]. Risk factors and signaling pathway abnormalities distinguishing the malignant fibrotic process of EPS from simple peritoneal fibrosis are poorly defined. The current two-hit model envisions as a first hit the long-term exposure to advanced glycation end products (AGEs) in peritoneal dialysate [16,17], leading to increased expression of profibrotic factors such as transforming growth factor b (TGF-b) and of angiogenic mediators such as vascular endothelial growth factor (VEGF). In addition, declining numbers of pro-fibrinolytic mast cells promote enhanced fibrin deposition [18]. A contributing role has also been proposed for the turbulent fluid shear stress intrinsic to the process of PD [19,20]. The second hit remains unknown, but may be a clinically obvious or occult inflammatory or ischemic stimulus. Peritoneal mesothelial cells are believed to undergo epithelial-to-mesenchymal transition (EMT), leading in EPS to complete mesothelial denudation that accompanies the severe fibrosis [21,22]. However, the high rates of EPS among patients treated with PD over lengthy periods also suggest an alternate hypothesis. EPS may instead represent the natural evolution of PD-associated peritoneal fibrosis, influenced by patient-specific risk modifier gene profiles that determine the kinetics of progression from simple fibrosis to EPS.
The absence of blood tests specific for EPS requires diagnosis based on clinical presentation, radiologic and histologic findings [2]. The clinical presentation of EPS is characterized by varied and nonspecific symptoms, including bowel obstruction, loss of appetite, fever, nausea and vomiting, ascites, constipation, diarrhea and weight loss. The diagnosis of EPS is most commonly made by CT scan, but the radiological picture can be nonspecific [23]. Diagnosis also can be made by peritoneoscopy or laparot-omy, classically revealing abdominal cocooning (bands or layers of fibrotic tissue surrounding and constricting bowel loops), some-times accompanied by a fibrotic ‘‘sugar coating’’ appearance. Histologically, EPS peritoneal tissues often contain myofibroblast-like cells expressing smooth muscle actin-1 and podoplanin [22]. Braun et al. have recently proposed additional novel histological criteria for the diagnosis of EPS, including mesothelial denudation, fibrin deposits, and presence of fibroblast-like cells [24].
Non-surgical therapeutic options for EPS are few, and randomized controlled trials non-existent [12]. Glucocorticoids have been used, especially in settings of marked inflammation [12,25,26,27]. Clinical responses to azathioprine or mycopheno-late have been reported [28], but the increased post-transplant prevalence of EPS suggests possible deleterious, profibrotic actions of calcineurin inhibitors [29]. Anecdotal reports of beneficial
treatment with tamoxifen have been attributed to inhibition of profibrotic TGF-b [30,31]. Inhibitors of the renin angiotensin aldosterone system (RAAS), widely used in PD patients and including angiotensin converting enzyme inhibitors (ACEi) and angiotensin receptor blockers (ARB), have been proposed to deter development of EPS in PD patients [32]. Indeed, RAAS inhibition in rat models has reduced angiogenesis and peritoneal thickening [32], and retarded or reduced progression from simple fibrosis to a condition resembling EPS [33]. However, severe EPS cases characterized by enteral obstruction or ileus usually require urgent surgical enterolysis and debridement. Although the outcomes of acute surgical intervention are often favorable, EPS recurs in up to 23% of these post-surgical patients [12,34].
Models of peritoneal fibrosis in rats and mice [35] have been generated by peritoneal insertion of foreign bodies [36], by peritoneal instillation of peritoneal dialysate containing glucose oxidation products for periods up to 3 weeks [37], by peritoneal instillation of inflammatory agents such as chlorhexidine gluconate [38], and by adenovirus-driven overexpression of TGF-b1 [39]. These models have offered opportunities for unbiased examina-tions of changes in global gene expression [36,37,38] that might shed light on the pathogenesis of peritoneal fibrosis. However the relationships between these short-term rodent models and the human conditions of PD-associated slowly progressive peritoneal fibrosis or the more serious and aggressive EPS remain unclear.
Therefore, we have performed a pilot study to compare transcriptomes of fresh-frozen peritoneal biopsy samples from EPS patients with those of PD patients without EPS, and with those of uremic patients (Uremic) prior to initiation of dialysis. We employed systems biology and interactive network analyses to identify pathways and interactive networks enriched with EPS-dysregulated genes, to establish the feasibility of using this approach to unravel pathophysiological mechanisms of EPS development in PD patients. This pilot study lays an empiric foundation for future investigations to understand biological mechanisms of EPS and to identify novel prognostic and therapeutic biomarkers.
Methods
Sample accrual
[23,25,40]. Shortly after excision, tissue samples were washed in 0.9% saline solution, placed in RNAlater (Ambion, Woodlands, TX) for 12 hours at room temperature, then stored at 280uC. Clinical and laboratory data were recorded for all patients. Clinical data included peritoneal transporter status, peritoneal dialysis efficiency, and number of peritonitis episodes.
RNA isolation from fresh-frozen (FF) tissue
RNA was isolated from fresh-frozen tissues using Trizol reagent (Invitrogen, Carlsbad, CA). Frozen tissue samples were homoge-nized in 1 ml Trizol reagent using a rotor-stator homogenizer (Tissue Tearor, BioSpec Products, Bartlesville, OK) for 1 minute. After chloroform extraction of the homogenate, the aqueous RNA-containing supernatant was twice ethanol-precipitated and resuspended in nuclease-free water. RNA concentration was measured by UV spectrophotometry (NanoDrop ND-1000, NanoDrop Technologies, Wilmington, DE). RNA integrity was assessed using the Agilent 2100 Bioanalyzer (Agilent Technologies, Santa Clara, CA).
cDNA synthesis
Tissue RNA samples were DNAse-treated (DNA-free kit, Applied Biosystems, Carlsbad, CA, Foster City, CA), and 250 ng total RNA from each specimen was reverse-transcribed using the High Capacity cDNA Reverse Transcription Kit (Applied Biosystems) for 10 min at 25uC, 120 min at 37uC, and 5 min at 85uC in a GeneAmp PCR System 2700 thermal cycler (Applied Biosystems). Resultant cDNA samples were diluted 10-fold.
Quantitative reverse transcriptase polymerase chain reaction (qRT-PCR) for individual gene expression assays
qRT-PCR was performed in duplicate with TaqMan gene expression kits and TaqMan Fast Universal PCR master mix (2x) using the ‘‘fast protocol’’ performed on the 7500 Fast Real-Time PCR System (Applied Biosystems) in bar-coded MicroAmp 96-well plates (Applied Biosystems), per manufacturer’s instructions. The gene products analyzed included Thrombospondin 1 (THBS1), Matrix Metalloproteinase 2 (MMP2), Leptin (LEP), Retinol-Binding Protein 4 (RBP4), Runt-Related Transcription Factor 2 (RUNX2), Intercellular Adhesion Molecule 1 (ICAM-1), aSmooth Muscle Actin (ACTA2), Fibronectin 1 (FN1), Collagen 1a1 (Col1a1), and Sulfatase 1 (SULF1).b-actin (ACTB) was used as an endogenous control.
DNA microarrays
Total RNA was reverse transcribed into cDNA using the Ovation Pico WTA System (NuGen Technologies, San Carlos, CA). cDNA samples were cleaved and 39-biotinylated using the Encore Biotin Module (NuGen Technologies, San Carlos, CA), yielding biotinylated single-stranded cDNA probes of 50–100 nt in length. The probe mix was hybridized with the GeneChip Human Genome HT U133 Plus PM Array plate (Affymetrix, Santa Clara, CA), presenting .54,000 target probe sets representing 47,000 transcripts encoding .33,000 well characterized human genes. Microarray analysis was conducted by the Beth Israel Deaconess Medical Center Genomics and Proteomics Center according to standard Affymetrix protocol, using a high throughput hybridiza-tion and scanning system. The quality of hybridized chips was assessed using Affymetrix guidelines based on PM mean, 39to 59 ratios for beta-actin and GAPDH, and values for spike-in control transcripts. We also monitored sample reproducibility by chip- to-chip correlation and signal-to-noise ratio (SNR) methods for replicate arrays using the bioconductor package,
arrayQuality-Metrics [41]. All high quality arrays were included for unsuper-vised and superunsuper-vised bioinformatics analysis.
To obtain signal values, chips were further analyzed using the Robust Multichip Average (RMA) method in R using Bioconduc-tor and associated packages. RMA performed background adjustment, quantile normalization and final summarization of 11 oligonucleotides per transcript using the median polish algorithm [42]. Unsupervised analysis was performed using Principal Component Analysis (PCA), which projects multivariate data objects onto a lower dimensional space while retaining as much of the original variance as possible [43,44]. Before PCA, transcripts were filtered to include only those with absolute expression$10 in at least 10% of samples. When comparing two groups of samples to identify genes enriched in a given phenotype, i.e. enriched in Uremic vs. both EPS and PD, differentially expressed genes were defined as those with LCB.2, serving as a stringent estimate of the FC [45]. (LCB is defined as the 90% Lower Confidence Bound of the fold change (FC) between the two groups, providing 90% confidence that the actual FC exceeds the threshold LCB).
Self Organizing Maps (SOM)
Identification of functionally related genes differentially ex-pressed in the profiles of EPS, or in the profiles of both EPS and
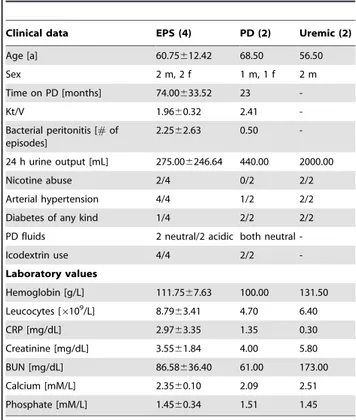
Table 1.Patient characteristics.
Clinical data EPS (4) PD (2) Uremic (2)
Age [a] 60.75612.42 68.50 56.50
Sex 2 m, 2 f 1 m, 1 f 2 m
Time on PD [months] 74.00633.52 23
-Kt/V 1.9660.32 2.41
-Bacterial peritonitis [#of episodes]
2.2562.63 0.50
-24 h urine output [mL] 275.006246.64 440.00 2000.00
Nicotine abuse 2/4 0/2 2/2
Arterial hypertension 4/4 1/2 2/2
Diabetes of any kind 1/4 2/2 2/2
PD fluids 2 neutral/2 acidic both neutral
-Icodextrin use 4/4 2/2
-Laboratory values
Hemoglobin [g/L] 111.7567.63 100.00 131.50
Leucocytes [6109/L] 8.7963.41 4.70 6.40
CRP [mg/dL] 2.9763.35 1.35 0.30
Creatinine [mg/dL] 3.5561.84 4.00 5.80
BUN [mg/dL] 86.58636.40 61.00 173.00
Calcium [mM/L] 2.3560.10 2.09 2.51
Phosphate [mM/L] 1.4560.34 1.51 1.45
Clinical data and laboratory values of (n) patients, collected before the surgeries that allowed collection of peritoneal biopsy samples. Values are shown as means6s.e.m. for the EPS group and as means for the smaller PD and Uremic groups. Smoking history was not stratified by duration. Uremic group 24 h urine output was higher than that of the combined PD and EPS groups (p,0.001). Arterial hypertension was defined as resting arterial blood pressure $140/90 mmHg. Acidic PD solutions were lactate-buffered with pH 5.0–5.5. Neutral (multicomponent) solutions were of pH 6.5. Icodextrin status was listed as positive if used at any time during the course of PD.
EPS, Encapsulating peritoneal sclerosis; PD, Peritoneal dialysis; CrP, C reactive protein; BUN, blood urea nitrogen.
PD as compared to Uremic, was by self-organizing map (SOM) analysis of the differentially expressed genes. We performed SOM clustering on transcript expression values using Pearson correla-tion coefficient-based distance metrics and a target of 40 groups. SOM allowed grouping of gene expression patterns into an imposed structure in which adjacent clusters are related, thereby identifying sets of genes that follow common expression patterns (transcription signatures) across different conditions [45,46].
Pathways and interactive network analysis
Ingenuity Pathway Analysis (IPA 7.0, Ingenuity Systems, Inc., Redwood City, CA) was used to identify pathways and interaction networks significantly affected by genes with expression changes specifically associated with EPS or with both EPS and PD. The knowledge base of this software consists of functions, pathways and network models derived by systematic exploration of the peer-reviewed scientific literature. IPA analysis calculates a P-value for each pathway according to the fit of user data to the IPA database, using a one-tailed Fisher exact test (http//www.ingenuity.com). Pathways with multiple test-corrected P-values,0.05 were con-sidered significantly affected.
An IPA score [(2log(P value)].2 indicates a probability.99% that the affected network was not generated at random, but reflects statistically (and biologically) meaningful relationships among a set of genes with specifically altered expression. The ability to rank networks based on relevance to the queried data sets allows network prioritization according to highest predicted impact on the disease process.
Immunohistochemistry
Deparaffinized, rehydrated tissue sections were incubated in Peroxidase Blocking Solution (S 2023, DAKO, Hamburg, Germany). Immunostaining was performed with a TechMate 500 Plus (DAKO), using a dextran-coated peroxidase-coupled polymer system (Dako REALTM EnVisionTM Detection Kit, Peroxidase/DAB+, Rabbit/Mouse, K 5007, DAKO). The primary antibody was rabbit monoclonal anti-human collagen 1 a1 (AB292, Abcam, Cambridge, MA) diluted 1:100 in DAKO S 2022 diluent. Skin tissue from a human non-diabetic leg served as a positive tissue control. Omission of primary antibody served as negative control. Adjacent tissue sections were stained with Hematoxylin and Eosin (H&E).
Semiquantitative analysis of Collagen 1 a 1 immunostaining was performed within defined areas from 0–100mm and from
100–200mm inward from the mesothelial tissue edges towards the
adventitia, using ImageJ 1.46 (NIH). Color images recorded by an Olympus BX41 microscope equipped with an Olympus DP71 camera were converted to 32-bit black and white. Immunostaining detection threshold was zeroed at background staining intensity, and ranged from 0–255 arbitrary units. Measurements were recorded at three or more discreet locations within each specimen. Scaled intensity values in the region 0–100mm from the
mesothelial edge were divided by the intensity values in the adjacent region 100–200mm from the edge. The mean intensity
ratios for each group were normalized to that of the Uremic group, to which was assigned a relative intensity ratio value of 1.0.
Statistical Analysis
Clinical data and laboratory values were compared by ANOVA (Sigmaplot 11.0, Systat Software Inc., San Jose, CA). Differences in results were considered statistically significant for P,0.05.
Results
Patient characteristics
Tissue samples were available from 8 patients: 4 with encapsulating peritoneal sclerosis (EPS, 2 males and 2 females, of mean age 60.8 yrs and mean PD duration 74634 months), 2 chronic peritoneal dialysis patients (PD, 1 male and 1 female, of mean age 68.5 yrs and mean PD duration 23 months), and 2 male Uremic patients of mean age 56.5 yrs, as yet undialyzed (Table 1, Table S1). Uremic patients had an estimated glomerular filtration rate (eGFR),15 mL/min/1,73 m2 body surface area. Residual renal function (urine output, RRF) was 2756246 mL in the EPS group, 440 mL for the PD group, and 2000 mL in the Uremic group (p,0.01 Uremic vs. both groups). Additional clinical characteristics are summarized in Table 1 and (for individual patients) Tables S2a and S2b. Serum chemistries are presented in Table S1.
DNA microarray analysis - unsupervised analysis
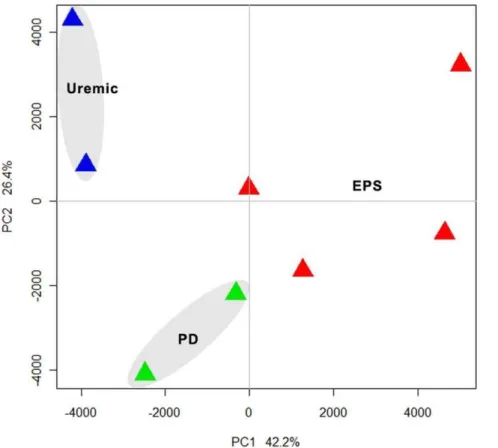
Unsupervised analysis was performed on ,11,500 transcripts after preprocessing and normalization of high quality DNA expression data. By principal component analysis, we demonstrat-ed that samples separatdemonstrat-ed according to EPS status along primary component (PC) 1, which accounted for 42.2% of the variation between samples. The analysis revealed three distinct clusters of gene expression by principal component analysis (PCA) (Figure 1), consistent with the three clinical groups.
Identification of genes significantly dysregulated only with EPS or both EPS and PD
Supervised analysis applying a 90% lower confidence bound of the fold change (LCB of FC), and expressed as corrected fold-change.2.0, revealed 531 genes differentially expressed between EPS and PD groups, 557 genes differentially expressed between EPS and Uremic groups, and 816 genes differentially expressed between PD and Uremic groups (Figure 2A). Tables S2, S3, S4 present the 50 genes most highly differentially expressed in pairwise comparisons of the three clinical groups. The group of genes upregulated in EPS compared to PD is dominated by genes involved in immunological processes (e.g. MHC class II and associated proteins). The comparison of EPS to the Uremic group featured upregulation of genes encoding collagens and other matrix proteins, and downregulation of lipid metabolism genes such as glycerol-3-phosphate acyltransferase (,20-fold). In con-trast, comparison of PD with Uremic reveals significant upregula-tion of lipid metabolism genes (20-fold increased glycerol-3-phosphate acyltransferase) and downregulation of matrix metab-olism genes, including integrins and collagens.
The Venn diagram of Figure 2A shows that 228 transcripts are differentially expressed in both the comparisons between EPS and the Uremic control group and between PD and Uremic groups, and these represent a candidate transcription signature for peritoneal fibrosis. The Venn diagram also depicts a set of 641 transcripts that are differentially expressed uniquely in EPS as compared to PD or Uremic, and so might include candidate genes linked to the pathological progression from uremic changes, through the simple peritoneal fibrosis of PD, and on to EPS.
When using gene clustering and self-organizing maps (SOM) to detect groups of differentially expressed genes with similar expression patterns, we arbitrarily drew 40 separate maps according to Pearson correlation coefficient-based distance metrics (Figure S1). Evaluation of the maps revealed groups of similarly structured expression patterns, allowing selective merger of patterns depicting specific dysregulation in EPS vs. both PD and
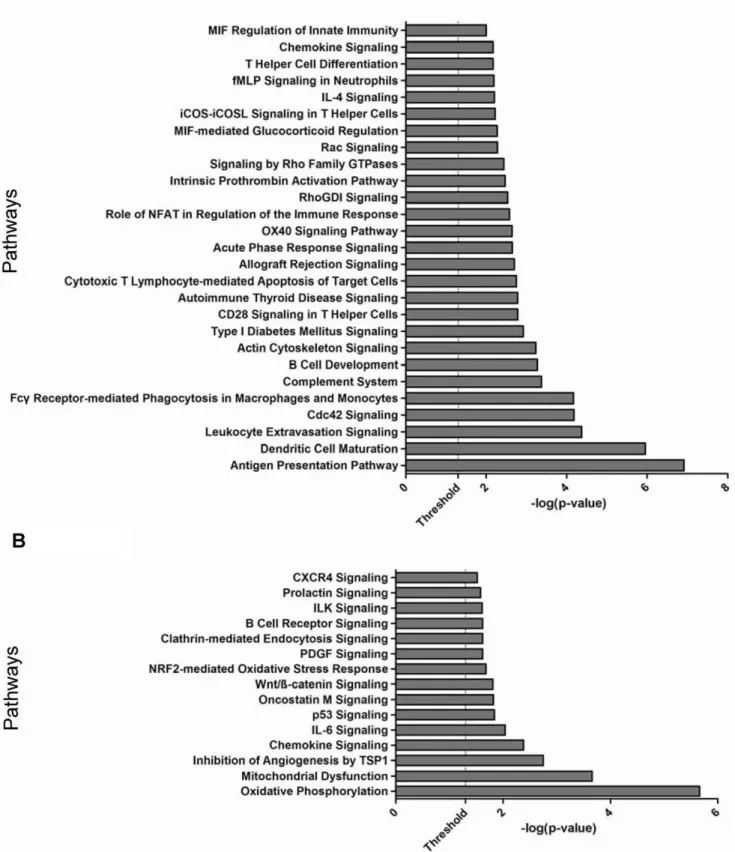
Figure 3. Pathway enrichment analysis of differentially expressed genes. A.Genes differentially expressed only in EPS as compared to PD and Uremic groups.B. Genes differentially expressed in both EPS and PD groups as compared to the Uremic group. Each bar represents a significantly enriched pathway as determined by Fisher’s Exact Test P value [depicted on the X-axis as2log10(P value)]. The analysis for canonical pathways was performed using Ingenuity Systems software (www.ingenuity.com).
Uremic, or dysregulation in both EPS and PD as compared to Uremic. The analysis identified a set of 316 transcripts differen-tially expressed in both EPS and PD as compared to Uremic (fibrosis signature) (Figure 2B). This analysis also identified another set of 219 transcripts specifically differentially expressed in EPS vs. PD as well as in EPS vs. Uremic (EPS Signature) (Figure 2C).
Canonical pathways analysis of EPS and Disease Signatures
We performed canonical pathways enrichment analysis (IPA 7.0) to gain further insight into the functional pathways associated with genes dysregulated only in EPS (EPS signature), and with those dysregulated in both EPS and PD (Disease signature). EPS-associated genes were significantly over-represented (P val-ue,0.05) in pathways related to immune response, inflammation and cytoskeleton signaling, including‘‘antigen presentation’’, ‘‘Dendritic cell maturation’’, ‘‘B cell development’’, ‘‘complement system’’, ‘‘chemokine signaling’’ and ‘‘humoral and cellular immunity’’(Figure 3A). Most of the genes in these pathways were upregulated in EPS, suggesting enhanced activity of innate immune and inflammation pathways. Pathway analysis of the genes differentially expressed in both the EPS vs. Uremic and the PD vs. Uremic comparisons showed significant association with pathways involved in cell signaling, immune response and metabolism, including‘‘Oxidative Phosphor-ylation’’, ’’Mitochondrial Dysfunction’’, ‘‘Oncostatin M-’’, ‘‘ILK-’’, ‘‘CXCR4-’’and‘‘PDGF -’’signaling (Figure 3B).
EPS impacts critical molecules and networks linked to inflammation, immunological response, and cell proliferation
To integrate a functional view of critical regulatory molecules associated with EPS, we performed interactive network analysis on the 228 genes specifically dysregulated in EPS tissue specimens (Figure 2C). The Ingenuity Pathways Analysis tool was applied to generate interaction networks based on known functional interac-tions such as protein-protein interacinterac-tions or gene regulation interactions (Figure 4). The analysis identified 8 different networks that were significantly affected in EPS with a score.20 (2log 10 [Fisher’s Exact Test]). Networks of related function were merged to generate more comprehensive networks. Three different networks related to cell assembly and organization and connective tissue and skeletal muscle tissue disorders were merged to generate an integrated view of cell cycle-related dysregulation in EPS tissue (Figure 4A), featuring the NF-kB, collagen, and ERK1/2 genes as major critical regulatory nodes. Another EPS-associated compre-hensive network merging subnetworks linked to cell growth and proliferation and to carbohydrate metabolism (as in gastrointes-tinal and immunological diseases) features the PI3K, IFNcand MAPK1 genes as major regulatory focus nodes. These regulatory focus nodes are likely critical to network function, such that therapeutic (or pathologic) alteration of expression of these genes predicts perturbation of the entire network.
EPS and PD both impact critical molecules and networks associated with inflammatory disease, metabolism, cell motility, and cell signaling
To gain further insight into functional consequences of genes that are altered both in both EPS and PD as compared to the Uremic group, we again performed IPA interactive network analysis, identifying 8 different networks significantly affected in both EPS and PD compared to the Uremic control group with a significance score.20. Three networks related to inflammatory and immunological diseases were merged to identify critical regulatory genes (Figure 5A). The resulting merged network highlighted NFKB, JUN, SP1 as critical regulatory molecules. The independent merged network in Figure 5B is enriched in genes involved in lipid metabolism, cellular assembly and movement, and cell death, and reveals the PI3K, AKT and TP53 genes as major regulatory focus nodes.
qRT-PCR Validation of DNA array data
Selected cases of differential gene expression were validated by qRT-PCR assays.b-actin was used as an endogenous ‘‘control’’ transcript. The data were analyzed using the 22DCTcalculation, and then normalized to the Uremic group, for which relative gene expression = 1.0. The results of the DNA chip array are presented as mean raw signal intensities. Col1a1 showed.20-fold upregula-tion in EPS over Uremic and a 2.5-fold increase in gene expression over PD as judged by qRT-PCR, while the DNA chip array showed .5-fold transcript induction in EPS over Uremic and ,1.5-fold upregulation over PD (Figure 6).a-Smooth muscle actin (ACTA2), Sulfatase 1 (SULF1) and Intracellular adhesion molecule 1 (ICAM1) exhibited similar expression patterns (Figure S2), with EPS showing the highest levels of transcript induction. Fibronectin 1 (FN1) and Thrombospondin 1 (THBS1) showed yet greater upregulation in EPS compared to EPS and Uremic control groups (Figure 6), whereas Retinol-binding protein 4 (RBP4) (Figure 6) and Leptin (LEP) (Figure S3) were substantially downregulated in both EPS and PD groups compared to the Uremic control group (figure 6). The DNA array results generally correlated well with the qRT-PCR data. However, whereas array data indicated highest expression of Runt-related transcription factor 2 (RUNX2) and Matrix metalloproteinase 2 (MMP2) in the EPS group, qRT-PCR indicated highest expression in the PD group (Figure S4).
Immunostaining for Collagen 1a1 (Col1a1)
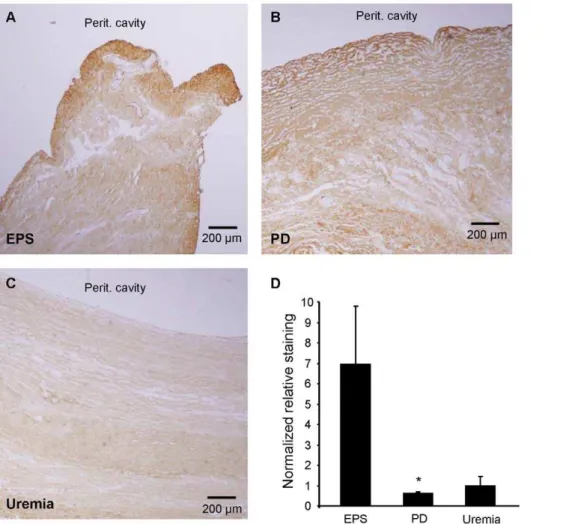
To determine protein expression of Col1a1, one of the more highly upregulated genes in EPS, we performed anti-Col1a1 immunohistochemical staining of formalin-fixed, paraffin-embed-ded tissue sections corresponding to the fresh frozen specimens from which RNA was isolated. EPS and PD tissues showed marked immunostaining for Col1a1, indicating fibrosis. In most of the EPS and PD samples the mesothelium was not detectable. PD sections were strongly and homogeneously stained with Col1a1 throughout the entire specimen. In contrast, EPS samples exhibited pronounced Col1a1 immunostaining predominantly in the area of the (most superficial) submesothelial zone. We
Figure 4. Network representation of cellular functions differentially expressed specifically in EPS but not in PD or Uremic groups. A.Network related to cell assembly and organization as well as to connective tissue and skeletal muscle tissue disorders. This network has NF-kB, collagen, and ERK1/2 genes as primary regulatory focus nodes.B.Network enriched with genes involved in cellular growth and proliferation, carbohydrate metabolism, and gastrointestinal and immunological diseases. This network has PI3K, IFNcand MAPK1 genes as primary regulatory focus nodes. Ingenuity Pathways Analysis software was used to generate comprehensive gene networks that merged affected networks of related function. Downregulated genes are shown in green, upregulated genes in red. All networks shown were significantly affected in EPS with a score.15 (2log 10[Fisher’s Exact Test]).
quantified the extent of the latter staining pattern by making staining intensity measurements in the submesothelial zone (0– 100mm) and the adjacent, deeper zone (100–200mm from the surface of the tissue block zone moving towards the adventitial layer). The normalized submesothelial staining intensity of the 0– 100mm zone relative to the deeper 100–200mm zone was 7-fold higher in the EPS group than in the PD or Uremic groups (Figure 7). Similar zonal analyses with zone thicknesses of 200 and or 500mm yielded the same result.
Discussion
EPS is among the most serious complications of chronic PD. Although PD duration seems to be a major risk factor, spontaneous EPS has been reported, and the causes of EPS remain obscure. The factors that govern progression from the common PD-associated condition of simple peritoneal fibrosis to the rare but aggressive condition of EPS are poorly understood. The pilot study presented here is the first comparison of transcriptomes of human peritoneal tissues taken from patients with EPS, PD patients without EPS, and predialytic uremic patients. The three groups show distinct gene expression patterns that allow their separation by principal component and heat map analyses. The results constitute proof-of-principle for a larger-scale study that could generate hypotheses for future EPS research, leading to more rigorous biochemical or cell biologic diagnostic criteria for EPS, and to definition of prognostic markers. Correlation of these and future transcriptome data with proteo-mics studies from peritoneal tissue and fluid would add further insight into EPS disease pathways and could improve early diagnosis and prevention.
Patients and tissue samples
The samples examined in this study were the first fresh-frozen tissue samples collected by the Peritoneal Biobank at the Robert-Bosch Hospital in Stuttgart, Germany, as part of a comprehensive database of tissues, serum, whole-blood and peritoneal effluent samples from PD patients, PD patients with EPS, and control patients without and with uremia. Collection of formalin-fixed, paraffin-embedded peritoneal tissue blocks had been initiated previously. The early stage of fresh tissue collection is reflected in the small sample sizes of the current study and the imperfect clinical matching of specimens in terms of PD duration, number of peritonitis episodes, Kt/V, systemic baseline inflammatory state, and use of acidic dialysate likely containing glucose oxidation products [47,48,49,50]. Consistent with their predialytic status, patients of the Uremic control group exhibited higher values of residual urine excretion, blood hemoglobin, serum creatinine, BUN, and calcium than did PD patients (p,0.05 for BUN and calcium) or EPS patients (Table 1).
The limited number and mass of patient samples available for this pilot study also prevented uniformity of dominant tissue histological features of the RNA source tissues within and among clinical groups. Later studies might employ laser capture microdissection to facilitate comparison of histologically similar regions within and among groups.
Transcriptome patterns and pathways
Transcriptome results exhibited good inter-individual agree-ment. Unsupervised analysis identified three distinct gene expres-sion patterns consistent with the samples’ clinical groupings (Figure 1). Several hundred genes were identified by a moderately stringent criterion as differentially expressed in each pairwise comparison (Figure 2A). Subsets of these genes predictably differentiated the Uremic group from both EPS and PD groups (Figure 2B). However, another subset served to differentiate EPS from both PD and the Uremic group (Figure 2C).
The differentially expressed genes could be organized into canonical pathways that distinguished EPS as a separate group from both the PD and the Uremic groups (Figure 3A), and into pathways that distinguished the Uremic control group from both EPS and PD groups (Figure 3B). The pathways uniting genes upregulated uniquely in EPS are dominated by pathways involved in cellular and humoral defense, including those controlling antigen presentation, dendritic cell maturation, phagocytic func-tion, and leukocyte degranulation. The EPS-upregulated degran-ulation product, lysozyme, is a component of renal amyloid, but histological evidence of amyloid has not been observed in EPS. Additional serological, immunocyte-related, and innate immune response pathways are also regulated preferentially in EPS (Figure 3A). These results are consistent with the reported contribution of peritoneal complement activation to peritoneal fibrin deposition and early peritoneal fibrosis in a murine model [50,51]. They are likewise consistent with the reported local proliferation of alternatively activated MQ2 macrophages without macrophage recruitment from distant sites [52]. These macro-phages can secrete proinflammatory mediators during episodes of infectious peritonitis [53], associated with increased risk of EPS. In addition, macrophages express the EPS-upregulated scavenger receptor A (SRA/MSR1), previously associated with fibrotic processes [54]. The elevation in EPS tissue of genes encoding neurotropin receptors and their ligands GDNF, BDNF, neurotro-phin-3 and MANF (not shown) is also consistent with increased macrophage activation or function. Coincident upregulation of matrix protease inhibitors such as TIMP1 and SERPINH1 and proteases such as ADAM9 and MM2 is also apparent (not shown). The pathways shared by EPS and PD groups that differentiate them both from the Uremic group (Figure 3B) feature oxidative mitochondrial metabolism and dysfunction, and a variety of cell signaling pathways. PD is known to promote malnutrition and excessive loss of free amino acids, essential fatty acids [55], and albumin [56], leading to muscle wasting [57]. The downregulation of leptin mRNA in peritoneal tissues from both EPS and PD patients (Figure S2) may reflect malnourishment in chronic PD patients, as serum leptin levels fall during long-term fasting [58]. In contrast, elevated serum and dialysate leptin have been reported during chronic PD [59,60]. Moreover, treatment of hyperacutely uremic rats with high glucose PD solutions produced hyperlepti-nemia, and acute exposure of 3T3-L1 adipocytes to high-glucose PD solution increased leptin mRNA levels [61,62]. The striking downregulation of retinol-binding protein 4 (RBP4) mRNA to ,10% of Uremic group levels in both PD and EPS groups has
Figure 5. Network representation of the cellular functions affected specifically in both EPS and PD groups, but not in the Uremic group. A.Network related to inflammatory and immunological diseases, including NF-kB, JUN, and SP1 genes as primary regulatory focus nodes.B.
Network enriched with genes involved in lipid metabolism, cellular assembly and movement, and cell death, including PI3K, AKT and TP53 genes as primary regulatory focus nodes. The Ingenuity Pathways Analysis tool was used to generate comprehensive gene networks that merged with affected networks of related function. Downregulated genes are shown in green, upregulated genes in red. Geometric shapes are associated with individual gene products according to Ingenuity definitions. All networks shown were significantly affected in EPS with a score.20 (2log 10[Fisher’s Exact Test]).
been associated with lean body mass [63] and with ovarian cancer [64], but impaired glucose tolerance and obesity were associated with elevated serum RBP4. RBP4 has not been studied in peritoneal dialysis patients.
Networks of differentially expressed genes
Figures 4 and 5 provide network views of the interactions of differentially expressed gene products. Figure 4A highlights the importance of multiple collagen isoforms, consistent with the
Figure 6. mRNA expression levels of selected gene products determined through qRT-PCR correlate well with corresponding data from the DNA chip array.Collagen 1a1 (Col1a1), Fibronectin 1 (FN1), and thrombospondin 1 (THBS1) were highly upregulated in EPS compared to PD and Uremic groups, while retinol-binding protein 4 (RBP4) was highly downregulated in EPS and PD groups compared to the Uremic group.A.,
C.,E., andG.Normalized mRNA expression levels determined through qRT-PCR of indicated gene products. Individual gene expression levels were calculated using the equation 22DCT
withb-actin (ACTB) as endogenous control. Mean gene expression levels of biological groups were normalized to the Uremic group, defining the relative gene expression in this group as 1.0.B.,D.,F., andH.Mean raw signal intensity of indicated gene products calculated from DNA array probe signals.
exacerbated fibrotic processes underlying EPS. COL1a1 mRNA showed the highest proportional increase in the EPS group (Figure 6 and Table S3). Col1a1 is not only a major component of fibrotic peritoneal tissue (Figure 6), but has also been reported as a marker of peritoneal fibrocytes together with CD45/PTPRC [65], another gene product upregulated in EPS (Table S2). Also upregulated were matrix proteases and protease inhibitors, and thrombospondin 1 (THBS1), activated through a NF-kB signaling pathway which acts as one of the major regulatory nodes in the presented networks [66]. THBS1 is involved in physiological tissue repair and extracellular matrix remodeling as a regulator of TGF-b-mediated fibrosis [67], and as a proinflammatory and profibrotic factor in chronic kidney disease and kidney fibrosis [68]. Also markedly upregulated was sulfatase 1 (SULF1) mRNA (Figure 6), which like SULF2 modulates the sonic hedgehog (Shh), wingless (Wnt), fibroblast growth factor (FGF), and vascular endothelial growth factor (VEGF) signaling pathways. The highly upregulated Fibronectin 1 transcript (Figure 6) encodes a ubiquitously expressed extracellular matrix protein involved in wound healing [69,70] and is overexpressed in fibrotic tissues [71,72], induced in fibroblasts and myofibroblasts, and implicated in glomerular and interstitial renal fibrosis [73].
The myofibroblast marker a-smooth muscle actin (ACTA2) mRNA was also upregulated (Figure S2). ACTA2 has been implicated in TGF-b-induced epithelial-to-mesenchymal transi-tion (EMT) in bronchial cells in a cellular model of asthma [74], and in numerous other models of tissue fibrosis. EMT is believed to play an important role in EPS, especially in postulated mesothelial cell transformation into myofibroblasts [75]. One of the important pathways through which EMT is induced is the ERK1/2 pathway [76], another central regulatory node in the EPS-related networks (Figure 4A). The transcription factor TWIST, upregulated 5-fold in PD and 2.5-fold in EPS (not shown), has been widely implicated as a driver of EMT, most recently in a mouse model of peritoneal fibrosis [77]. Lysyl oxidase, best known for its post-translational lysine hydroxylation of collagen, was recently identified as a transcriptional activator of TWIST and TWIST-mediated EMT [78]. Interestingly, expres-sion of the closely related LOXL2 transcript was 4.2-fold higher in the EPS group than in the PD group (Table S2). LOXL2 transcription can be increased by VEGF and by high glucose [79]. LOXL2 can deaminate Lys4 in histone H3 [80], but at least some of its effects as an inhibitor of differentiation are independent of its enzymatic activity [81].
Figure 7. Immunohistochemical expression patterns of collagen 1a1 (Col1a1) polypeptide in peritoneal biopsy samples.Peritoneal
biopsy sections from (A.) EPS, (B.) PD, and (C.) Uremic groups were analyzed for Col1a1 immunolocalization. Each panel indicates location of peritoneal cavity adjacent to the tissue surface.D.Normalized ratios of staining intensities measured in rectangular areas of thickness depth 0– 100mm and 100–200mm from the peritoneal cavity tissue surface. P,0.05 for EPS vs. PD (One Way ANOVA with Dunn’s Multiple Comparison
post-test).
Several transcriptome studies of rodent peritoneal fibrosis models have recently appeared. Yokoi et al [38] suggested that pleiotrophin plays an important role in both inflammation and fibrosis following acute chlorhexidine gluconate-induced peritone-al injury in mice. Pleiotrophin upregulation was not observed in tissue from our EPS patients compared to chronic PD or Uremic groups. However, observations of elevated procollagen, CCl5, Cxcl16, and Adam12 in that mouse model [38] were also noted in our human EPS specimens. Imai et al described a rat model in which intraperitoneal instillation of high-dose glucose-degradation products led to peritoneal fibrotic changes consistent with a role for EMT in development of peritoneal fibrosis [37]. Le et al induced peritoneal fibrosis in rats via foreign body insertion [36]. As in our observations with human tissue, they observed upregulation of a-smooth muscle actin and other myofibroblast markers, as well as overexpression of profibrotic agents such as TGF-b and CTGF. However, interpretation of mechanistic comparisons between animal models of induced peritoneal fibrosis and PD-associated peritoneal fibrosis and EPS in humans remains difficult.
Col1a1 IHC Immunohistochemistry
Histochemical expression of collagen I was compared to the increased Col1a1 mRNA levels in EPS tissue. The increased Col1a1 mRNA level in EPS tissue was not paralleled by higher total Col1a1 polypeptide levels, as judged by immunostaining intensity across entire fields of view. Although EPS tissue showed greater Col1a1 expression than did Uremic group tissue, the highest levels of Col1a1 immunostaining were observed in PD tissues. In contrast to the homogeneous distribution of Col1a1 immunostaining across entire PD tissue sections, EPS samples exhibited pronounced intensification of Col1a1 immunostaining in the submesothelial compact zone (Figure 7). This pattern of higher density of fibrous tissue and pronounced accumulation of collagen 1 a 1 protein was also noted in the peritoneal submesothelial compact zone in rats after 4 weeks exposure to PD fluid [82].
Conclusion
Although EPS remains a poorly understood disease, we have demonstrated a distinct transcriptional pattern of peritoneal tissue from EPS patients that differed from those of PD patients and predialytic uremic patients. The distinct transcriptional patterns of EPS and PD tissues presented here are consistent with the hypothesis that EPS constitutes a separate disease entity, possibly requiring a ‘‘second hit’’, and not merely an exacerbation of the simple peritoneal sclerosis believed present in all PD patients. However, the data also are consistent with EPS representing a malignant acceleration of PD-associated peritoneal fibrosis influ-enced by patient-specific risk modifier genes and, possibly, by transplant and/or immunosuppression therapy.
Although our small study does not point to a principal pathogenic mechanism in EPS distinct from that of the simple peritoneal fibrosis of chronic PD, the study does serve as proof-of-principle for future array studies with peritoneal tissue from larger groups of patients. Preliminary data (not shown) indicates that the spectrum and abundance of mRNA isolated from formalin-fixed paraffin-embedded tissues from the same patients studied in this paper were very similar to those of mRNA isolated from fresh-frozen tissue (correlation coefficient .0.91). This suggests the reliability of transcriptome analysis applied to archived paraffin blocks of tissues from EPS and PD patients, especially when combined with laser capture microdissection for comparison of histologically similar regions of tissue. Similar transcriptome studies should be conducted with peritoneal dialysate fluid and
cell specimens, and with blood specimens, since accrual of samples will be easier than for peritoneal tissue samples. Moreover, definition of transcriptional signatures may prove to have value for diagnostic monitoring and prognosis. Comprehensive analysis of miRNAs will be important to include in these future studies, since they (or their antagomirs) can be easily envisioned as intraperi-toneal therapeutic agents.
Supporting Information
Table S1 Individual patient characteristics.The clinical features and laboratory values represent those of each individual patient’s last assessment before the surgical procedure that yielded the tissue samples analyzed in this study. Underlying renal diseases are abbreviated as: IgA, IgA nephropathy; GN, chronic glomerulonephritis; PaI-RPGN, pauci-immune rapid progressive glomerulonephritis; NS, nephrosclerosis; DN, diabetic nephropa-thy; FSGS, focal segmental glomerulosclerosis; MPO, pANCA-positive (myeloperoxidase) vasculitis. Smoking history was defined as positive regardless of duration. Arterial hypertension was defined as resting arterial blood pressure$140/90 mmHg. Acidic PD solutions were lactate-buffered with pH 5.0–5.5. Neutral (multicomponent) solutions were of pH 6.5. Icodextrin status was positive if used at any time during course of PD.
(DOC)
Table S2 Genes differentially expressed in EPS tissue vs. PD tissue. A.The 50 gene products most highly upregulated in EPS tissue as compared to PD tissue. B. All gene products downregulated with corrected FC.2.0 in EPS tissue compared to PD tissue.
(DOC)
Table S3 Genes differentially expressed in EPS tissue vs. Uremic tissue. A. The 50 gene products most highly upregulated in EPS tissue as compared to Uremic tissue.B.The 50 most downregulated gene products in EPS tissue as compared to Uremic tissue.
(DOC)
Table S4 Genes differentially expressed in PD tissue vs. Uremic tissue. A. The 50 gene products most highly upregulated in PD tissue as compared to Uremic tissue.B. All gene products downregulated with corrected FC.2.0 in PD tissue compared to Uremic tissue.
(DOC)
Figure S1 Selected genomic expression patterns depict-ing progression from uremia to EPS. Genes differentially expressed in any group comparison (e.g. Uremic vs. PD, Uremic vs. EPS, PD vs. EPS) were used as the seed set for Self-Organizing Map (SOM) analysis of gene expression. These differentially expressed genes were partitioned to 40 separate maps according to Pearson correlation coefficient-based distance metrics. Selected, biologically interesting SOM maps were manually clustered into 2 biologically relevant categories, each representative of at least two similar SOM patterns: EPS-specific [I, EPS vs. (PD+Uremic), left], and fibrosis-specific [II, (EPS+PD) vs. Uremic, right]. The X-axis arrays individual biological samples, and the Y-axis represents changes in gene expression on a scale from23 to+3.
(TIF)
Uremic groups, as judged both by qRT-PCR data (A,C,E) and by DNA microarray data (B,D,F). Uremic group qRT-PCR expres-sion values were normalized to a value of 1.0, andb-actin mRNA served as endogenous control. DNA array signal intensities are raw probe values.
(TIF)
Figure S3 Down-regulated gene expression in EPS determined by qRT-PCR correlates well with that measured by DNA microarray.Leptin (LEP) mRNA levels are greatly downregulated in tissues from EPS and PD patients compared to Uremic group tissues, as judged by normalized qRT-PCR data (A) and by DNA microarray data (B). Uremic group qRT-PCR expression values were normalized to a value of 1.0, and b-actin mRNA served as endogenous control. DNA array signal intensities are raw probe values.
(TIF)
Figure S4 Two examples of lower correlation between gene expression measured by qRT-PCR and by DNA microarray. Normalized Runt-related transcription factor 2 (Runx2) mRNA levels measured by qRT-PCR did not signifi-cantly differ (A), although DNA microarray suggested that
expression in EPS tissue exceeded that in Uremic group tissue (B). Normalized MMP2 mRNA levels measured by qRT-PCR suggested higher levels in EPS and PD tissues than in Uremic group tissues (C), whereas MMP2 levels detected by DNA microarray appeared higher in EPS than in PD or Uremic group tissues (D). Uremic group qRT-PCR expression values were normalized to a value of 1.0, and b-actin mRNA served as endogenous control. DNA array signal intensities are raw probe values.
(TIF)
Acknowledgments
We thank Boris E. Shmukler, Augustine Rajakumar, Dongsheng Zhang, and Jack Lawler for helpful discussion and sharing reagents.
Author Contributions
Conceived and designed the experiments: FRR SLA MKB IES ZKZ NB MDA. Performed the experiments: FRR ZKZ NB DB PF. Analyzed the data: FRR SLA MKB IES ZKZ NB DB PF SAK HRT. Contributed reagents/materials/analysis tools: SLA MKB IES ZKZ NB DB PF JL. Wrote the paper: FRR SLA MKB NB SS.
References
1. Lameire N, Van Biesen W (2010) Epidemiology of peritoneal dialysis: a story of believers and nonbelievers. Nat Rev Nephrol 6: 75–82.
2. Braun N, Alscher MD, Kimmel M, Amann K, Buttner M (2011) Encapsulating peritoneal sclerosis - an overview. Nephrol Ther 7: 162–171.
3. Kawanishi H, Shintaku S, Moriishi M, Dohi K, Tsuchiya S (2011) Seventeen years’ experience of surgical options for encapsulating peritoneal sclerosis. Adv Perit Dial 27: 53–58.
4. Ulmer C, Braun N, Rieber F, Latus J, Hirschburger S, et al. (2012) Efficacy and morbidity of surgical therapy in late-stage encapsulating peritoneal sclerosis. Surgery.
5. Latus J, Ulmer C, Fritz P, Rettenmaier B, Biegger D, et al. (2012) Encapsulating peritoneal sclerosis: a rare, serious but potentially curable complication of peritoneal dialysis-experience of a referral centre in Germany. Nephrol Dial Transplant.
6. Da Luz MM, Barral SM, Barral CM, Bechara Cde S, Lacerda-Filho A (2011) Idiopathic encapsulating peritonitis: report of two cases. Surg Today 41: 1644– 1648.
7. Koak Y, Gertner D, Forbes A, Ribeiro BF (2008) Idiopathic sclerosing peritonitis. Eur J Gastroenterol Hepatol 20: 148–150.
8. Minutolo V, Gagliano G, Angirillo G, Minutolo O, Morello A, et al. (2008) Intestinal obstruction due to idiopathic sclerosing encapsulating peritonitis. Clinical report and review of literature. G Chir 29: 173–176.
9. Johnson DW, Cho Y, Livingston BE, Hawley CM, McDonald SP, et al. (2010) Encapsulating peritoneal sclerosis: incidence, predictors, and outcomes. Kidney Int 77: 904–912.
10. Brown MC, Simpson K, Kerssens JJ, Mactier RA (2009) Encapsulating peritoneal sclerosis in the new millennium: a national cohort study. Clin J Am Soc Nephrol 4: 1222–1229.
11. Toyohara T, Ubara Y, Higa Y, Suwabe T, Hoshino J, et al. (2011) Prognosis of patients on continuous ambulatory peritoneal dialysis (CAPD) for over 10 years. Intern Med 50: 2519–2523.
12. Kawanishi H, Kawaguchi Y, Fukui H, Hara S, Imada A, et al. (2004) Encapsulating peritoneal sclerosis in Japan: a prospective, controlled, multicen-ter study. Am J Kidney Dis 44: 729–737.
13. Kawanishi H, Moriishi M (2005) Epidemiology of encapsulating peritoneal sclerosis in Japan. Perit Dial Int 25 Suppl 4: S14–18.
14. Korte MR, Habib SM, Lingsma H, Weimar W, Betjes MG (2011) Posttransplantation encapsulating peritoneal sclerosis contributes significantly to mortality after kidney transplantation. Am J Transplant 11: 599–605. 15. Braun N, Alscher DM, Schwenger V, Amann K, Bu¨ttner M (2010) Deutsches
Peritonealdialyseregister (DPR). Der Nephrologe 5: 531–534.
16. Nakamura S, Niwa T (2004) Advanced glycation end-products and peritoneal sclerosis. Semin Nephrol 24: 502–505.
17. Schwenger V, Morath C, Salava A, Amann K, Seregin Y, et al. (2006) Damage to the peritoneal membrane by glucose degradation products is mediated by the receptor for advanced glycation end-products. J Am Soc Nephrol 17: 199–207. 18. Alscher DM, Braun N, Biegger D, Fritz P (2007) Peritoneal mast cells in peritoneal dialysis patients, particularly in encapsulating peritoneal sclerosis patients. Am J Kidney Dis 49: 452–461.
19. Aoki S, Ikeda S, Takezawa T, Kishi T, Makino J, et al. (2011) Prolonged effect of fluid flow stress on the proliferative activity of mesothelial cells after abrupt
discontinuation of fluid streaming. Biochem Biophys Res Commun 416: 391– 396.
20. Aoki S, Makino J, Nagashima A, Takezawa T, Nomoto N, et al. (2011) Fluid flow stress affects peritoneal cell kinetics: possible pathogenesis of peritoneal fibrosis. Perit Dial Int 31: 466–476.
21. Augustine T, Brown PW, Davies SD, Summers AM, Wilkie ME (2009) Encapsulating peritoneal sclerosis: clinical significance and implications. Nephron Clin Pract 111: c149–154; discussion c154.
22. Braun N, Alscher DM, Fritz P, Edenhofer I, Kimmel M, et al. (2011) Podoplanin-positive cells are a hallmark of encapsulating peritoneal sclerosis. Nephrol Dial Transplant 26: 1033–1041.
23. Vlijm A, Stoker J, Bipat S, Spijkerboer AM, Phoa SS, et al. (2009) Computed tomographic findings characteristic for encapsulating peritoneal sclerosis: a case-control study. Perit Dial Int 29: 517–522.
24. Braun N, Fritz P, Ulmer C, Kimmel M, Biegger D, et al. (2012) The Definition of Histological Criteria for Encapsulating Peritoneal Sclerosis – A Standardized Approach [Abstract]. PLoS One In press.
25. Nakamoto H (2005) Encapsulating peritoneal sclerosis–a clinician’s approach to diagnosis and medical treatment. Perit Dial Int 25 Suppl 4: S30–38. 26. Kawanishi H, Harada Y, Noriyuki T, Kawai T, Takahashi S, et al. (2001)
Treatment options for encapsulating peritoneal sclerosis based on progressive stage. Adv Perit Dial 17: 200–204.
27. Yamamoto H, Nakayama M, yamamoto R, Otsuka Y, Takahashi H, et al. (2002) Fifteen cases of encapsulating peritoneal sclerosis related to peritoneal dialysis: a single-center experience in Japan. Adv Perit Dial 18: 135–138. 28. Wong CF, Beshir S, Khalil A, Pai P, Ahmad R (2005) Successful treatment of
encapsulating peritoneal sclerosis with azathioprine and prednisolone. Perit Dial Int 25: 285–287.
29. Fieren MW, Betjes MG, Korte MR, Boer WH (2007) Posttransplant encapsulating peritoneal sclerosis: a worrying new trend? Perit Dial Int 27: 619–624.
30. Korte MR, Fieren MW, Sampimon DE, Lingsma HF, Weimar W, et al. (2011) Tamoxifen is associated with lower mortality of encapsulating peritoneal sclerosis: results of the Dutch Multicentre EPS Study. Nephrol Dial Transplant 26: 691–697.
31. Braun N, Fritz P, Biegger D, Kimmel M, Reimold F, et al. (2011) Difference in the expression of hormone receptors and fibrotic markers in the human peritoneum–implications for therapeutic targets to prevent encapsulating peritoneal sclerosis. Perit Dial Int 31: 291–300.
32. Bhasin M, Yuan L, Keskin DB, Otu HH, Libermann TA, et al. (2010) Bioinformatic identification and characterization of human endothelial cell-restricted genes. BMC Genomics 11: 342.
33. Nakamoto H, Imai H, Fukushima R, Ishida Y, Yamanouchi Y, et al. (2008) Role of the renin-angiotensin system in the pathogenesis of peritoneal fibrosis. Perit Dial Int 28 Suppl 3: S83–87.
34. Kawanishi H, Ide K, Yamashita M, Shimomura M, Moriishi M, et al. (2008) Surgical techniques for prevention of recurrence after total enterolysis in encapsulating peritoneal sclerosis. Adv Perit Dial 24: 51–55.
36. Le SJ, Gongora M, Zhang B, Grimmond S, Campbell GR, et al. (2010) Gene expression profile of the fibrotic response in the peritoneal cavity. Differentiation 79: 232–243.
37. Imai T, Hirahara I, Morishita Y, Onishi A, Inoue M, et al. (2011) DNA microarray analysis of the epithelial-mesenchymal transition of mesothelial cells in a rat model of peritoneal dialysis. Adv Perit Dial 27: 11–15.
38. Yokoi H, Kasahara M, Mori K, Ogawa Y, Kuwabara T, et al. (2012) Pleiotrophin triggers inflammation and increased peritoneal permeability leading to peritoneal fibrosis. Kidney Int 81: 160–169.
39. Margetts PJ, Bonniaud P, Liu L, Hoff CM, Holmes CJ, et al. (2005) Transient overexpression of TGF-b1 induces epithelial mesenchymal transition in the rodent peritoneum. J Am Soc Nephrol 16: 425–436.
40. Honda K, Nitta K, Horita S, Tsukada M, Itabashi M, et al. (2003) Histologic criteria for diagnosing encapsulating peritoneal sclerosis in continuous ambulatory peritoneal dialysis patients. Adv Perit Dial 19: 169–175. 41. Kauffmann A, Gentleman R, Huber W (2009) arrayQualityMetrics–a
bioconductor package for quality assessment of microarray data. Bioinformatics 25: 415–416.
42. Irizarry RA, Hobbs B, Collin F, Beazer-Barclay YD, Antonellis KJ, et al. (2003) Exploration, normalization, and summaries of high density oligonucleotide array probe level data. Biostatistics 4: 249–264.
43. Wang C, Rao N, Wang Y (2007) [Principal component analysis for exploring gene expression patterns]. Sheng wu yi xue gong cheng xue za zhi = Journal of biomedical engineering = Shengwu yixue gongchengxue zazhi 24: 736–741. 44. Yeung KY, Ruzzo WL (2001) Principal component analysis for clustering gene
expression data. Bioinformatics 17: 763–774.
45. Li C, Wong WH (2001) Model-based analysis of oligonucleotide arrays: expression index computation and outlier detection. Proceedings of the National Academy of Sciences of the United States of America 98: 31–36.
46. Tamayo P, Slonim D, Mesirov J, Zhu Q, Kitareewan S, et al. (1999) Interpreting patterns of gene expression with self-organizing maps: methods and application to hematopoietic differentiation. Proc Natl Acad Sci U S A 96: 2907–2912. 47. Ayuzawa N, Ishibashi Y, Takazawa Y, Kume H, Fujita T (2012) Peritoneal
morphology after long-term peritoneal dialysis with biocompatible fluid: recent clinical practice in Japan. Perit Dial Int 32: 159–167.
48. Garcia-Lopez E, Lindholm B, Davies S (2012) An update on peritoneal dialysis solutions. Nat Rev Nephrol 8: 224–233.
49. Baroni G, Schuinski A, de Moraes TP, Meyer F, Pecoits-Filho R (2012) Inflammation and the peritoneal membrane: causes and impact on structure and function during peritoneal dialysis. Mediators Inflamm 2012: 912595. 50. Mizuno M, Ito Y, Mizuno T, Harris CL, Suzuki Y, et al. (2012) Membrane
complement regulators protect against fibrin exudation increases in a severe peritoneal inflammation model in rats. Am J Physiol Renal Physiol 302: F1245– 1251.
51. Mizuno T, Mizuno M, Morgan BP, Noda Y, Yamada K, et al. (2011) Specific collaboration between rat membrane complement regulators Crry and CD59 protects peritoneum from damage by autologous complement activation. Nephrol Dial Transplant 26: 1821–1830.
52. Jenkins SJ, Ruckerl D, Cook PC, Jones LH, Finkelman FD, et al. (2011) Local macrophage proliferation, rather than recruitment from the blood, is a signature of TH2 inflammation. Science 332: 1284–1288.
53. Fieren MW (2012) The local inflammatory responses to infection of the peritoneal cavity in humans: their regulation by cytokines, macrophages, and other leukocytes. Mediators Inflamm 2012: 976241.
54. Wang W, He B, Shi W, Liang X, Ma J, et al. (2012) Deletion of scavenger receptor A protects mice from progressive nephropathy independent of lipid control during diet-induced hyperlipidemia. Kidney Int 81: 1002–1014. 55. Yerlikaya FH, Mehmetoglu I, Kurban S, Tonbul Z (2011) Plasma fatty acid
composition in continuous ambulatory peritoneal dialysis patients: an increased omega-6/omega-3 ratio and deficiency of essential fatty acids. Ren Fail 33: 819– 823.
56. Mehrotra R, Duong U, Jiwakanon S, Kovesdy CP, Moran J, et al. (2011) Serum albumin as a predictor of mortality in peritoneal dialysis: comparisons with hemodialysis. Am J Kidney Dis 58: 418–428.
57. Garibotto G, Sofia A, Saffioti S, Bonanni A, Mannucci I, et al. (2012) Effects of peritoneal dialysis on protein metabolism. Nutr Metab Cardiovasc Dis. 58. Weigle DS, Duell PB, Connor WE, Steiner RA, Soules MR, et al. (1997) Effect
of fasting, refeeding, and dietary fat restriction on plasma leptin levels. J Clin Endocrinol Metab 82: 561–565.
59. Lai KN, Lam MF, Leung JC, Chan LY, Lam CW, et al. (2012) A study of the clinical and biochemical profile of peritoneal dialysis fluid low in glucose degradation products. Perit Dial Int 32: 280–291.
60. Wojcik K, Stompor T, Krzanowski M, Miarka P, Zdzienicka A, et al. (2007) The relationships between activation of non-specific inflammatory process and malnutrition in patients on peritoneal dialysis. Med Pregl 60 Suppl 2: 114–116. 61. Matsubara K, Kiyomoto H, Moriwaki K, Hara T, Kondo N, et al. (2004) Leptin kinetics during peritoneal dialysis in acutely uraemic rats. Nephrology (Carlton) 9: 256–261.
62. Teta D, Tedjani A, Burnier M, Bevington A, Brown J, et al. (2005) Glucose-containing peritoneal dialysis fluids regulate leptin secretion from 3T3-L1 adipocytes. Nephrol Dial Transplant 20: 1329–1335.
63. Graham TE, Yang Q, Bluher M, Hammarstedt A, Ciaraldi TP, et al. (2006) Retinol-binding protein 4 and insulin resistance in lean, obese, and diabetic subjects. N Engl J Med 354: 2552–2563.
64. Lorkova L, Pospisilova J, Lacheta J, Leahomschi S, Zivny J, et al. (2012) Decreased concentrations of retinol-binding protein 4 in sera of epithelial ovarian cancer patients: a potential biomarker identified by proteomics. Oncol Rep 27: 318–324.
65. Sagara A, Sakai N, Shinozaki Y, Kitajima S, Toyama T, et al. (2011) Histone Acetyltransferase Activity Is Involved in the Pathogenesis of Experimental Peritoneal Fibrosis [Abstract]. J Am Soc Nephrol: 36A.
66. Wang HR, Chen DL, Zhao M, Shu SW, Xiong SX, et al. (2012) C-reactive protein induces interleukin-6 and thrombospondin-1 protein and mRNA expression through activation of nuclear factor-kB in HK-2 cells. Kidney Blood Press Res 35: 211–219.
67. Sweetwyne MT, Murphy-Ullrich JE (2012) Thrombospondin1 in tissue repair and fibrosis: TGF-beta-dependent and independent mechanisms. Matrix Biol 31: 178–186.
68. Bige N, Shweke N, Benhassine S, Jouanneau C, Vandermeersch S, et al. (2012) Thrombospondin-1 plays a profibrotic and pro-inflammatory role during ureteric obstruction. Kidney Int 81: 1226–1238.
69. Grinnell F (1984) Fibronectin and wound healing. J Cell Biochem 26: 107–116. 70. Valenick LV, Hsia HC, Schwarzbauer JE (2005) Fibronectin fragmentation promotes alpha4beta1 integrin-mediated contraction of a fibrin-fibronectin provisional matrix. Exp Cell Res 309: 48–55.
71. Muro AF, Moretti FA, Moore BB, Yan M, Atrasz RG, et al. (2008) An essential role for fibronectin extra type III domain A in pulmonary fibrosis. Am J Respir Crit Care Med 177: 638–645.
72. Leask A, Abraham DJ (2004) TGF-beta signaling and the fibrotic response. FASEB J 18: 816–827.
73. Van Vliet A, Baelde HJ, Vleming LJ, de Heer E, Bruijn JA (2001) Distribution of fibronectin isoforms in human renal disease. J Pathol 193: 256–262. 74. Doerner AM, Zuraw BL (2009) TGF-beta1 induced epithelial to mesenchymal
transition (EMT) in human bronchial epithelial cells is enhanced by IL-1beta but not abrogated by corticosteroids. Respir Res 10: 100.
75. Yanez-Mo M, Lara-Pezzi E, Selgas R, Ramirez-Huesca M, Dominguez-Jimenez C, et al. (2003) Peritoneal dialysis and epithelial-to-mesenchymal transition of mesothelial cells. N Engl J Med 348: 403–413.
76. Han M, Liu M, Wang Y, Chen X, Xu J, et al. (2012) Antagonism of miR-21 Reverses Epithelial-Mesenchymal Transition and Cancer Stem Cell Phenotype through AKT/ERK1/2 Inactivation by Targeting PTEN. PLoS One 7: e39520. 77. Margetts PJ (2012) Twist: a new player in the epithelial-mesenchymal transition
of the peritoneal mesothelial cells. Nephrol Dial Transplant.
78. El-Haibi CP, Bell GW, Zhang J, Collmann AY, Wood D, et al. (2012) Critical role for lysyl oxidase in mesenchymal stem cell-driven breast cancer malignancy. Proc Natl Acad Sci U S A.
79. Coral K, Madhavan J, Pukhraj R, Angayarkanni N (2012) High Glucose Induced Differential Expression of Lysyl Oxidase and Its Isoform in ARPE-19 Cells. Curr Eye Res.
80. Herranz N, Dave N, Millanes-Romero A, Morey L, Diaz VM, et al. (2012) Lysyl oxidase-like 2 deaminates lysine 4 in histone H3. Mol Cell 46: 369–376. 81. Lugassy J, Zaffryar-Eilot S, Soueid S, Mordoviz A, Smith V, et al. (2012) The