Native Contact Density and Nonnative
Hydrophobic Effects in the Folding of
Bacterial Immunity Proteins
Tao Chen, Hue Sun Chan*
Departments of Biochemistry, of Molecular Genetics, and of Physics, University of Toronto, Toronto, Ontario M5S 1A8, Canada
Abstract
The bacterial colicin-immunity proteins Im7 and Im9 fold by different mechanisms. Experi-mentally, at pH 7.0 and 10°C, Im7 folds in a three-state manner via an intermediate but Im9 folding is two-state-like. Accordingly, Im7 exhibits a chevron rollover, whereas the chevron arm for Im9 folding is linear. Here we address the biophysical basis of their different behav-iors by using native-centric models with and without additional transferrable, sequence-de-pendent energies. The Im7 chevron rollover is not captured by either a pure native-centric model or a model augmented by nonnative hydrophobic interactions with a uniform strength irrespective of residue type. By contrast, a more realistic nonnative interaction scheme that accounts for the difference in hydrophobicity among residues leads simultaneously to a chevron rollover for Im7 and an essentially linear folding chevron arm for Im9. Hydrophobic residues identified by published experiments to be involved in nonnative interactions during Im7 folding are found to participate in the strongest nonnative contacts in this model. Thus our observations support the experimental perspective that the Im7 folding intermediate is largely underpinned by nonnative interactions involving large hydrophobics. Our simulation suggests further that nonnative effects in Im7 are facilitated by a lower local native contact density relative to that of Im9. In a one-dimensional diffusion picture of Im7 folding with a co-ordinate- and stability-dependent diffusion coefficient, a significant chevron rollover is con-sistent with a diffusion coefficient that depends strongly on native stability at the
conformational position of the folding intermediate.
Author Summary
In order to fold correctly, a globular protein must avoid being trapped in wrong, i.e., non-native conformations. Thus a biophysical account of how attractive nonnon-native interactions are bypassed by some amino acid sequences but not others is key to deciphering protein structure and function. We examine two closely related bacterial immunity proteins, Im7 and Im9, that are experimentally known to fold very differently: Whereas Im9 folds direct-ly, Im7 folds through a mispacked conformational intermediate. A simple model we
OPEN ACCESS
Citation:Chen T, Chan HS (2015) Native Contact Density and Nonnative Hydrophobic Effects in the Folding of Bacterial Immunity Proteins. PLoS Comput Biol 11(5): e1004260. doi:10.1371/journal. pcbi.1004260
Editor:Dennis R Livesay, UNC Charlotte, UNITED STATES
Received:February 19, 2015
Accepted:March 29, 2015
Published:May 27, 2015
Copyright:© 2015 Chen, Chan. This is an open access article distributed under the terms of the
Creative Commons Attribution License, which permits unrestricted use, distribution, and reproduction in any medium, provided the original author and source are credited.
Data Availability Statement:All relevant data are within the paper and its Supporting Information files.
Funding:The authors received the Canadian Institutes of Health Research Grant No. MOP-84281 (http://www.cihr-irsc.gc.ca/). The funders had no role in study design, data collection and analysis, decision to publish, or preparation of the manuscript.
tration [5] principles, the energy landscapes of these proteins may be pictured as smooth fun-nels with little ruggedness [6–8]. However, the consistency between local and nonlocal
interactions is never perfect [4]. Frustration exists [5] in biomolecules and can sometimes serve important biological functions [9]. It is physically intuitive that energetically favorable nonna-tive interactions can occur [10]. Through improved experimental techniques, nonnative inter-actions are now known to be more prevalent than previously appreciated [11,12]. From a fundamental biophysical standpoint, a better understanding of the presence and absence of nonnative interactions is key to deciphering biomolecular recognition and to assessing our grasp of basic protein energetics [13].
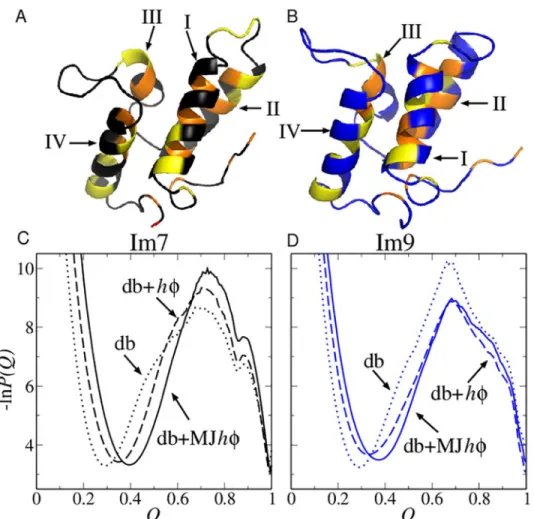
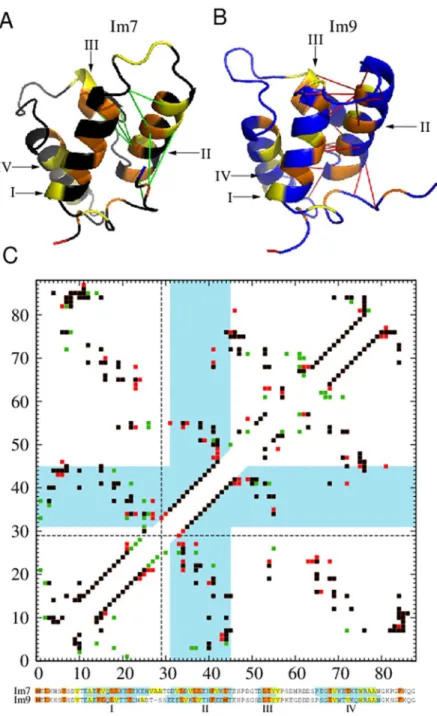
As one of the earliest definitive examples of nonnative effects in single-domain proteins, the folding kinetics of bacterial immunity protein Im7 and its homolog Im9 are well characterized [14,15]. Despite their very similar native structures (Fig1Aand1B), a large body of experi-mental work demonstrates that Im7 folds via an intermediate stabilized by nonnative contacts, whereas Im9 folding is essentially two-state [16–22]. The relative simplicity of the Im7/Im9 system makes it well suited for an informative case study. Unlike some of the larger proteins (number of residuesn≳100) such as cytochrome c [23] and ribonuclease A [24] that fold in a more complex manner [25], Im7 and Im9 folding is not complicated by a heme or disulfide bonds. Indeed, in view of many single-domain proteins that can fold with no apparent nonna-tive effects, the nonnanonna-tive interactions in Im7 are likely a consequence of functional constraints [26,27]. It is noteworthy in this connection that the biological functions of Im7 and Im9 are evolutionarily related by promiscuous interactions [28] that are probably underpinned by non-native excited-state conformations [29].
Theory and computation have provided valuable insights into the Im7/Im9 system. Experi-mentalF-values were used as constraints in conformational sampling to derive putative fold-ing transition states of these proteins [27,30]. The results suggest a functional origin for the nonnative interactions in Im7 [27]. In a separate effort, an equilibrium intermediate state was predicted for Im7 using a Gō-like model that assumes no favorable nonnative interaction [31].
However, although topological frustration and heterogeneity in contact density can, in some cases, lead to kinetic and equilibrium folding intermediates in the absence of favorable nonna-tive interactions [32–34], a subsequent computational study indicates that Im7 folding cannot be explained by native-centric interactions alone [26]. Instead, nonnative effects arising from
“localized frustration”[35] was seen as necessary for rationalizing the peculiar behaviors of Im7 [26]. Consistent with this finding as well as with experiment, a sequential stabilization al-gorithm for predicting folding pathway was not able to reach the Im7 native structure because of kinetic trapping; but the same algorithm was successful in accessing the Im9 native structure [36].
the Im7 chevron at pH 7.0 and 10°C exhibits a significant rollover, whereas that of the Im9 does not [16,18–20]. The present study addresses this basic distinction between Im7 and Im9 by direct simulations of folding/unfolding rates. Because each chevron plot is a summary of ki-netic and thermodynamic data from a large set of folding/unfolding trajectories [13], it is not yet practical to employ all-atom molecular dynamics [37,38] for the extensive computation necessary to produce model chevron plots. Moreover, current molecular dynamics forcefields are probably insufficient to rationalize highly cooperative folding behaviors such as that of Im9 because the forcefields tend to over-predict nonnative effects [38,39]. Therefore, as an interim method that has been applied elsewhere [40–42], we develop tractable explicit-chain coarse-grained models [43] to tackle the chevron behaviors of Im7 and Im9, as these behaviors have not been addressed by direct simulations to date. We model nonnative effects using“hybrid”
formulations that augment structure-based native-centric interactions with physics-based,
Fig 1. Structures and folding thermodynamics of Im7 and Im9.The ribbon diagrams (top) depict the PDB structures of (A) Im7 (PDB ID: 1AYI) and (B) Im9 (PDB ID: 1IMQ). The positions of four types of strongly hydrophobic residues (M, F, I, L) are shown in orange whereas those of four types of largely nonpolar residues but have weaker hydrophobicities (V, W, Y, A) are shown in yellow. Other residue positions are shown in black (for Im7) or blue (for Im9). Each structure contains four helices (I, II, III, and IV). The bottom panels show free energy profiles−lnP(Q) for Im7 (C) and Im9 (D) computed using three different models around each model’s transition midpoint.
pological frustration [32,33] and favorable nonnative interactions [10,54]. As discussed below, the Im7 chevron rollover in our model is associated with a coordinate- and stability-de-pendent coefficient of one-dimensional diffusion, with a strong anticorrelation between native stability and diffusion rate at the position of the transiently trapped intermediate. Notably, the smallest diffusion coefficients at these trapped positions can be orders of magnitude smaller than those encountered in two-state-like folding.
Results/Discussion
We study three classes of coarse-grained chain models for Im7 and Im9. The rationale for the models—termed db (desolvation-barrier), db+hϕ, and db+MJhϕ—are detailed inMethods.
The db models are purely native-centric, whereas the other two are hybrid models [13] that allow for sequence-dependent nonnative hydrophobic interactions based on either homoge-neous or heterogehomoge-neous nonnative energies. The nonnative interaction strength between any pair of hydrophobic residues is taken to be the same in the homogeneous db+hϕmodels. We
compare this simple approach [49]—which does not account for effects of mutations among hydrophobic residues—to the heterogeneous db+MJhϕmodels that utilize a
Miyazawa-Jerni-gan (MJ) statistical potential [52] for the nonnative interactions among different hydrophobic pairs. To compare models on an equal footing, theaveragehydrophobic interaction strength in
the heterogeneous db+MJhϕmodels is chosen to be identical to that of the homogeneous db
+hϕmodels.
The difference between Im7 and Im9 folding is not apparent in the model
proteins
’
Q
-dependent free energy profiles
The equilibrium free energy profiles computed near the models’transition midpoints (Fig1C
profiles of Im7 and Im9 under zero-denaturant conditions (ΔG/kBT−10.5 and−12.0, corre-sponding to the experimental folding free energy of approximately−24.9 kJ mol−1for Im7 [19]
and−28.2 kJ mol−1for Im9 [15] at pH 7.0 and 10°C; seeFig 2B).
The main difference between Im7 and Im9 chevron plots is rationalized
by heterogeneous nonnative hydrophobic interactions
The approximate linearity of native stability versus interaction strength/T(Fig 2B) allows ΔG/kBTto be used as a proxy for denaturant concentration [42] in model chevron plots.Fig 3 shows that the folding-arm rollover and lack thereof, respectively, in the experimental chevrons for Im7 and Im9 at pH 7.0 and 10°C [16,18–20] is captured by the db+MJhϕbut not the db and db+hϕmodels, suggesting that the Im7 rollover arises from the strong nonnative
interac-tions among the large hydrophobic residues as modeled by db+MJhϕ(S1 Fig). The difference between Im7 and Im9 folding cannot be explained by native interactions alone (as in db) or the more generic nonnative hydrophobic effects in db+hϕ. The chevron rollover in the db+MJhϕ
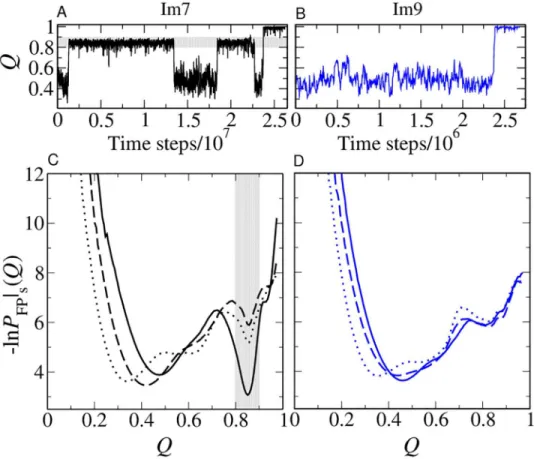
Im7 model is a consequence of transient yet long-lived trapped conformations atQ0.85 (Fig 4A), which do not appear in Im9 folding under similarly strong folding conditions (Fig 4B).
An overview of Im7 and Im9 folding kinetics is afforded by their kinetic profiles, which show a deep minimum atQ0.85 for Im7 (Fig 4C) but not for Im9 (Fig 4D). Determined from folding trajectories alone [59], kinetic profiles are more useful than free energy profiles for identifying folding intermediates. The Im7/Im9 difference is not apparent from the free en-ergy profiles because, on one hand, kinetic trapping is minimal when folding is only weakly fa-vored (Fig 1C). On the other hand, when folding is strongly favored (Fig 2A), the contribution
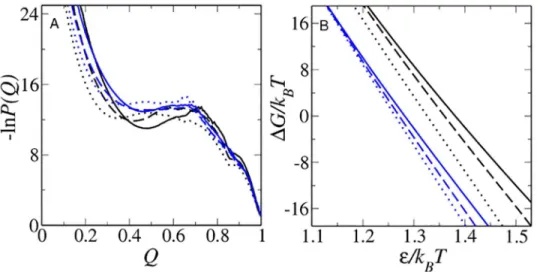
Fig 2. Modeling native stability changes.(A) Simulated Im7 (black) and Im9 (blue) free energy profiles at
ΔG/kBTvalues that equal to the experimental stabilities of the proteins at zero denaturant. (B) For all six models studied,ΔG/kBTvaries approximately linearly with inverse temperature 1/T. Results for db, db+hϕ
and db+MJhϕin (A) and (B) are plotted using the line styles inFig 1. TheΔG/kBTvalues here and in subsequent figures are computed by identifying conformations withQQD= 48/154, 57/154, and 61/154 as
the Im7 unfolded states, respectively, in the db, db+hϕand db+MJhϕmodels; and conformations withQQN
= 151/154 as the Im7 folded state in all three models. The corresponding criteria for the Im9 unfolded states areQD= 50/164, 56/164, and 61/164; and the Im9 folded state is defined byQN= 159/164 for all
three models.
from folding trajectories to an equilibrium profile is overwhelmed by that from unfolding tra-jectories, viz., the resident time in the folded state is much longer than that in the unfolded and intermediate states. Consequently, the deep well atQ0.85 inFig 4Ctranslates to merely a small kink around the sameQvalue inFig 2A.
A physical account of the main difference between Im7 and Im9 folding kinetics is thus pro-vided. Many mutational experiments are rationalized below as well. Because of their simplicity, however, db+MJhϕmodels are limited in some respects. For instance, the midpoint folding rate of Im7 is1/5 that of Im9 in this model (Fig 3C); but the experimental midpoint rate of Im7 (1.2–3.0 s−1[19,65]) is
≳40 times that of Im9 (0.03 s−1[15,20]). Moreover, whereas
the folding and unfolding arms of the simulated chevron plots are quite symmetric around the transition midpoint, experimental unfolding rate exhibits a much weaker denaturant depen-dence than folding rate [16,18–20]. These drawbacks are typical of topology-based models [42], which are more apt for folding than for unfolding kinetics [43,66]. But this limitation has little bearing on our analysis of folding kinetics. Improved modeling likely requires special sta-bility-enhancing energies that have minimal effects on folding kinetics [67,68]; but such efforts are outside the scope of the present work.
Contact pattern of the computed Im7 folding intermediate is consistent
with experimental inference
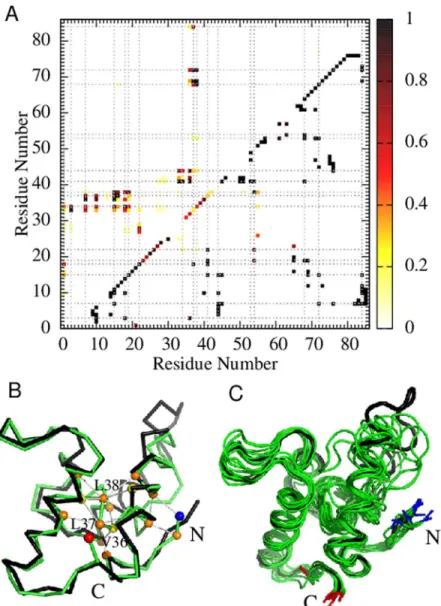
Structural properties of our simulated Im7 intermediate (Fig 5) are largely in agreement with mutagenesis experiments, which indicate that the intermediate is stabilized by nonnative inter-actions between Helix IV and the open end of the Helix I-Helix II hairpin involving residues L3, I7, F15, V16, L18, L19, L34, L37, L38, F41, V42, I68, and I72 [19]. Notably, 12 of these 13 residues are involved in the most populated 20 nonnative hydrophobic contacts (with>80% probability of occurrence) in the Im7 intermediate simulated using db+MJhϕ(Fig 5A, upper
triangle). The only exception is V42, for which the most probable nonnative contact V36–V42
Fig 3. Model chevron plots.Negative logarithm of mean first passage time (MFPTin units of number of simulation time steps) of folding (filled circles) and unfolding (open circles) for Im7 (black data points) and Im9 (blue data points) as a function ofΔG/kBTof the given model. Fitted curves are merely guides for the eye. The
ΔG/kBTvalues corresponding to the experimental stability at zero denaturant are marked by vertical dashed lines using the same color code, whereas theΔG/kBT= 0 transition midpoints are marked by black dotted lines. The kinetic criteria for folding and unfolding are identical to those inFig 2for equilibriumΔG/kBT. Each Im7MFPTdata point in the (A) db, (B) db+hϕand (C) db+MJhϕmodels is an average over the folding or unfolding times of 3,200, 2,532–3,200, and 604–3,200 trajectories, respectively. The corresponding numbers of trajectories for Im9MFPTdata points are 3,046–3,200, 2,513–3,200, and 3,200.
has nonetheless a 73% occurrence probability in the simulated intermediate. Among the 20 most probable nonnative contacts in the simulated Im7 intermediate, three are between the N-terminal segment and Helix II [L3–V33 (94%), L3–L34 (85%), I7–V36 (92%)], eight are
be-tween Helices I and II [F15–L34 (92%), F15–V36 (99%), F15–L37 (97%), F15–L38 (85%), V16–L37 (92%), V16–L38 (80%), L19–L38 (80%), L18–L34 (96%)], four are between different
residues in Helix II [V33–F41 (98%), L34–F41 (99%), V36–F41 (90%), V36–I44 (82%)], and five are between Helices II and IV [L37–V69 (99%), L37–I72 (96%), L38–I68 (99%), L38–V69
(99%), L38–I72 (91%)]. Helix III hardly contributes to the intermediate-stabilizing nonnative contacts in the model. The most likely nonnative contact in the intermediate ensemble that in-volves Helix III, L38–L53, has an occurrence probability of only 17%.
Our computed probabilities of contacts are in line with experiments indicating that Helices I and IV are fully formed but Helix II is partly formed in the Im7 intermediate [14]. InFig 5A, intrahelical contacts between residuesi,i+ 4 are present but less probable for Helix II (residues Fig 4. Transiently trapped conformations.(A, B) Examples of folding trajectories of Im7 (A) and Im9 (B) simulated using the db+MJhϕmodel under zero-denaturant conditions (/kBT= 1.48 and 1.39 respectively). Transiently trapped conformations withQ0.8–0.9 are observed for the Im7 trajectory [highlighted by horizontal gray shading in (A)] but not for the Im9 trajectory in (B). (C, D) Kinetic FP profiles [59] in the db, db +hϕ, and db+MJhϕmodels (same line styles asFig 1) for Im7 (C) and Im9 (D). The approximate range ofQ values for the conformations constituting the transiently trapped Im7 intermediate in the db+MJhϕmodel is indicated by the vertical gray band in (C). The number of trajectories used to computed the kinetic FP profiles in the three models are, respectively, 1,600, 1,240, and 1,139 for Im7 and 1,600, 1,600, and 3,200 for Im9.
Fig 5. Structural properties of the simulated Im7 folding intermediate in the db+MJhϕmodel.(A) Native (lower right) and nonnative (upper left) contact probability maps (color scale on right) for Im7 conformations with 0.8<Q<0.9 along folding trajectories simulated under the strongly folding conditions inFig 4. The maps provide occurrence probabilities of individual contacts in the putative intermediate-state ensemble that are normalized for the 0.8<Q<0.9 conformations along folding trajectories. The grey dotted lines mark the M, F, I, and L residues along the Im7 sequence. (B) One such Im7 conformation atQ= 0.844 (greenCαtrace) is compared with the PDB structure (black trace). In the intermediate conformation (green trace), the N- and C-termini are marked, respectively, by the blue and red spheres. Hydrophobic residues that participate in significant nonnative interactions are marked as orange or yellow spheres (same color code as that inFig 1A). A significant nonnative interaction is marked by a gray line between a pair of residues if the pair is not a native contact yet their spatial separation in the conformation shown is less than 8.0Åand their interaction energy is stronger (more negative) than−1.0. The marked nonnative contacts are M1–L18, L3–L34, I7–L37, F15–L37, F15–L38, V16–L38, L18–L34, L19–L38, V36–F41, V36–I44, L37–V69, L37–I72, L38–I68, and L38–V69. (C) A collection of randomly chosen Im7 intermediate conformations (green traces). Included for reference is the PDB structure (black trace).
32 to 45) than for Helices I and IV (residues 12 to 26 and 65 to 78). Experiment indicates also that Helix III is absent [14] but it is present in our simulated Im7 intermediate. This limitation of the model is likely related to its simple treatment of native interactions. Nonetheless, in agreement with experiment, amino acid substitutions in Helix III result only in small changes in folding rate in the db+MJhϕmodel (see below).
A snapshot of the simulated Im7 intermediate state is shown inFig 5Bwherein each of the highlighted nonnative contacts has80% occurrence probability except M1–L18 (56%) in the Im7 intermediate ensemble (Fig 5C). All except one (V42) of the 13 residues identified by mu-tagenesis experiments (see above) to be stabilizing the Im7 intermediate are represented in the highlighted nonnative contacts. We have verified that structures very similar to the Cα interme-diate conformation inFig 5Bare physically realizable by constructing a corresponding atomic structure [69] with added sidechains [70] (S2 Fig).
Our simulated Im7 kinetic intermediate is stabilized by nonnative interactions (S1 Fig). As such, it is diametrically different from the equilibrium intermediates simulated using purely na-tive-centric models [31] with heterogeneous Gōenergies [71]. Instead of being a product of
nonnative effects, equilibrium intermediates in such Gō-like models arise from their reduced
folding cooperativity [72], which can lead to three-state-like free energy profiles for Im7 and Im9 (S3 Fig); but such features are at odds with experiment.
Kinetic effects of Im7 mutations
Effects of select mutations in the db+MJhϕmodel for Im7 are examined through their folding kinetic profiles [59] (Fig 6). Some mutations reduce the depth of the kinetic trap atQ0.85 relative to that of the wildtype (WT) while others lead only to negligible changes. We compute also the rates of reaching the intermediate position atQ0.85 and the folded state atQ= 0.98 from initially unfolded conformations. The former rate (3.9 × 10⁻⁷for WT, in units of
recip-rocal number of time steps) varies little, whereas the latter overall folding rate (= 5.0 × 10⁻⁸for
WT) is sensitive to mutation. The overall folding rate correlates, albeit imperfectly, with the depth of theQ0.85 minimum.
The general trend of variation of the simulated folding rates is largely in line with that of the experimental intermediate-to-native folding rateskin[19] orkIN[65] for the single mutants (=
238 s−1for WT) inFig 6A. For both simulation and experiment, folding rate remains essentially
unchanged for three mutants (simulated rate in units of 10−8, experimental rate in s−1[19,65]):
I54A (4.4, 200), I72V (5.0, 250), A77G (4.9, 235) [(5.0, 238) for WT]; and is speeded up for four mutants: F15A (30.7, 550), L34A (40.2, 1850), L37A (49.6, 450), L38A (31.1, 1600). Fold-ing rate remains essentially unchanged experimentally but is speeded up in simulation for five mutants; nevertheless the simulated increase is less than that for mutants that fold faster in ex-periments: F15Y (19.3, 220), V16A (10.7, 220), V33A (19.7, 238), V36A (22.3, 190), F41Y (9.3, 186).
However, the present model cannot account for the dramatic experimental increase in fold-ing rate and the disappearance of foldfold-ing-arm rollover for F41L (kin= 5000 s−1[19],21
times of that of WT) because F and L have similar MJ energies [52]. For this mutant, the simu-lated rate 3.6 × 10⁻⁸is smaller than that of WT. Even mutating F to a non-hydrophobic in the
Consistent with experiment [14], L53A/I54A has a negligible kinetic effect on Im7 in our model (Fig 6B), which is in line with the small experimentalF-values of0.03–0.16 andkin=
200 s−1for L53 and I54 in Helix III [19]. In contrast, many double mutants with
hydrophobic-ity-reducing substitutions in Helices I and II can dramatically destabilize the folding intermedi-ate and thus speed up Im7 folding (Fig 6B). These predictions should be testable by future experiments. However, because mutations in our models change only the nonnative but not the native interactions, as it stands our approach cannot address mutations such as L18A/ L19A/L37A that prevent Im7 folding [22].
Im7/Im9 difference in native contact density and hydrophobicity of
Helix II
The three-state kinetics of Im7 is related to its hydrophobic composition. Im7 has 32 hydro-phobic residues (17 with stronger and 15 with weaker hydrohydro-phobicities;Fig 1) whereas Im9 has 28 (15 and 13 in the two categories). In Helix II, Im7 has two more hydrophobics (V33, V42) and the stronger L38 instead of the weaker V37 in Im9. In Helix IV, Im7 has I72 instead of Im9’s V71. Notably, V33, L38, and V72 are involved in 10 of the 20 most probable nonnative contacts in the simulated Im7 intermediate listed above.
Im7 and Im9 have nearly equal numbers of native contacts involving Helices I and IV (54 and 50, respectively, for Im7 and 53 and 49 for Im9). But the number of native contacts involv-ing Helix II is 52 for Im7 (residues 32 to 45) and 62 for Im9 (residues 30 to 44). The native contact density of Helix II is thus appreciably lower for Im7 (52/14 = 3.71) than for Im9 (62/15 = 4.13). With lower local native-centricity and higher local hydrophobicity (Fig 7),
Fig 6. Kinetic effects of mutations in the db+MJhϕmodel for Im7.Kinetic FP profiles of single (A) and double (B) mutants under strongly folding conditions corresponding to zero denaturant in experiment. The reference WT profile is also shown. The depth of the kinetic trap atQ0.85 for the single mutants in (A) increases in the following order: L34A (shallowest)<L37A<V36A<L38A<V33A<F15A<F41G<F15Y<V16A<F41Y<I72V<
A77G<WT<F41L<I54A (deepest). The boxes in (A) enclose mutations that lead to very similar kinetic FP profiles. The kinetic FP profiles for the double mutant L53AI54A and the WT in (B) are also very similar.
Fig 7. Local native contact density of Helix II is lower in Im7 than in Im9.(A) and (B) are the PDB structures shown with the color code inFig 1and depicted in a different orientation to highlight the native contacts of Helix II. The same color coding for hydrophobic residues is applied to the sequence alignment in (C) below. The eight green lines in (A) mark the native contacts involving Helix II that are found in Im7 but not in Im9, whereas the eighteen red lines in (B) mark the corresponding contacts that are in Im9 but not in Im7. Native contacts common to both proteins are not marked in (A) and (B). (C) Combined native contact maps for Im7 and Im9 using aligned residue numbering (bottom). The sequence alignment here follows that of Friel et al. [21], wherein Im9 residue numberiis shifted toi+ 1 fori>27. The first of the shifted Im9 residues, at position 29, is marked by the dashed lines in the contact maps. Blue-shaded regions in the sequence alignment encompass residues belonging to the four helices as defined by the PDB. In the contact maps, native contacts common to Im7 and Im9 are plotted in black, whereas those belonging only to Im7 or only to Im9 are plotted, respectively, in green or red. Native contacts involving Helix II are those within the two L-shaped blue-shaded regions in the maps. The lower-right map follows the definition for native contacts in Methods; this map is the one used in the simulations as well as in the drawings (A) and (B). Included for comparison is the upper-left native contact map determined by the CSU software [74,75].
analysis of interatomic contacts and interface complementarity to determine native contacts [74,75]. Under the CSU criterion, the total number of native contacts is very similar for Im7 and Im9 (177 and 180 respectively; see upper-left map inFig 7). Nonetheless, similar to the ob-servation above, the local density of CSU-defined native contacts of Helix II is also appreciably lower for Im7 (59/14 = 4.21) than for Im9 (67/15 = 4.47).
Experiments on Im9 have shown that V37L/V71I and V37L/E41V/V71I can lead to three-state folding [15,21] and folding-arm rollover at pH 7.0 and 10°C [21]. Computationally (S4 Fig), these mutations deepen somewhat the shallow minimum atQ0.85 in the Im9 kinetic profile (A and C ofS4 Fig). But the effect is insufficient to account for experimental data, indi-cating that further effort is needed to better model the balance between native and nonnative interactions in Im9. For instance, if the native interaction strength of L33 (which acts as a
“gatekeeper”[76]) in Helix II was reduced, much deeper Im9 kinetic traps would develop for V37L/V71I and V37L/E41V/V71I (B and D ofS4 Fig). Although our present model does not address mutational effects on native interactions, this result indicates nonetheless that L33 mu-tations that reduce the native interaction strengths (e.g., by substituting it with a less hydropho-bic residue) may lead to less cooperative folding of Im9. This suggested behavior should be testable by future experiments.
The above analysis of the interplay between local native contact density and hydrophobicity suggests that the different folding kinetics of wildtype Im7 and Im9 may also be seen in variants of the homogeneous db+hϕmodel (KHP= 1 as defined inMethods) with stronger nonnative
hydrophobic interaction strengths (KHP>1). Consistent with this idea,S5 Figshows that a
signficant folding intermediate population starts to develop atKHP= 1.3 for Im7 but no
corre-sponding folding intermediate is observed for Im9 at the sameKHP. Two comments are in
order here. On one hand, the result inS5 Figfrom an alternate formulation of hydrophobicity reinforces our general notion that local native contact density and hydrophobicity are the main physical underpinnings for the Im7-Im9 kinetic difference. On the other hand, a strength of≳ 1.3 for the homogeneous nonnative hydrophobic interaction is needed to achieve the desired Im7-Im9 difference, whereas the heterogeneous nonnative hydrophobic interaction strengths in the db+MJhϕmodel that produce a similar effect average only to 1.0 (seeMethods; note that even atKHP= 1.3, the minimum atQ0.85 in (A ofS5 Fig) is shallower than that inFig 4C).
Physically,KHP≳1.3 is problematic because it implies that nonnative interaction strength
is≳30% higher than native interaction strength. For this reason and considering the obvious limitation of the homogeneous approach that it cannot address effects of mutations among hydrophobic residues, the more refined db+MJhϕapproach is adopted in the present
Conformational diffusion in
Q
is extremely coordinate- and
stability-dependent in the presence of a significant kinetic trap
The Im7/Im9 system is instructive in elucidating nonnative effects and kinetic trapping in the diffusion picture of protein folding [54–59]. Conformational diffusion models with a coordi-nate and stability-dependent diffusion coefficient on a one-dimensional free energy profile were constructed for two-state-like [57] and downhill [58] folding; but corresponding model-ing for foldmodel-ing with a significant chevron rollover has not been much explored. In this regard, it is noteworthy that the rollover in our Im7 db+MJhϕmodel appears across only8% varia-tion in interacvaria-tion strength (/kBT= 1.37 and 1.48, respectively, for midpoint and zero denatur-ant). In contrast, rollover-like features for two-state-like and downhill folders emerge over much wider ranges of interaction strength [58].
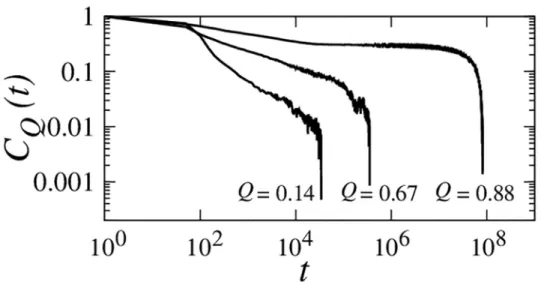
The restraining-potential method [56,58] inMethodsis used to computeQ- andΔG -depen-dent autocorrelation functionCQ(t) (Fig 8) and diffusion coefficientD(Q) (Fig 9). The restrain-ing-potential method directly addresses the escape probability from a givenQ. Rather than seeking a good fit by Bayesian analysis [55], we adopt this method to explore possible limits of the diffusion picture by testing the consistency between diffusive accounts of restrained and unrestrained chain kinetics.
The most notable Im7/Im9 difference presents itself around the Im7 kinetic trap atQ
0.8–0.9. Here a dramatic deepening of a dip inD(Q) with increasing native stability is seen for Im7 but not for Im9, whereasD(Q) for otherQ-values is not very sensitive toΔG(Fig 9). Achieving numerical convergence of the computedD(Q) in theQ0.85 region of Im7 is diffi-cult because of kinetic trapping. To delimit theoretical possibilities, we obtain lower and upper bounds ofD(Q) for Im7 in this region, respectively, by initializing restrained runs from kineti-cally trapped and random conformations (Fig 9).
Im7 chevrons may now be computed in the diffusion model; but considerable variation en-sues (shaded area inFig 10A) because of numerical uncertainties. The rollover trend of the sim-ulated Im7 chevron is among the predicted possibilities. However, when matched against explicit-chain kinetics,D(Q) is found to be underestimated by an overall factor ofe2.715 (Fig 10), indicating that the method for computingD(Q) [56,58] needs to be improved or that a one-dimensional diffusion perspective is of limited applicability here.
Despite these uncertainties, it is clear that aD(Q,ΔG) that decreases exponentially withΔG
at the trap positionQ0.85 (Fig 10B) is necessary to reproduce the folding-arm rollover for Im7 (Fig 10A, circles). The required variation ofD(Q,ΔG) at this position, which spans two or-ders of magnitude, is reassuringly consistent with the lower bound estimated by initiating re-strained runs from the kinetic trap. In the absence of such a strong dependence ofD(Q,ΔG) on ΔG, the predicted folding arm would become essentially linear (top dashed line inFig 10A). In the same vein and consistent with our explicit-chain results (Fig 3), no folding-arm rollover is produced by the diffusion model for Im9.
Concluding remarks
To recapitulate, our explicit-chain models account physically for the strikingly different folding kinetics of Im7 and Im9 in terms of prevalent nonnative interactions among large hydrophobic residues in Im7 but not in Im9. The proteins’different experimental chevron behaviors are rationalized by our simulation. The same phenomenon may also be described by a one-dimensional diffusion process with a very small and strongly stability-dependent diffusion coefficient at the position of the Im7 kinetic trapped intermediate.
Fig 8. Autocorrelation functions of conformational diffusionCQ(t) for the db+MJhϕIm7 model computed near the experimental zero-denaturant stabilityΔG/kBT=−10.2 for threeQvalues.CQ(t)s
were obtained by dynamic conformational sampling restrained to a small range ofQ(see text). TheCQ(t) functions forQ= 0.14 andQ= 0.67 were simulated using random initial conformations; theCQ(t) function for Q= 0.88 was obtained by initiating simulations from a conformation in the kinetically trapped
intermediate state.
doi:10.1371/journal.pcbi.1004260.g008
Fig 9. Coordinate- and stability-dependent conformational diffusion coefficientsD(Q,ΔG) in the db +MJhϕmodel.D(Q) is computed for (A) Im7 atΔG/kBT= 2.1 (blue),−4.1 (red),−10.2 (black) as well as for (B) Im9 atΔG/kBT= 1.5 (blue),−5.9 (red), and−12.5 (black). For eachΔG/kBTvalue, we applied 64 bias potentials centered at equally spacedQvalues spanningQ2[0, 1] to conduct restrained simulations of conformational dynamics to estimateD(Q), with 280 independent Langevin trajectories starting with random conformations simulated for each bias potential. Error bars were derived from standard deviation of the mean of autocorrelation times. Lines connecting data points are merely guides for the eye. The shaded area in (A) indicates the approximateQvalues of the kinetically trapped Im7 intermediate (seeFig 4). Because simulated relaxation time in this region is highly sensitive to the starting conformation, to provide a lower-bound estimate of the diffusion coefficient, for eachΔG/kBTwe considered two alternateD(Q) values that were estimated from conformational dynamics initiated from kinetically trapped conformations instead of random conformations (eight long trajectories were simulated perD(Q) value). These estimated lower bounds onD(Q) are shown in (A) as the lower data points at twoQpositions (Q0.85–0.90). To guide the eye, these additional data points are connected to the rest theD(Q) function by dotted lines.
Fig 10. Chevron rollover in the diffusion picture of Im7 folding.(A) The folding arm of the Im7 chevron plot inFig 3Cis shown here again by the filled circles connected by solid lines. The dashed lines show the negative logarithm of stability-dependent foldingMFPTcomputed analytically using theD(Q,ΔG) values in
Fig 9A. The top (i), middle (ii), and bottom (iii) dashed lines are obtained, respectively, by (i) considering only theD(Q,ΔG) values estimated by simulations initiated from random conformation, i.e., not using the alternate lower-boundD(Q,ΔG) values forQ0.85–0.90 at all, (ii) using the average lower-boundD(Q,ΔG) values for 0.81<Q<0.91, and (iii) using the minimum lower-boundD(Q,ΔG) values for the same range ofQ. To faciliate comparison, all−ln(MFPT) values from the diffusion model are shifted by an overall additive constant ofc= 2.7 so that the top dashed line may be compared with the explicit-chain chevron. This amounts to an overall re-scaling of the time units in the diffusion model. The shaded region shows the extent of possible folding-arm chevron behaviors. The upper boundary of this region was computed using the highestD(Q) values delimited by the error bars inFig 9A. The lower boundary is constructed by joining the−ln(MFPT) values of the bottom dashed line [case (iii) above] atΔG=−10.2kBTwith that atΔG= 0 computed by using the minimum values delimited by the error bars for theD(Q) values estimated using random initial conformations. (B) Possible variation of the diffusion coefficient in theQ0.85 region. The top, middle, bottom dashed lines and the shaded region in (B) show theD(Q0.85,ΔG) values used to obtain the chevron behavior shown, respectively, by the top, middle, bottom dashed lines and the shaded region in (A). The filled circles connected by solid lines show theD(Q0.85,ΔG) values needed to reproduce the trend of chevron rollover in explicit-chain simulations.
the Im7/Im9 system, such as those on pH [18,21] and temperature [15] effects, offers ample data for testing extensions of our models.
Perhaps the most useful insight from the present effort is that the peculiar folding kinetics of Im7 vis-à-vis that of Im9 is closely related to their difference in the balance between local na-tive contact density and hydrophobicity. This principle embodies a competition between nana-tive topology and nonnative interactions [49] and is likely applicable to protein dynamics and bio-molecular processes in general. As such, it should be examined in detail and extended to other forms of nonnative interactions in future investigations.
Methods
Explicit-chain models
Three related Cαchain models for Im7 and Im9 are considered, namely the db, db+hϕ, and db +MJhϕmodels. Common to these models is a set of native-centric interactions with
desolva-tion barriers for each protein. Folding and unfolding kinetics is simulated by Langevin dynam-ics [80]. Desolvation barrier (db) is a robust feature in hydrophobic interactions [81] that tends to enhance folding cooperativity [40,82]. Indeed, for some proteins such as ribosomal protein S6, Cαmodels with db lead to highly cooperative folding behaviors that are consistent with ex-periments [49] whereas models without db exhibit only weak folding cooperativity [76]. Here, following Ref. [80], the pairwise db energy is defined by a contact minimum well depth of= 1.0, a db height ofdb= 0.1, and a solvent-separated minimum well depth ofssm= 0.2.
The db model is purely native-centric with the total interaction potential, denoted here as
EN, equal toVtotalin Ref. [80]. The same interaction strength is applied to all native-centric
in-teractions. The native contact sets for Im7 and Im9 are constructed using the same criterion [80]. A pair of residuesi,jbelongs to the native contact set if at least one pair of their non-hy-drogen atoms, one from each residue, are less than 4.5 Å apart in the Protein Data Bank (PDB) structure. The PDB Cαseparation betweeni,jis denoted byr
n
ij. The total number of native
con-tacts in the set,Q~
n, is equal to 154 and 164, respectively, for Im7 and Im9 (Fig 7). We have
ex-plored using alternate“flavored”native-centric interaction strengths [72,83] in accordance
with the residue-dependent contact energies in Ref. [71] but, interestingly, the resultant models for Im7 and Im9 fail to fold cooperatively.
Homogeneous and heterogeneous nonnative interactions
Favorable nonnative interactions are included in db+hϕand db+MJhϕ. Using a hybrid
formu-lation [13,43–51,84–92], the total interaction potentialsETof these models are given byET= EN+EHP, whereEHP¼
Pn i
Pn
j¼iþ4KHPkijexp½ ðrij shÞ 2
amino acids A, V, L, I, M, W, F, and Y [47].rijis the Cαdistance betweeni,jduring simulation (1i,jn, where the total number of residuesn= 87 for Im7 andn= 86 for Im9); andσhϕ=
5.0 Å. The nonnativehϕinteractions in the db+hϕmodel are homogeneous withκij=−1.0
irre-spective of hydrophobic residue type andKHP= 1.0 as in Refs. [47,49], whereas the nonnative hϕinteractions in the db+MJhϕmodel are heterogeneous, withκij=ΔijwhereΔijis the
con-tact energy in Table V of Miyazawa and Jernigan [52] andKHP= 1.8 such that the averagehϕ
energyKHPhκijiover all possible 8 × 7/2 + 8 = 36hϕpairs is equal to−1.0 (theKHPκijvalues
range from−0.216 for A-A to−1.584 for F-F). This averagehϕinteraction energy of−1.0 is es-sentially maintained by the averagehϕenergies over all possible nonnativehϕcontact pairs
(defined below) for the Im7 and Im9 sequences in the db+MJhϕmodels. Those average ener-gies are equal to−0.994 for wildtype Im7 (412 possible nonnativehϕpairs) and−0.998 for
wildtype Im9 (306 possible nonnativehϕpairs).
MJ-type potentials [52,71] are derived from the statistics of native contacts in the protein structure database. Because protein native structures do not contain many significantly unfa-vorable contacts, MJ potentials are not expected to describe repulsive interactions between amino acid residues with accuracy [93]. Nonetheless, they do provide a crude account of the relative strengths of favorable physical interactions between residues. In fact, it has long been known that MJ potentials for nonpolar pairs reflect the combined hydrophobicities of the two contacting residues [94,95], as is illustrated by the good correlation (Fig 3b of [96]) between a set of MJ energies [71] and the experimental octanol-water transfer free energies of amino acids [53]. In this regard, although there are considerable variations among experimental hy-drophobicity scales for all twenty types of amino acids [96,97], a higher degree of consistency among different experimental scales is seen for the hydrophobic (nonpolar and non-charged) amino acids themselves [98]. Taking these considerations together, we view MJ energies be-tween nonpolar residues as a reasonable coarse-grained model of the underlying physics of hy-drophobicity. Thus, they should be applicable to favorable nonnative hydrophobic interactions and represent a more refined model than those with homogeneous hydrophobic
interaction strengths.
In our models, two hydrophobic residuesi,jthat are not in contact in the native PDB struc-ture are considered to be in a nonnative contact if |i−j|>3 andrij<8.0 Å (Fig 5). The total number of nonnative contacts in a conformation is denoted bynHP(S1 Fig). All non-bonded
energies in our models are temperature independent and pairwise additive. For simplicity, tem-perature dependence and nonadditity of interactions [99–102] are not considered here.
Free energy profiles, kinetic profiles, and chevron plots
We consider a residue pairi,jin the native contact set to be in contact during the folding/un-folding simulation whenrijr
n
ijþ1:5Å; i.e., whenrijis not larger than that of the db and therefore within the attractive well of the contact minimum. We useQ, the number of native contacts divided byQ~
n, as progress variable of folding [103,104]. A free energy profile in units
ofkBTcorresponds to−lnP(Q) whereP(Q) is the normalized conformational population distri-bution as a function ofQ(Figs1and2). As was introduced before [59], the kinetic folding path (FP) profiles,−lnPFP|s(Q), is the negative logarithm of average fractional resident timePFPas a
corr
for a givenΔG. Here the variancevarðQÞ hQðt0Þ2i
t0 hQðt0Þi
2
t0, whereh
. . .it
0denotes time
averaging over differentt0values; the correlation timetcorrðQÞ ¼
R1
0 CQðtÞdtwhere the
auto-correlation function [54,107]
CQðtÞ ¼
hQðtþt0ÞQðt0Þit0 hQðt0Þi
2
t0
varðQÞ ð2Þ
isQ-dependent. The var(Q) andCQ(t) for determiningD(Q,ΔG) (Figs8and9) are estimated using bias potentialsVbiasðQ;Q0Þ ¼KQQ~
2
nðQ Q0Þ 2
, where the prescription in Ref. [108] is used to treatQas a continuum variable. Unless specified otherwise,KQ= 0.1is used with 64 differentQ0values for Im7 or Im9. This choice ofKQis similar to that in Ref. [56] and serves to localize conformationalfluctuations to Gaussian-like distributions (S6 Fig).D(Q) is quite
in-sensitive to loweringKQby at least a factor of two (S7 Fig).
This method for determiningD(Q) is exact if the diffusion process is truly governed by the Smoluchowski equation andKQis sufficiently large so that variation of free energyG(Q) within a constrained conformational ensemble is essentially linear inQ. The applicability of this ap-proach to protein folding, however, hinges on whether the dynamics alongQis Markovian to a good approximation [55]. For protein folding,D(Q) estimated by the restraining-potential
method does exhibit a weak dependence onKQ[58]. We have checked our restraining-poten-tial methodology against that of Xu et al. [58] by using aKQvalue that produces conformation-al distributions similar to theirs. OurD(Q) for chymotrypsin inhibitor 2 at transition midpoint matches well with theirs (S8 Fig).D(Q) can also be estimated using Bayesian analysis [55]. For one dipeptide system, the Bayesian-estimatedD(Q) was verified to be very similar to that from restraining potentials [55]. Here we use only the restraining-potential method.
OnceD(Q) is in place for a given native stability (free energy of folding)ΔG, the folding
MFPTin our nonexplicit-chain models of one-dimensional conformational diffusion (Fig 10) is computed using the discretized form [59]
ðMFPTÞD ¼ X
QN
Q¼QD
PeqðQÞ
1XQ
Q0¼0
PeqðQ0Þ=DðQÞ ð3Þ
of the general formula [54,109]
ðMFPTÞD¼ Z QN
QD
dQ Z Q
0
dQ0 1
DðQÞexp
GðQÞ GðQ0Þ
kBT
; ð4Þ
wherePeq(Q) is the normalized equilibrium conformational population atQ. The boundary
in our explicit-chain simulations (Fig 2). Alternatively,MFPTcan be computed using Kawasaki Monte Carlo (MC) dynamics by generalizing the formulation in Ref. [59] to coordinate-depen-dentD(Q), viz., the transition probability fromQtoQ+δQis now given by
A 1 ffiffiffiffiffiffiffiffiffiffiffiffiffiffiffiffiffiffiffiffiffiffiffiffiffiffiffiffiffiffiffiffiffi DðQÞDðQþdQÞ p
exp½ dGðQÞ=k
BTwhereδGG(Q+δQ)−G(Q) andAis a constant. The above geometric mean ffiffiffiffiffiffiffiffiffiffiffiffiffiffiffiffiffiffiffiffiffiffiffiffiffiffiffiffiffiffiffiffiffi
DðQÞDðQþdQÞ p
may also be replaced by the arithmetic mean [D(Q) +D(Q+δQ)]/2; the two means are equal in the limit ofD(Q+δQ)−D(Q)!0. In
addi-tion toMFPT, Kawasaki MC is useful also for providing distribution of folding times and other properties of individual trajectories.
Supporting Information
S1 Fig. Nonnative hydrophobic interactions with physics-based heterogeneous strengths are needed to rationalize the Im7 folding intermediate.Results here are derived from kinetic folding trajectories simulated atΔG/kBTvalues corresponding to the zero-denaturant stabilities of the proteins being modeled. (A–C) Natural logarithm of contact probability (lnPij, which is normalized for all conformations along folding trajectories, note that this normalization is dif-ferent from that inFig 5A). Native and nonnative contacts are shown, respectively, in the lower-right and upper-left (below and above the main diagonal). (A, B) Contact probability maps of Im7 conformations with 0.8<Q<0.9 simulated using the db+MJhϕ(A) and db+hϕ
(B) models. (C) Contact probability map of Im9 conformations with 0.6<Q<0.8 in the db +MJhϕmodel. It is clear from these maps that among conformations withQ0.8, there are more nonnative contacts in the db+MJhϕmodel for Im7 than either the db+hϕmodel for Im7 or the db+MJhϕmodel for Im9. (D) Number of nonnative hydrophobic contacts (solid curves,
left vertical scale) and total nonnative hydrophobic interaction energyEHP(dotted curve, right vertical scale) in the db+MJhϕmodel for Im7 (black curves) and Im9 (blue curves) as functions
ofQ. (PDF)
S2 Fig. Putative structural details of the simulated Im7 folding intermediate ensemble.(A) The red ribbon was generated from a typical Cαconformation in the folding intermediate of the db+MJhϕmodel (selected fromFig 5Cof the main text) by first installing a complete back-bone and sidechains (green ribbon) using the MaxSprout software (www.ebi.ac.uk/Tools/ structure/maxsprout/) and then optimizing the resulting atomic conformation using the Swiss-PdbViewer software (http://spdbv.vital-it.ch/). Included for comparison is the native PDB structure of Im7 (1AYI, gray ribbon), wherein the four native helices are labeled as inFig 1in the main text. (B) The intermediate conformation with an optimized sidechain configuration. The red ribbon here is identical to that in (A). (C) Another conformation in the same folding intermediate ensemble. This conformation, which has a partially yet more substantially formed Helix II, is shown in the same format as that in (A). (D) The conformation in (C) with an opti-mized sidechain configuration, shown in the same format as that in (B).
(EPS)
S3 Fig. Pure native-centric models with no favorable nonnative effects cannot rationalize the major difference in folding behavior between Im7 and Im9.(A, B) Free energy profiles of db models with homogeneous Gōpotentials [black curve in (A) for Im7, blue curve in (B)
for Im9] are compared with those with heterogeneous MJ Gō(native-centric) potentials [red
curves in both (A) and (B)]. The profile for each model is computed near the model’s transition midpoint [kBT= 0.76 for the black profile in (A),kBT= 0.80 for the other three profiles in (A) and (B)]. The profiles show that the folding thermodynamics of models with homogeneous Gō
using the same line styles as those in (C) and (D). [Note that the referenceQ-dependences themselves now become they= 0 horizontal gray lines in (E) and (F).] Position of peaks and minima along the free energy profiles in (A) and (B) are marked by the dotted vertical lines in (E) and (F) as well. By construction, the free energy profile of every model in (A) and (B) is given byE(Q)/kBT−S(Q)/kBof the model in (C) or (D) or, equivalently,ΔE(Q)/kBT−ΔS(Q)/
kBof the model in (E) and (F). The data shown in (E) and (F) show that for a given Gōmodel setup (with either homogeneous or heterogeneous interactions), theQ-dependence of energy and entropy exhibits similar trends for Im7 and Im9, indicating that the nature of the Im7 and Im9 equilibrium intermediates (observed in the models with MJ Gōinteractions) are rather
similar. In both cases, the second barrier atQ0.9 in the MJ Gōmodel arises from a decrease
in conformational entropy with respect to increasingQ(from0.8 to0.9) that is not fully compensated by a corresponding decrease in energy. (G, H) Snapshots of conformations with
Qvalues corresponding to the thermodynamic intermediate states in the models with MJ Gō
interactions for Im7 (G) and Im9 (H). The blue and red spheres correspond, respectively, to the N- and C-termini of the conformations. Snapshots for the models with homogeneous Gō
and MJ Gōinteractions are depicted by green and red traces respectively. The black traces
rep-resent the PDB structures of Im7 (G) and Im9 (H). TheQvalue for the Im7 snapshots [green and red traces in (G)] isQ= 0.838, that for the Im9 snapshots [green and red traces in (H)] is
Q= 0.762. These drawings show quite clearly that the intermediate Im7 and Im9 conforma-tions in the MJ Gōmodels are largely native. The only regions that deviate significantly from
the native conformation are a short disordered C-terminal segment for Im7 (G) and short dis-ordered N- and C-terminal segments for Im9 (H). Comparing the red and green traces in (G) and (H) indicates that the equilibrium intermediates in the Im7 and Im9 models with MJ Gō
interactions are a consequence of these models’significantly higher degree of disorder of the C-terminal region relative to that in models with homogeneous Gōinteractions. The
C-termi-nal regions are more disordered in the MJ Gōmodels because each of the amino acid sequences
for the regions (GKPGFKQG for Im7 and GKSGFKQG for Im9) contains only one hydropho-bic residue. As a result, the favorable interaction between the C-terminal sequence and the rest of the protein is weak when MJ energies are used for the Gōinteractions. As discussed in the
main text, the present results in this figure may be compared with those reported inFig 7of Karanicolas and Brooks [Karanicolas J, Brooks CL (2003) Improved Gō-like models
demon-strate the robustness of protein folding mechanisms towards non-native interactions.J Mol Biol334:309–325].
(EPS)
S4 Fig. Mutational effects on Im9 folding.Results are for db+MJhϕ[(A) and (C)] and a vari-ant of the model [WT; (B) and (D)] for Im9 in which the strength of the nine native contact
left) contact probability maps (color scale on right) for conformations with 0.8<Q<0.9 along folding trajectories of the V37L/E41V/V71I triple mutant in the two models simulated under strongly folding conditions similar to those inFig 4of the main text [/kBT= 1.42 for (A) and 1.45 for (B)]. As inFig 5of the main text, the maps provide occurrence probabilities of contacts in a putative intermediate-state ensemble. (C) Kinetic FP profiles (as inFig 4Din the main text) of the wildtype (WT), the V37L/V71I double mutant, and the V37L/E41V/V71I tri-ple mutant in the db+MJhϕmodel. (D) Same as (C) but in the above-defined variant of the db
+MJhϕmodel. Note that the wildtype (WT) profile in this model is different from that shown
in (C). (EPS)
S5 Fig. Folding behaviors in variants of the db+hϕmodel with homogeneous nonnative hy-drophobic interactions.Kinetic FP profiles (defined as in Fig4Cand4Dof the maintext) under folding conditions corresponding to zero denaturant concentration are shown for vari-ants of the db+hϕmodel of (A) Im7 and (B) Im9 with uniformκ
ij=−1.0 but different values for the overall hydrophobic strengthKHP= 1.1 (blue curves), 1.2 (magenta curves), and 1.3
(red curves). Shown in black are theKHP= 1 kinetic FP profiles for the original db+hϕmodel;
theses black profiles correspond to the dashed curves in Fig4Cand4Dof the maintext. The na-tive interaction strengths used to compute the present model zero-denaturant results forKHP=
1.0, 1.1, 1.2, and 1.3 are, respectively,/kBT= 1.45, 1.47, 1.54, and 1.64 for Im7 (A); and
/kBT= 1.36, 1.38, 1.40, and 1.45 for Im9 (B). (EPS)
S6 Fig. Conformational distributions under different restraining potentials.The distribu-tions of model Im7 conformational population under restraining (bias) potential
VbiasðQ;Q0Þ ¼KQQ~ 2
nðQ Q0Þ 2
at simulation temperatureT= 0.704 (free energy of foldingΔG −4.1kBT) withKQ= 0.025 (A), 0.05 (B), 0.075 (C), and 0.1 (D) are shown for the 64 equally-spacedQ0values used in this work.KQ= 0.1 is used to obtain the results in the main text. Note that all distributions for individualQ0are Gaussian-like forKQ= 0.05, 0.075, and 0.1 (B, C, and D); but some of the distributions at higher values ofQ0are clearly non-Gaussian forKQ= 0.025 (A).
(PDF)
S7 Fig. Coordinate-dependent diffusion coefficientD(Q) for the present model Im7 at sim-ulation temperatureT= 0.704 is estimated using 64 differentQ0values (as inS3 Fig) for
KQ= 0.05 (green), 0.075 (red), and 0.1 (black).The resultingD(Q) functions are very similar
within this range ofKQvalues. (PDF)
S8 Fig. Coordinate-dependent diffusion coefficient for chymotrypsin inhibitor 2 (CI2).(A) Conformational distributions of model CI2 under restraining potentialsVbias(Q,Q0) withKQ= 0.01 andQ0= 0.1, 0.2,. . .0.9. (B) TheD(Q) functions for CI2 we computed using the
the colleagues at SciNet of Compute Canada.
Author Contributions
Conceived and designed the experiments: TC HSC. Performed the experiments: TC HSC. Ana-lyzed the data: TC HSC. Wrote the paper: TC HSC.
References
1. Jackson SE, Fersht AR. Folding of chymotrypsin inhibitor 2. 2. Influence of proline isomerization on the folding kinetics and thermodynamic characterization of the transition state of folding. Biochemistry. 1991; 30:10436–10443. doi:10.1021/bi00107a011PMID:1931968
2. Baker D. A surprising simplicity to protein folding. Nature. 2000; 405:39–42. doi:10.1038/35011000
PMID:10811210
3. Sosnick TR, Barrick D. The folding of single domain proteins—Have we reached a consensus? Curr Opin Struct Biol. 2011; 21:12–24.
4. GōN. Theoretical studies of protein folding. Annu Rev Biophys Bioeng. 1983; 12:183–210. doi:10. 1146/annurev.bb.12.060183.001151PMID:6347038
5. Bryngelson JD, Wolynes PG. Spin glasses and the statistical mechanics of protein folding. Proc Natl Acad Sci USA. 1987; 84:7524–7528. doi:10.1073/pnas.84.21.7524PMID:3478708
6. Leopold PE, Montal M, Onuchic JN. Protein folding funnels: A kinetic approach to the sequence-struc-ture relationship. Proc Natl Acad Sci USA. 1992; 89:8721–8725. doi:10.1073/pnas.89.18.8721
PMID:1528885
7. Bryngelson JD, Onuchic JN, Socci ND, Wolynes PG. Funnels, pathways, and the energy landscape of protein folding: A synthesis. Proteins. 1995; 21:167–195. doi:10.1002/prot.340210302PMID:
7784423
8. Dill KA, Chan HS. From Levinthal to pathways to funnels. Nature Struct Biol. 1997; 4:10–19. doi:10. 1038/nsb0197-10PMID:8989315
9. Ferreiro DU, Komives EA, Wolynes PG. Frustration in biomolecules. Q Rev Biophys. 2014; 47:285–
363. doi:10.1017/S0033583514000092PMID:25225856
10. Chan HS, Dill KA. Transition states and folding dynamics of proteins and heteropolymers. J Chem Phys. 1994; 100:9238–9257. doi:10.1063/1.466677
11. Brockwell DJ, Radford SE. Intermediates: Ubiquitous species on folding energy landscapes? Curr Opin Struct Biol. 2007; 17:30–37. doi:10.1016/j.sbi.2007.01.003PMID:17239580
12. Bartlett AI, Radford SE. An expanding arsenal of experimental methods yields an explosion of insights into protein folding mechanisms. Nature Struct Mol Biol. 2009; 16:582–588. doi:10.1038/nsmb.1592 13. Chen T, Song J, Chan HS. Theoretical perspectives on nonnative interactions and intrinsic disorder in
protein folding and binding. Curr Opin Struct Biol. 2015; 30:32–42. doi:10.1016/j.sbi.2014.12.002 14. Whittaker SB-M, Spence GR, Grossmann JG, Radford SE, Moore GR. NMR analysis of the
conforma-tional properties of the trapped on-pathway folding intermediate of the bacterial immunity protein Im7. J Mol Biol. 2007; 366:1001–1015. doi:10.1016/j.jmb.2006.11.012PMID:17188712
16. Ferguson N, Capaldi AP, James R, Kleanthous C, Radford SE. Rapid folding with and without popu-lated intermediates in the homologous four-helix proteins Im7 and Im9. J Mol Biol. 1999; 286:1597–
1608. doi:10.1006/jmbi.1998.2548PMID:10064717
17. Capaldi AP, Shastry MCR, Kleanthous C, Roder H, Radford SE. Ultrarapid mixing experiments reveal that Im7 foldsviaan on-pathway intermediate. Nature Struct Biol. 2001; 8:68–72. doi:10.1038/83074
PMID:11135674
18. Gorski SA, Capaldi AP, Kleanthous C, Radford SE. Acidic conditions stabilise intermediates populat-ed during the folding of Im7 and Im9. J Mol Biol. 2001; 312:849–863. doi:10.1006/jmbi.2001.5001
PMID:11575937
19. Capaldi AP, Kleanthous C, Radford SE. Im7 folding mechanism: misfolding on a path to the native state. Nature Struct Biol. 2002; 9:209–216. PMID:11875516
20. Friel CT, Capaldi A, Radford SE. Structural analysis of the rate-limiting transition states in the folding of Im7 and Im9: Similarities and differences in the folding of homologous proteins. J Mol Biol. 2003; 326:293–305. doi:10.1016/S0022-2836(02)01249-4PMID:12547210
21. Friel CT, Beddard GS, Radford SE. Switching two-state to three-state kinetics in the helical protein Im9 via the optimisation of stabilising non-native interactions by design. J Mol Biol. 2004; 342:261–
273. doi:10.1016/j.jmb.2004.06.076PMID:15313622
22. Pashley CL, Morgan GJ, Kalverda AP, Thompson GS, Kleanthous C, Radford SE. Conformational properties of the unfolded state of Im7 in nondenaturing conditions. J Mol Biol. 2012; 416:300–318. doi:10.1016/j.jmb.2011.12.041PMID:22226836
23. Ikai A, Tanford C. Kinetic evidence for incorrectly folded intermediate states in refolding of denatured proteins. Nature. 1971; 230:100–102. doi:10.1038/230100a0PMID:4927005
24. Tsong TY, Baldwin RL, Elson EL. The sequential unfolding of ribonuclease A: Detection of a fast initial phase in the kinetics of folding. Proc Natl Acad Sci USA. 1971; 68:2712–2715. doi:10.1073/pnas.68. 11.2712PMID:5288248
25. Kim PS, Baldwin RL. Intermediates in the folding reactions of small proteins. Annu Rev Biochem. 1990; 59:631–660. doi:10.1146/annurev.bi.59.070190.003215PMID:2197986
26. Sutto L, Lätzer J, Hegler JA, Ferreiro DU, Wolynes PG. Consequences of localized frustration for the folding mechanism of the IM7 protein. Proc Natl Acad Sci USA. 2007; 104:19825–19830. doi:10. 1073/pnas.0709922104PMID:18077415
27. Friel CT, Smith DA, Vendruscolo M, Gsponer J, Radford SE. The mechanism of folding of Im7 reveals competition between functional and kinetic evolutionary constraints. Nature Struct Mol Biol. 2009; 16:318–324. doi:10.1038/nsmb.1562
28. Levin KB, Dym O, Albeck S, Magdassi S, Keeble AH, Kleanthous C, et al. Following evolutionary paths to protein-protein interactions with high affinity and selectivity. Nature Struct Mol Biol. 2009; 16:1049–1055. doi:10.1038/nsmb.1670
29. Sikosek T, Chan HS. Biophysics of protein evolution and evolutionary protein biophysics. J R Soc In-terface. 2014; 11:20140419. doi:10.1098/rsif.2014.0419PMID:25165599
30. Paci E, Friel CT, Lindorff-Larsen K, Radford SE, Karplus M, Vendruscolo M. Comparison of the transi-tion state ensembles for folding of Im7 and Im9 determined using all-atom molecular dynamics simula-tions withϕvalue restraints. Proteins. 2004; 54:513–525. doi:10.1002/prot.10595PMID:14747999 31. Karanicolas J, Brooks CL. Improved Gō-like models demonstrate the robustness of protein folding
mechanisms towards non-native interactions. J Mol Biol. 2003; 334:309–325. doi:10.1016/j.jmb. 2003.09.047PMID:14607121
32. Kaya H, Chan HS. Origins of chevron rollovers in non-two-state protein folding kinetics. Phys Rev Lett. 2003; 90:258104. doi:10.1103/PhysRevLett.90.258104PMID:12857173
33. Gosavi S, Chavez LL, Jennings PA, Onuchic JN. Topological frustration and the folding of interleukin-1β. J Mol Biol. 2006; 357:986–996. doi:10.1016/j.jmb.2005.11.074PMID:16469330
34. Zhang Z, Chan HS. Native topology of the designed protein Top7 is not conducive to cooperative fold-ing. Biophys J. 2009; 96:L25–L27. doi:10.1016/j.bpj.2008.11.004PMID:19186118
35. Ferreiro DU, Hegler JA, Komives EA, Wolynes PG. Localizing frustration in native proteins and protein assemblies. Proc Natl Acad Sci USA. 2007; 104:19819–19824. doi:10.1073/pnas.0709915104
PMID:18077414
36. Adhikari AN, Freed KF, Sosnick TR. De novo prediction of protein folding pathways and structure using the principle of sequential stabilization. Proc Natl Acad Sci USA 2012; 109:17442–17447. doi:
10.1073/pnas.1209000109PMID:23045636
6479. doi:10.1039/c3cp54866jPMID:24554086
43. Chan HS, Zhang Z, Wallin S, Liu Z. Cooperativity, local-nonlocal coupling, and nonnative interactions: Principles of protein folding from coarse-grained models. Annu Rev Phys Chem. 2011; 62:301–326. doi:10.1146/annurev-physchem-032210-103405PMID:21453060
44. Shea J-E, Nochomovitz YD, Guo Z, Brooks CL. Exploring the space of protein folding Hamiltonians: The balance of forces in a minimalist beta-barrel model. J Chem Phys. 1998; 109:2895–2903. doi:
10.1063/1.476842
45. Kaya H, Chan HS. Energetic components of cooperative protein folding. Phys Rev Lett. 2000; 85:4823–4826. doi:10.1103/PhysRevLett.85.4823PMID:11082661
46. Yadahalli S, Rao VVHG, Gosavi S. Modeling non-native interactions in designed proteins. Israel J Chem. 2014; 54:1230–1240. doi:10.1002/ijch.201400035
47. Zarrine-Afsar A, Wallin S, Neculai AM, Neudecker P, Howell PL, Davidson AR, et al. Theoretical and experimental demonstration of the importance of specific nonnative interactions in protein folding. Proc Natl Acad Sci USA. 2008; 105:9999–10004. doi:10.1073/pnas.0801874105PMID:18626019 48. Azia A, Levy Y. Nonnative electrostatic interactions can modulate protein folding: Molecular dynamics
with a grain of salt. J Mol Biol. 2009; 393:527–542. doi:10.1016/j.jmb.2009.08.010PMID:19683007 49. Zhang Z, Chan HS. Competition between native topology and nonnative interactions in simple and
complex folding kinetics of natural and designed proteins. Proc Natl Acad Sci USA. 2010; 107:2920–
2925. doi:10.1073/pnas.0911844107PMID:20133730
50. Shental-Bechor D, Smith MTJ, MacKenzie D, Broom A, Marcovitz A, Ghashut F, et al. Nonnative inter-actions regulate folding and switching of myristoylated protein. Proc Natl Acad Sci USA. 2012; 109:17839–17844. doi:10.1073/pnas.1201803109PMID:22847411
51. Zarrine-Afsar A, Zhang Z, Schweiker KL, Makhatadze GI, Davidson AR, Chan HS. Kinetic conse-quences of native state optimization of surface-exposed electrostatic interactions in the Fyn SH3 do-main. Proteins. 2012; 80:858–870. doi:10.1002/prot.23243PMID:22161863
52. Miyazawa S, Jernigan RL. Self-consistent estimation of inter-residue protein contact energies based on an equilibrium mixture approximation of residues. Proteins. 1999; 34:49–68. doi:10.1002/(SICI) 1097-0134(19990101)34:1%3C49::AID-PROT5%3E3.0.CO;2-LPMID:10336383
53. Fauchère J-L, Pliška V. Hydrophobic parametersΠof amino-acid side chains from the partitioning of
N-acetyl-amino-acid amides. Eur J Med Chem-Chem Therm. 1983; 18:369–375.
54. Socci ND, Onuchic JN, Wolynes PG. Diffusive dynamics of the reaction coordinate for protein folding funnels. J Chem Phys. 1996; 104:5860–5868. doi:10.1063/1.471317
55. Hummer G. Position-dependent diffusion coefficients and free energies from Bayesian analysis of equilibrium and replica molecular dynamics simulation. New J Phys. 2005; 7:34. doi: 10.1088/1367-2630/7/1/034
56. Chahine J, Oliveira RJ, Leite VBP, Wang J. Configuration-dependent diffusion can shift the kinetic transition state and barrier height of protein folding. Proc Natl Acad Sci USA. 2007; 104:14646–
14651. doi:10.1073/pnas.0606506104PMID:17804812
57. Best RB, Hummer G. Coordinate-dependent diffusion in protein folding. Proc Natl Acad Sci USA. 2010; 107:1088–1093. doi:10.1073/pnas.0910390107PMID:20080558
58. Xu W, Lai Z, Oliveira RJ, Leite VBP, Wang J. Configuration-dependent diffusion dynamics of downhill and two-state protein folding. J Phys Chem B. 2012; 116:5152–5159. doi:10.1021/jp212132vPMID:
22497604
60. Waldauer SA, Bakajin O, Lapidus LJ. Extremely slow intramolecular diffusion in unfolded protein L. Proc Natl Acad Sci USA. 2010; 107:13713–13717. doi:10.1073/pnas.1005415107PMID:20643973 61. Soranno A, Buchli B, Nettels D, Cheng RR, Müller-Späth S, Pfeil SH, et al. Quantifying internal friction in unfolded and intrinsically disordered proteins with single-molecule spectroscopy. Proc Natl Acad Sci USA. 2012; 109:17800–17806. doi:10.1073/pnas.1117368109PMID:22492978
62. de Sancho D, Sirur A, Best RB. Molecular origins of internal friction effects on protein-folding rates. Nature Communications. 2014; 5:4307. doi:10.1038/ncomms5307PMID:24986114
63. Echeverria I, Makarov DE, Papoian GA. Concerted dihedral rotations give rise to internal friction in un-folded proteins. J Am Chem Soc. 2014; 136:8708–8713. doi:10.1021/ja503069kPMID:24844314 64. Knott M, Chan HS. Criteria for downhill protein folding: Calorimetry, chevron plot, kinetic relaxation, and single-molecule radius of gyration in chain models with subdued degrees of cooperativity. Pro-teins. 2006; 65:373–391. doi:10.1002/prot.21066PMID:16909416
65. Bartlett AI, Radford SE. Desolvation and development of specific hydrophobic core packing during Im7 folding. J Mol Biol. 2010; 396:1329–1345. doi:10.1016/j.jmb.2009.12.048PMID:20053361 66. Plaxco KW, Simons KT, Baker D. Contact order, transition state placement and the refolding rates of
single domain proteins. J Mol Biol. 1998; 277:985–994. doi:10.1006/jmbi.1998.1645PMID:9545386 67. Kaya H, Chan HS. Simple two-state protein folding kinetics requires near-Levinthal thermodynamic
cooperativity. Proteins. 2003; 52:510–523. doi:10.1002/prot.10506PMID:12910451
68. Kaya H, Liu Z, Chan HS. Chevron behavior and isostable enthalpic barriers in protein folding: Suc-cesses and limitations of simple Gō-like modeling. Biophys J. 2005; 89:520–535. doi:10.1529/ biophysj.104.057471PMID:15863486
69. Guex N, Peitsch MC, Schwede T. Automated comparative protein structure modeling with SWISS-MODEL and Swiss-PdbViewer: A historical perspective. Electrophoresis. 2009; 30:S162–S173. doi:
10.1002/elps.200900140PMID:19517507
70. Holm L, Sander C. Database algorithm for generating protein backbone and side-chain co-ordinates from a Cαtrace. Application to model building and detection of co-ordinate errors. J Mol Biol. 1991; 218:183–194. doi:10.1016/0022-2836(91)90883-8PMID:2002501
71. Miyazawa S, Jernigan RL. Residue-residue potentials with a favorable contact pair term and an unfa-vorable high packing density term, for simulation and threading. J Mol Biol. 1996; 256:623–644. doi:
10.1006/jmbi.1996.0114PMID:8604144
72. Cho SS, Levy Y, Wolynes PG. Quantitative criteria for native energetic heterogeneity influences in the prediction of protein folding kinetics. Proc Natl Acad Sci USA. 2009; 106:434–439. doi:10.1073/ pnas.0810218105PMID:19075236
73. Meyer EA, Castellano RK, Diederich F. Interactions with aromatic rings in chemical and biological rec-ognition. Angew Chem Int Ed. 2003; 42:1210–1250. doi:10.1002/anie.200390319
74. Sobolev V, Wade RC, Vriend G, Edelman M. Molecular docking using surface complementarity. Pro-teins. 1996; 25:120–129. doi:10.1002/(SICI)1097-0134(199605)25:1%3C120::AID-PROT10%3E3. 3.CO;2-1PMID:8727324
75. Sobolev V, Sorokine A, Prilusky J, Abola EE, Edelman M. Automated analysis of interatomic contacts in proteins. Bioinformatics. 1999; 15:327–332. doi:10.1093/bioinformatics/15.4.327PMID:10320401 76. Stoycheva AD, Brooks CL, Onuchic JN. Gatekeepers in the ribosomal protein S6: Thermodynamics,
kinetics, and folding pathways revealed by a minimalist protein model. J Mol Biol. 2004; 340:571–
585. doi:10.1016/j.jmb.2004.04.073PMID:15210355
77. Tzul FO, Schweiker KL, Makhatadze GI. Modulation of folding energy landscape by charge-charge in-teractions: Linking experiments with computational modeling. Proc Natl Acad Sci USA. 2015; 112: E259–E266. doi:10.1073/pnas.1410424112PMID:25564663
78. Knowling SE, Figueiredo AM, Whittaker SB-M, Moore GR, Radford SE. Amino acid insertion reveals a necessary three-helical intermediate in the folding pathway of the colicin E7 immunity protein Im7. J Mol Biol. 2009; 392:1074–1086. doi:10.1016/j.jmb.2009.07.085PMID:19651139
79. Muñoz V, Serrano L. Development of the multiple sequence approximation within the AGADIR model ofα-helix formation: Comparison with the Zimm-Bragg and Lifson-Roig formalisms. Biopolymers. 1997; 41:495–509. doi: 10.1002/(SICI)1097-0282(19970415)41:5%3C495::AID-BIP2%3E3.0.CO;2-HPMID:9095674
80. Liu Z, Chan HS. Solvation and desolvation effects in protein folding: Native flexibility, kinetic coopera-tivity, and enthalpic barriers under isostability conditions. Phys Biol. 2005; 2:S75–S85. doi:10.1088/ 1478-3975/2/4/S01PMID:16280624