INTRODUCTION
A global increase in the prevalence of obesity in childhood is being reported.1 Asian countries are not immune to this phenomenon. A recent study conducted in South India found an increase in the proportion of overweight children from 4.9% in 2003 to 6.6% in 2005.2 Studies in children have established that increasing body mass index (BMI; Kg/m2) is associated with an increase in insulin resistance (IR).3,4
IR characterized by a decreased capacity of insulin to stimulate glucose uptake in muscles
and adipose tissue and in supression of hepatic glucose production. Obese adolescents are found to have IR which increases the risk for development of type 2 diabetes mellitus (T2DM) and cardiovascular diseases (CVD).5 IR is found to play an important role in the development of metabolic syndrome (MetS) also known as syndrome X.6 IR may have a role in the development of early structural atherosclerotic vascular changes in children with obesity.7 Hence measurement of insulin sensitivity in paediatric obesity is required to assess the IR.
Original Article:
Indices of insulin resistance in paediatric obesity
T. Chandrasekhar,1 M.M. Suchitra,1 Alok Sachan,2 Aparna R. Bitla,1 P.V.L.N. Srinivasa Rao1 Departments of 1Biochemistry, 2Endocrinology, Sri Venkateswara Institute of Medical Sciences, Tirupati
ABSTRACT
Background: Paediatric obesity is associated with insulin resistance (IR), which increases risk of type 2 diabetes mellitus (T2DM) and cardiovascular diseases (CVD). Hyperinsulinaemic-euglycaemic clamp and minimal-model analysis frequently sampled intravenous glucose tolerance test (FSIVGTT) are used to assess IR, which are invasive, complex and expensive.
Objective: To assess IR using the derived indices namely, homeostasis model assessment of insulin resistance (HOMA-IR), fasting glucose-to-insulin ratio (FG(HOMA-IR), quantitative insulin-sensitivity check index (QUICKI), in obese children.
Methods: Fifty obese children (cases) and 50 apparently healthy age-and gender- matched non- obese children (controls) were studied. Obese children with body mass index (BMI; Kg/m2) greater than 95th percentile and
non-obese children with BMI between 5th to 95th percentile were included in the study.
Results: Obese children had higher fasting insulin levels, HOMA-IR (p<0.001), FGIR (p<0.001) and QUICKI (p<0.001) when compared to controls; fasting blood glucose levels were comparable (p=0.170). A statistically significant correlation was observed between serum insulin and BMI, between insulin and all the derived indices and between the derived indices and BMI (p<0.001). HOMA-IR had more area under the curve (0.760) followed by FGIR (0.721) when compared to QUICKI (0.240).
Conclusions: Obese children were normoglycaemic with IR. HOMA-IR was found to be a stronger predictor of IR when compared to FGIR and QUICKI in obese children.
Key Words: Insulin resistance, Homeostasis model assessment of insulin resistance, Fasting glucose-to-insulin ratio, Quantitative insulin-sensitivity check index, Paediatric obesity
Chandrasekhar T, Suchitra MM,Sachan A, Bitla AR, Srinivasa Rao PVLN. Indices of insulin resistance in paediatric obesity. J Clin Sci Res 2014;3:7-13.
Corresponding author:
Dr M.M.Suchitra, Associate Professor, Department of Biochemistry, Sri Venkateswara Institute of Medical Sciences, Tirupati, India.
e-mail: [email protected]
Received: 26 March, 2013.
Online access
There are various methods for assesssing insulin sensitivity, such as, the well accepted hyperinsulinaemic-euglycaemic clamp8 and the minimal-model analysis frequently sampled intravenous glucose tolerance test (FSIVGTT).9 Though these are accepted methods they are complex invasive and expensive. The reliability of oral glucose tolerance test has been reported to similar to FSIVGTT and clamp technique in assessing insulin sensitivity,10 but its application in large populations is limited. A simpler and more practical method to measure insulin resistance, the homeostasis model assessment of IR (HOMA-IR) was, therefore, developed for application in large epidemiologic studies.11 HOMA-IR is calculated from fasting plasma glucose and serum insulin levels, which is an estimate of IR and is used as a surrogate marker of IR. HOMA-IR in normoglycaemic children was found to have a significant correlation with hyperinsuliaemic-euglycaemic clamp or FSIVGTT measurement.5,12-14 Quantitative insulin-sensitivity check index (QUICKI) is a derived index obtained by calculating the inverse of the sum of logarithmically expressed fasting glucose and insulin levels. It therefore expresses insulin sensitivity as an inverse of IR.15 Fasting glucose-to-insulin ratio (FGIR) have also been proposed to be useful in assessing insulin sensitivity,16 with FGIR having a strong significant positive correlation with insulin sensitivity in obese children and adolescents.5 QUICKI along with HOMA-IR have been found to correlate with the clamp technique in a cohort of normal and overweight paediatric cases.17 Hence the derived indices HOMA-IR, QUICKI and FGIR have been frequently applied in screening popula-tions.18-20
As IR is the prime forerunner for various risk factors, its assessment by valid and reliable methods is required. HOMA-IR, FGIR and QUICKI indicate presence of IR. However the
validity of these indices in paediatric obesity in Indian population needs to be evaluated.
Hence the present study was taken up to assess IR using the derived indices HOMA-IR, QUICKI and FGIR and to compare the strength of these indices in predicting IR in obese children.
MATERIAL AND METHODS
Fifty obese children (cases) in the age group of 5-17 years attending the paediatric endocrino-logy out-patient clinic at Sri Venkateswara Institute of Medical Sciences, Tirupati, were studied. Fifty apparently healthy age- and gender-matched non-obese children served as control subjects. Informed consent for partici-pating in the study was obtained from the parents / next responsible attendants. Obese children had a BMI of over 95th percentile for their age and gender as per the Centers for Disease Control and Prevention (CDC) growth charts 2000.21 Apparently healthy non-obese children had a BMI between 5th to 95th percentile for their age and sex. Under weight children (BMI < 5th percentile for age and gender), children with other endocrine disorders such as hypothyroidism, Cushing’s syndrome, type 1 diabetes mellitus, obesity syndromes, renal and liver diseases, active infection, those on medication and those who were unwilling to participate in the study were excluded from the study. The study was approved by the Institutional Ethics Committee. In all subjects, systolic, diastolic blood pressure and anthropometric measurements such as height (m), weight (Kg) were recorded and BMI (Kg/m2) was calculated.
Sample collection
glucose estimation and two mL was transferred into additive free plain bottle for estimation of insulin. The plain samples were allowed to stand for 30 min and then centrifuged at 3000 rpm for 15 minutes. Serum was separated and stored at –80 oC until analysis. Sodium fluoride/ potassium oxalate samples were centrifuged immediately and the plasma separated and analyzed for glucose on the same day. Glucose assay was performed by glucose oxidase peroxidase method using a commercial kit (Aspen Laboratories Pvt. Ltd., Delhi, India) on an autoanalyzer (Synchron CX9; Beckman Co ulter, CA, USA). Insulin assay was performed by radioimmunoassay method using a commercial kit (Immunotech, Prague, Czech Republic) on automated gamma counter (Wallac, California, USA). The derived indices for IR namely, HOMA-IR [fasting glucose (mmol/L) × fasting insulin (µIU/mL)/22.5], QUICKI [(1/log fasting insulin (µIU/mL) + log fasting glucose (mg/dL)] and FGIR (fasting plasma glucose/ serum insulin ratio)12 were calculated.
Statistical Analysis
The distribution of continuous variables was tested using Kolmogorov-Smirnov test. Comparison of the mean values for the variables between the groups was done using unpaired student t-test for data with normal distribution. Mann-Whitney U-test was used for comparing variables which were not normally distributed. Spearman rank correlation was used to test the correlations among the variables. Receiver operater characteristic curve (ROC) analysis was performed to study the strength of the derived indices in predicting IR. A p-value of less than 0.05 was considered statistically significant. The statistical analysis was performed using statistical software, SPSS version 11.5 (SPSS, Inc., Chicago IL).
RESULTS
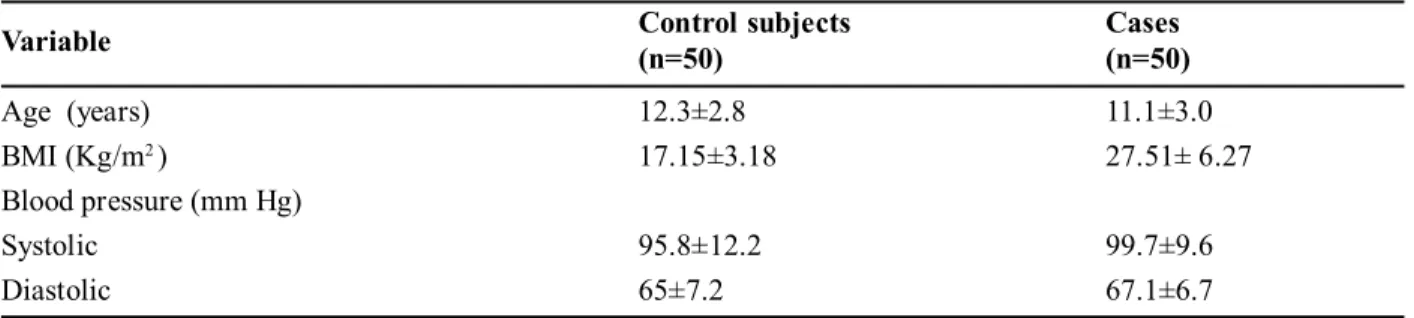
Table 1 shows the baseline characteristics of the cases and controls. Table 2 sho ws comparison of the biochemical and derived indices between cases and controls. No
Table 1: Baseline characteristics of cases and control subjects*
Control subjects Cases
Variable
(n=50) (n=50)
Age (years) 12.3±2.8 11.1±3.0
BMI (Kg/m2 ) 17.15±3.18 27.51± 6.27
Blood pressure (mm Hg)
Systolic 95.8±12.2 99.7±9.6
Diastolic 65±7.2 67.1±6.7
*Data are presented as mean ±SD
BMI = body mass index; SD= standard deviation
Table 2: Biochemical and derived indices in cases and control subjects*
Parameter Control Cases p-value
(n=50) (n=50)
FBG (mg/dL) 83.32±11.8 86.10±7.3 0.170
Insulin (µIU/mL) 6.98± 3.28 12.85± 7.51 <0.001
HOMA-IR 1.68± 1.03 3.05± 2.62 <0.001
FGIR 0.13±0.27 0.17±0.16 <0.001
QUICKI 0.38±0.04 0.36±0.16 <0.001
*Data are presented as mean ±SD
significant change in fasting blood glucose sugar was observed in cases when compared to controls (p=0.170). A significant higher fasting insulin levels were observed in obese children when compared to controls. The derived indices of IR, HOMA-IR, FGIR and QUICKI were significantly greater in cases when compared to controls.
Table 3 shows the association between Insulin, derived indices and BMI. A statistically significant correlation was observed between insulin and BMI, between insulin and all the derived indices and between the derived indices and BMI (p<0.0001).
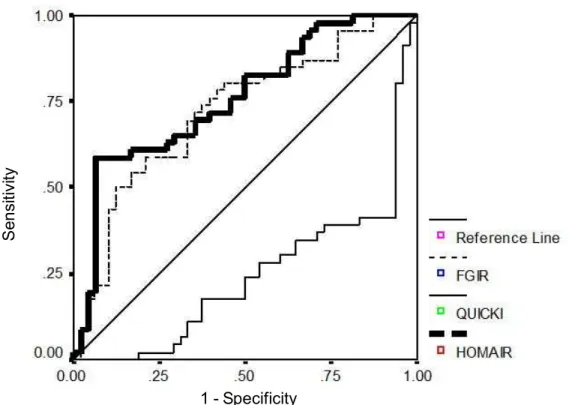
Among the derived indices, the area under the curve (AUC) was more for HOMA-IR (0.760) followed by FGIR (0.721) when compared to QUICKI (0.240) (Figure 1, Table 4).
DISCUSSION
Childhood obesity is associated with several metabolic changes such as IR, impaired glucose tolerance and T2DM.22 Among these obesity is particularly associated with the presence of IR.23 In obesity, IR increases the risk for development of hypertension, dyslipidaemia and metabolic syndrome. IR is also associated with the presence of systemic inflammation,
Table 3: Association of anthropometry, biochemical and derived indices
BMI Insulin HOMA-IR FGIR QUICKI
BMI - r = 0.519 r = 0.479 r = 0.428 r = –0.411
(p<0.001) (p<0.001) (p<0.001) (p<0.001)
Insulin - - r = 0.988 r = 0.975 r = –0.928
(p<0.001) (p<0.001) (p<0.001)
r = correlation co-efficient; HOMA-IR = homeostasis model assessment of insulin resistance; FGIR = fasting glucose-to-insulin ratio: QUICKI = quantitative insulin-sensitivity check index
Figure1: ROC curves of IR indices studied
IR = insulin resistance ; HOMA IR = homeostasis model assessment of insulin resistance; FGIR = fasting glucose-to-insulin ratio; QUICKI = quantitative glucose-to-insulin-sensitivity check index
1 - Specificity
S
e
n
si
ti
vi
endothelial dysfunction and atherosclerosis, which contribute to the risk of CVD.22 Hence it is necessary to measure insulin sensitivity in order to assess the presence of IR in obese children. The well accepted h yperinsulinaemic-euglycaemic clamp technique requires a steady intravenous infusion of insulin in one arm and a variable intravenous glucose infusion in the other arm with collection of a number of blood samples to monitor serum glucose levels. FSIVGTT is comparatively less labor intensive than clamp techniques, however, it also requires
multiple blood samples over a prolonged
period.24Hence these two techniques have been
claimed as being invasive, labor intensive and expensive. The derived indices HOMA-IR, QUICKI and FGIR were found to correlate well with IR and HOMA-IR was described as being
a practical alternative for detecting IR.25
HOMA-IR was found to be greater in obese children when compared to healthy lean controls in the present study. The other measures FGIR and QUICKI were also found to be greater in the obese children when compared to controls.
A high fasting insulin concentration has been identified as an independent CVD risk factor and there is now considerable evidence demonstrat ing a link between o besity (particularly central obesity) and hyper-insulinemia in children.26 A research in Singaporean adults has revealed a relationship between BMI, abdominal diameter and insulin resistance.26,27 It has been reported that in children and adolescents the measurement of fasting insulin levels in the presence of
normoglycaemia may be an indicator of IR, which is as good as HOMA-IR, FGIR and QUICKI.22 However the variability of insulin measurements between laboratories makes it difficult in comparing the insulin levels obtained from different studies.28 In the present study fasting insulin levels and HOMA-IR were found to be significantly higher in obese children when compared to controls and a positive significant correlation was observed between HOMA-IR and insulin. Similarly FGIR was also found to correlate positively with fasting insulin levels. QUICKI was found to have a significant negative correlation with insulin, indicating its inverse relation with IR.15 However, no significant difference in the fasting blood glucose levels was observed between the cases and controls. Subjects with IR have hyperinsulinemia with normal or elevated blood glucose levels.12 In this study the derived indices HOMA-IR, FGIR and QUICKI were found to significantly reflect IR in obese children who were normoglycemic. In the present study, higher HOMA-IR levels represent greater degrees of insulin resistance as the ROC curve analysis revealed greater area under the curve for HOMA-IR when compared to FGIR and QUICKI. Similar findings were reported in a study wherein HOMA-IR was found to be more reliable than FGIR and QUICKI and HOMAIR cut-off point of 3.16 was reported to yield a sensitivity of 76% and a specificity of 66% for diagnosis of IR in the obese children.12
Table 4: Comparison of AUC for HOMA-IR, FGIR and QUICKI
Variable AUC 95%CI p-value
HOMA-IR 0.760 0.662-0.857 <0.001
FGIR 0.721 0.617-0.825 <0.001
QUICKI 0.240 0.143-0.338 <0.001
BMI is a simple index of adiposity and is generally found to correlate with the higher insulin levels in obses children.29 In the present study also, a significant positive correlation between BMI and fasting insulin levels was observed. Similarly, the indices of IR, HOMA-IR and FGHOMA-IR were found to have a positive significant correlation with BMI. These findings document the association between obesity and hyperinsulinaemia as well as the derived indices of IR in children.
Obesity and IR sets the stage for the risk of T2DM with its associated risk factors such as CVD and IR is observed in the paediatric obese population. Hence screening this group of obese children for the presence of IR is of prime importance in arresting the progression of these risk factors into adulthood. In the search for practical and reliable tests to assess IR, HOMA-IR has emerged as a reliable diagnostic tool which is comparable with the clamp techniques. HOMA-IR is found to be a stronger predictor of IR when compared to FGIR and QUICKI in normoglycemic obese children.
ACKNOWLEDGEMENT
This study was funded by Indian Council of Medical Research (ICMR), New Delhi (3/2/ 2011-12/PG-thesis HRD-8) and ‘‘Sri Balaji Aro gya Varaprasadini scheme of Sri Venkateswara Institute of Medical Sciences, Tirupati’’.
REFERENCES
1. Kosti RI, Panagiotakos DB. The epidemic of obesity in children and adolescents in the world. Cent Eur J Public Health 2006;14:151-9.
2. Raj M, Sundaram KR, Paul M, Deepa AS, Kumar RK. Obesity in Indian children: time trends and relationship with hypertension. Natl Med J India 2007;20:288-93.
3. Cruz ML, Bergman RN, Goran MI. nique
effect of visceral fat on insulin sensiti-vity in obese
Hispanic children with a family history of type 2 diabetes. Diabetes Care 2002;25:1631-6.
4. Invitti C, Guzzaloni G, Gilardini L, Morabito
F, Viberti G. Prevalence and concomitants of
glucose intolerance in European obese children and adolescents. Diabetes Care 2003; 26:118-24.
5. Conwell LS, Trost SG, Brown WJ, Batch JA. Indexes of insulin resistance and secretion in obese children and adolescents: a validation study. Diabetes Care 2004;27:314-9.
6. Reaven GM. Role of insulin resistance in human disease. Diabetes 1988;37:1595-607.
7. Ten S, Maclar en N. In sulin r esistan ce
syndrome in children. J Clin Endocrinol Metab
2004;89:2526-39.
8. DeFronzo RA, Tobin JD, Andres R. Glucose clamp technique: a method for quantifying insulin secr etion an d r esistan ce. Am J Ph ysiol 1979;237:E214-23.
9. Matthews DR, Hosker JP, Rudenski AS, Naylor BA, Treacher DF, Turner RC. Homeostasis model assessment: insulin resistance and beta-cell function from fasting plasma glucose and insulin concentrations in man. Diabetologia 1985;28:412-9.
10. Matsuda M, DeFronzo RA. Insulin sensitivity indices obtained from oral glucose tolerance testing: comparison with the euglycemic insulin clamp. Diabetes Care 1999; 22:1462-70.
11. Matthews DR, Hosker JP, Rudenski AS, Naylor BA, Treacher DF, Turner RC. Homeostasis model assessment: insulin resistance and beta-cell function from fasting plasma glucose and insulin concentrations in man. Diabetologia 1985;28:412-9.
12. Keskin M, Kurtoglu S, Kendrirci M, Atabek ME, Yazici C. Homeostasis model assessment is more reliable than the fasting glucose/insulin ration and quantitative insulin sensitivity check index for assessing insulin resistance among obese children and adolescents. Pediatrics 2005;115:e500-3.
13. Gungor N, Saad R, Janosky J, Arslanian S. Validation of surrogate estimates of insulin sensitivity and insulin secretion in children and adolescents. J Pediatr 2004;144:47-55.
15. Mari A, Ahren B, Pacini G. Assessment of insulin secretion in relation to insulin resistance. Curr Opin Clin Nutr Metab Care 2005;8:529-33.
16. Legro RS, Finegood D, Dunaif A. A fasting glucose to insulin ratio is a useful measure of insulin sensitivity in women with polycystic ovary syndrome. J Clin Endocr in ol Metab 1998;83:2694-8.
17. Uwaifo GI, Fallon EM, Chin J, Elberg J, Parikh SJ, Yanovski JA. Indices of insulin action, disposal and secretion derived from fasting samples and clamps in normal glucose tolearnt black and white children. Diabetes Care 2002;25:2081-7.
18. Matthews DR, Hosker JP, Rudenski AS, Naylor BA, Treacher DF, Turner RC. Homeostasis model assessment: insulin resistance and beta-cell function from fasting plasma glucose and insulin concentrations in man. Diabetologia 1985;28:412-9.
19. Katz A, Nambi SS, Mather K, Baron AD, Follmann DA, Sullivan G, et al. Quan titative insulin sensitivity check index: a simple, accurate method for assessing insulin sensitivity in humans. J Clin Endocrinol Metab 2000;85:2402-10.
20. Cutfield WS, Jefferies CA, Jackson WE, Robinson EM, Hofman PL. Evaluation of HOMA and QUICKI as measures of insulin sensitivity in prepubertal children. Pediatr Diabetes 2003;4:119-25.
21. Kuczmarski RJ, Ogden CL, Grummer-Strawn
LM, Flegal KM, Guo SS, Wei R, et al. CDC growth
charts: United States. Adv Data 2000;314:1-27.
22. Chiarelli F, Marcovecchio ML. Insulin resistance and obesity in childhood. Eur J Endocrinol 2008;15:S67-S74.
23. Weiss R, Kaufman FR. Metabolic complications of childhood obesity: identifying and mitigating the risk. Diabetes Care 2008;31:S310-6.
24. McAuley KA, Williams SM, Mann JI, Walker RJ, Lewis-Barned NJ, Temple LA, et al. Diagnosing insulin resistance in the general population. Diabetes Care 2001;24:460-4.
25. Lee JM, Herman WH, Okumura MJ, Gurney JG, Davis MM. Prevalence and determinants of insulin resistance among U.S.adolescents; a population-based study. Diabetes Care 2006;29:2427-32.
26. Stensel DJ, Lin FP, Ho TF, Aw TC. Serum lipids, serum insulin, plasma fibrinogen and aerobic capacity in obese and non-obese Singaporean boys. Int J Obes 2001;25:984-9.
27. Hughes K, Aw TC, Kuperan P, Choo M. Central obesity, insulin resistance, syndrome X, lipoprotein (a), and cardiovascular risk in Indians, Malays and Chinese in Singapore. J Epidemiol Community Health 1997;51:394-9.
28. Borai A, Livingstone C, Ferns GA. The biochemical assessment of insulin resistance. Ann Clin Biochem 2007;44:324-42.