Design of an instrument to measure
the quality of care in Physical Therapy
Delineamento de um instrumento para medir a qualidade
da assistência da Fisioterapia
Leny Vieira Cavalheiro1, Raquel Afonso Caserta Eid1, Claudia Talerman1, Cristiane do Prado1,
Fátima Cristina Martorano Gobbi1, Paola Bruno de Araujo Andreoli1
1 Hospital Israelita Albert Einstein, São Paulo, SP, Brazil.
Corresponding author: Leny Vieira Cavalheiro – Director of Care Practice – Avenida Albert Einstein, 627/701 – 6th floor, building D − Zip code: 05652-900 – São Paulo, SP, Brazil Phone: (55 11) 2151- 2672− E-mail: [email protected]
Received on: Aug 18, 2014 – Accepted on: Jan 12, 2015 Conflict of interest: none.
DOI: 10.1590/S1679-45082015GS3248 aBstRact
objective: To design an instrument composed of domains that would demonstrate physical therapy activities and generate a consistent index to represent the quality of care in physical therapy. methods:
the methodology Lean Six Sigma was used to design the tool. The discussion involved seven different management groups staff. By means of brainstorming and Cause & Effect Matrix, we set up the process map. Results: Five requirements composed the quality of care index in physical therapy, after application of the tool called Cause & Effect Matrix. The following requirements were assessed: physical therapist performance, care outcome indicator, adherence to physical therapy protocols, measure whether the prognosis and treatment outcome was achieved and Infrastructure. conclusion:
The proposed design allowed evaluating several items related to physical therapy service, enabling customization, reproducibility and benchmarking with other organizations. For management, this index provides the opportunity to identify areas for improvement and the strengths of the team and process of physical therapy care.
Keywords: Quality of health care; Measurements, methods and theories; Physical Therapy Specialty
ResUmo
objetivo: Delinear um instrumento composto de domínios que demonstrassem a atividade da área da Fisioterapia e que gerassem um índice consistente, capaz de representar a qualidade da assistência fisioterapêutica. métodos: Para o delineamento do instrumento, utilizamos a metodologia denominada Lean Seis Sigma. A discussão envolveu sete grupos de gestão diferentes e desta equipe de trabalho. Por meio das ferramentas de brainstorm e Matriz
de Causa e Efeito, montamos o mapa do processo. Resultados:
Cinco requisitos constituíram o índice de qualidade de assistência da Fisioterapia, após a aplicação da ferramenta denominada Matriz de Causa e Efeito. Os requisitos foram avaliação individual do desempenho do fisioterapeuta, indicador de resultado de assistência, avaliação da adesão da Fisioterapia nos protocolos, medir se o prognóstico e resultado de tratamento foi alcançado, e infraestrutura.
conclusão: O desenho proposto permitiu avaliar vários itens que compunhamo serviço de Fisioterapia, possibilitando customização, reprodutibilidade e benchmark entre as instituições. Para a gestão, esse índice deve proporcionar a oportunidade de identificar os pontos de melhoria, e os pontos fortes da equipe e processo de assistência da Fisioterapia.
descritores: Qualidade da assistência à saúde; Medidas, métodos e teorias; Fisioterapia
intRodUction
allow organizations to disclose their results. The next step after determining the indicators to be used in the project is sharing this information, announcing results and creating possibilities to improve healthcare services in the country and the quality of care in physical therapy.
In a brief retrospective analysis of the use of evaluations in healthcare, the oldest historical accounts can be found in ancient Greece. The classical philosophers already spoke about the use of standards of knowledge in the medical art. Plato, in some of his speeches, pointed to concepts of excellence and highlighted the importance of comparing these products with each other and most importantly with the respective standard.(1)
The development of tracking (monitoring) and evaluation instruments is a great challenge, because evaluating is quite different from meeting schedules, keeping track of the actions performed, and improvising. Therefore, we often need to create or improve evaluation indicators.
Indicators, as the name suggests, have the purpose of measuring specific situations. They are used as per conventional standards or can be created based on specific methodologies. Nowadays, there is an increasing number of qualitative assessments, which are mostly used in process evaluations. From this perspective, the use of evaluations with the development of indicators relevant to local realities can contribute not only to managerial work, but to the entire planning process.(2)
There is a solid concern with customer satisfaction and the quality of services provided. In evaluation,
emphasis is given to the effectiveness of actions, i.e.
to the impact exerted by the results of those actions/ services. Effectiveness means resulting in changes in a certain reality or transforming a certain situation. This concept is widely used to evaluate results.
Thus, some healthcare settings seem to encourage this type of approach. As of 1990, initiatives related to the process of hospital accreditation started in Brazil. The Ministry of Health created the Brazilian Program of Hospital Accreditation, aiming to implement a process to improve patient care. This accreditation program promoted, through financial incentives for retrofitting and renovating hospitals, improvements in patient care
and hospital management.(3)
Many different tools can be used to monitor quality indicators. Surveys, charts and metrics can be used to measure and assess the quality of a service. This should provide the necessary information to improve the service at issue.
The tools we selected for this proposal are applicable to quality management. The first is brainstorming, a broad instrument capable of providing a more systemic view of the object at issue. To improve the focus, the most important aspects of the brainstorming were discussed point-by-point using a tool known as Cause & Effect Matrix. This allowed us to propose the instrument considering the variability between the service volume and the number of professionals. To this end, we developed a logical table, including the items to be evaluated with their proper weights, according to the volume and the type of physical therapy service.
The overall consensus showed that a complete and accurate set of quality indicators would enable organizations or companies to focus on their strengths and find the appropriate solutions for their weakenesses. The correct review and interpretation of quality indicators should be the goal of the efforts in order to
allow for appropriate decision-making.(4)
Quality is maintained through the constant assessment and reassessment of performance and efficiency. The quality of the product or service may even increase with the improvements or innovations implemented to push the bar. A service may become a reference after it has exceeded all others in terms of quality.(5)
Choosing the appropriate indicator for quality is essential for an accurate and detailed evaluation of a product or service. It is important that managers know which answers, in respect to indicators, they are looking for to develop their product or service. Being able to provide a superior product or service to customers represents a competitive advantage for any company or organization. Maintaining and improving quality is key for the success and sustainability of organizations.(6-8)
Managers are always seeking to prospect new customers, have quality and safety indicators, design new products, shorten production cycles and ensure employee satisfaction. The measure expected for this end is adding performance to the quality assurance process.
Considering the lack of consensus in the literature on which components should integrate the construct, as well as the lack of consistency in the studies previously performed, we defined the main results indicators recognized by the management to form opinions on the quality of care in physical therapy. In physical therapy, there are some initiatives to assess the quality of care but they are very fragmented and focused on isolated procedures.
such as the discontinuation of mechanical ventilation. The result is interpreted as quality of care in physical therapy, but it is clearly just a partial picture of the quality of care. They do not contemplate aspects related with professional education and experience of the staff with protocols, or even the reach of this quality of care.
That is why we proposed the development of a methodology to allow for a consistent and representative evaluation of physical therapy services. Isolated actions to measure the quality of care do not represent a set of standards against which physical therapy staff can be evaluated. Having a set of indicators to assess the quality of physical therapy care allows for better control and establishment of the level of service to be provided by physical therapists.
oBJectiVe
To design an instrument composed of different domains to demonstrate the activities of the physical therapy service and generate a consistent index to express the quality of care in physical therapy.
metHods
To design the instrument, we used the process review and outline methodology known as Lean Six Sigma. This methodology is structured for problem-solving and continuous improvement of processes through the use of statistical tools aimed to identify opportunities for process enhancements. The most important factors were related with increased customer satisfaction, creating competitive differentiators against the competition, productivity gains, cost savings, increased profitability, focus on eliminating defects from the customer’s perspective, eliminating process variability and decision-making requirements based on facts and data.(9)
This instrument was specifically developed as a variation of the method known as “development of new products and processes” (within the Lean Six Sigma methodology).
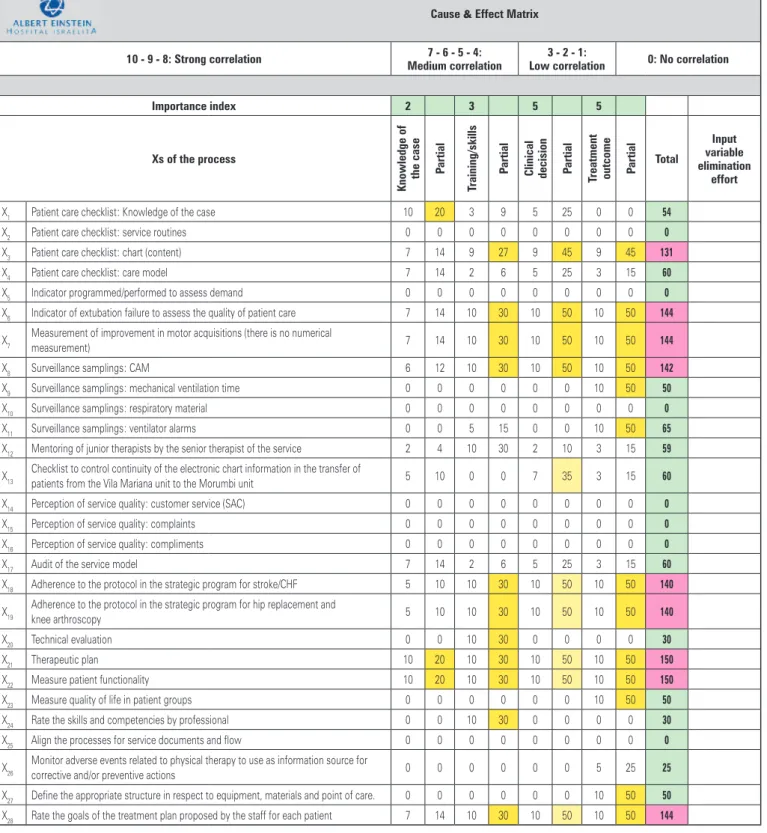
The discussion involved seven different management groups. The mapping of the process relied on the brainstorming tool and the Cause & Effect Matrix. The brainstorming involved a description of the items for evaluation of the quality of care in physical therapy. We discussed the items currently assessed and those that were not yet assessed but were relevant in determining the quality of care in physical therapy. The
brainstorming - the items of the survey - were subject to ranking by weight and importance divided into the following pillars: knowledge of the case (weight 2), training and skills of the professional (weight 3), clinical decision (weight 5) and treatment outcome (weight 5). These four pillars of patient care were graded in the following order of correlation: strong correlation if graded 10 – 9 – 8; medium correlation if graded 4 – 5 – 6 – 7; low correlation if 3 – 2 – 1; no correlation, if zero. After reviewing the scores and weights, we applied the Cause & Effect Matrix.
After this step, we finished developing the instrument composed of some requirements from which we set up a logical table including the items to be evaluated with their corresponding weights according to the volume characteristics and type of physical therapy service. All requirements were composed of indicators previously discussed in the working group, representing the results of quality physical therapy care.
The endpoints were represented by an index calculated against the volume of each management unit and one calculated against the requirements. In the end, the results were compiled in two ways: (1) observing the global behavior of the requirements for all management units; (2) observing the behavior of each management unit separately, for all requirements.
The indicators making up these two indices allowed us to find the service outcomes and create mechanisms to appropriately monitor them, ensuring quality of care in physical therapy. This study was submitted to
the Research Ethics Committee of Hospital Israelita
Albert Einstein and approved under number 270/2011 - CAAE: 0125.0.028.000-11.
ResUlts
The results were demonstrated in two ways: first, globally, allowing the indices derived from the development tools to be viewed, and second, with detailed indicators demonstrating the consistency of the requirements.
The brainstorming found 28 items distributed throughout the four pillars of patient care (knowledge of the case, training/skills, clinical decision and treatment outcome) as described in the Cause & Effect Matrix.
The requirements of the evaluation instrument resulting from this phase were the following: measure whether the treatment prognosis and outcomes were achieved (150 points); measure the care outcome (144
points); evaluate adherence to physical therapy protocols (140 points); grade the minimum infrastructure criterion for physical therapy care (144 points); and individually assess the physical therapist performance (131 points).
cause & effect matrix
10 - 9 - 8: strong correlation 7 - 6 - 5 - 4:
medium correlation
3 - 2 - 1:
low correlation 0: no correlation
importance index 2 3 5 5
Xs of the process
Knowledge of
the case P
artial
training/skills
P
artial
clinical decision Partial treatment outcome P artial total
input variable elimination
effort
X1 Patient care checklist: Knowledge of the case 10 20 3 9 5 25 0 0 54
X2 Patient care checklist: service routines 0 0 0 0 0 0 0 0 0
X3 Patient care checklist: chart (content) 7 14 9 27 9 45 9 45 131
X4 Patient care checklist: care model 7 14 2 6 5 25 3 15 60
X5 Indicator programmed/performed to assess demand 0 0 0 0 0 0 0 0 0
X6 Indicator of extubation failure to assess the quality of patient care 7 14 10 30 10 50 10 50 144
X7 Measurement of improvement in motor acquisitions (there is no numerical
measurement) 7 14 10 30 10 50 10 50 144
X8 Surveillance samplings: CAM 6 12 10 30 10 50 10 50 142
X9 Surveillance samplings: mechanical ventilation time 0 0 0 0 0 0 10 50 50
X10 Surveillance samplings: respiratory material 0 0 0 0 0 0 0 0 0
X11 Surveillance samplings: ventilator alarms 0 0 5 15 0 0 10 50 65
X12 Mentoring of junior therapists by the senior therapist of the service 2 4 10 30 2 10 3 15 59
X13 Checklist to control continuity of the electronic chart information in the transfer of
patients from the Vila Mariana unit to the Morumbi unit 5 10 0 0 7 35 3 15 60 X14 Perception of service quality: customer service (SAC) 0 0 0 0 0 0 0 0 0
X15 Perception of service quality: complaints 0 0 0 0 0 0 0 0 0
X16 Perception of service quality: compliments 0 0 0 0 0 0 0 0 0
X17 Audit of the service model 7 14 2 6 5 25 3 15 60
X18 Adherence to the protocol in the strategic program for stroke/CHF 5 10 10 30 10 50 10 50 140
X19 Adherence to the protocol in the strategic program for hip replacement and
knee arthroscopy 5 10 10 30 10 50 10 50 140 X20 Technical evaluation 0 0 10 30 0 0 0 0 30
X21 Therapeutic plan 10 20 10 30 10 50 10 50 150
X22 Measure patient functionality 10 20 10 30 10 50 10 50 150
X23 Measure quality of life in patient groups 0 0 0 0 0 0 10 50 50
X24 Rate the skills and competencies by professional 0 0 10 30 0 0 0 0 30
X25 Align the processes for service documents and flow 0 0 0 0 0 0 0 0 0
X26 Monitor adverse events related to physical therapy to use as information source for
corrective and/or preventive actions 0 0 0 0 0 0 5 25 25 X27 Define the appropriate structure in respect to equipment, materials and point of care. 0 0 0 0 0 0 10 50 50
X28 Rate the goals of the treatment plan proposed by the staff for each patient 7 14 10 30 10 50 10 50 144
CAM: Confusion Assessment Method (delirium assessment score); SAC: customer service; CHF: congestive heart failure.
From these five requirements, we determined which processes consistently represented the service outcome.
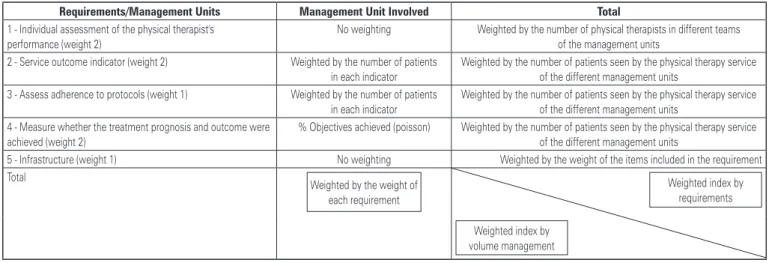
We built a logical table (Figure 2) to define the calculations represented in each indicator and
a process map (Figure 3) involving the different management units.
The following are the detailed requirements respecting the specificity of each service profile.
Requirements/management Units management Unit involved total
1 - Individual assessment of the physical therapist's performance (weight 2)
No weighting Weighted by the number of physical therapists in different teams of the management units
2 - Service outcome indicator (weight 2) Weighted by the number of patients in each indicator
Weighted by the number of patients seen by the physical therapy service of the different management units
3 - Assess adherence to protocols (weight 1) Weighted by the number of patients in each indicator
Weighted by the number of patients seen by the physical therapy service of the different management units
4 - Measure whether the treatment prognosis and outcome were achieved (weight 2)
% Objectives achieved (poisson) Weighted by the number of patients seen by the physical therapy service of the different management units
5 - Infrastructure (weight 1) No weighting Weighted by the weight of the items included in the requirement Total
Weighted by the weight of each requirement
Weighted index by requirements Weighted index by
volume management
Figure 2. Logic to define the weights of the requirements
R e q u i r e m e n t s
Process map
Management unit involved
1- Individual assessment of the physical
therapist’s performance
Standard checklist Performance target 85% Indicator:
number of physical therapists who reached the target number of physical therapists in the team Result of the technical evaluation Performance Target CP
Indicator:
number of physical therapists who reached the target number of physical therapists in the team Adherence to training sessions
2 -Package of service outcome indicators
Indicator 1: Perception of dyspnea by BORG Indicator 2: Evolution of mobility/functionality
Indicator 1: Extubation failure
Indicator 2: SBT (spontaneous breathing trial) time Indicator 3: Evolution of mobility/functionality
Indicator 1: Change in level of physical activity
3 - Assess adherence to the physical therapy
protocols
Adherence
Number of patients enrolled in the protocol
Number of patients who meet the protocol inclusion criteria
4 - Measure whether the treatment prognosis
and outcome were achieved
Measure whether the treatment prognosis and outcome were achieved
% of objectives achieved - Use menu of objectives with metric values and/or service level Example: Walk with _________aid within _______days (use FIM)
5 - Infrastructure
Service level - Relationship between patient demand versus number of physical therapists Equipment and materials for quality therapy performance
Appropriate physical area according to the characteristics of the service
CP: compliant; FIM: Functional Independence Measure.
Requirement 1: individual assessment of the physical
therapist’s performance
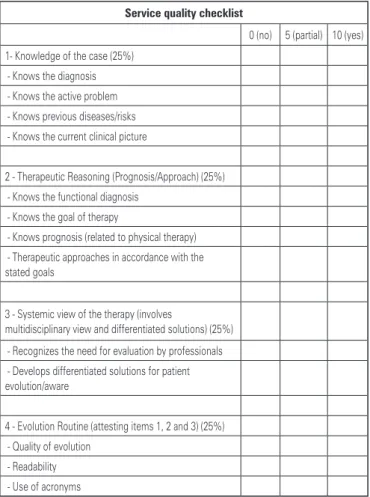
This requirement included the checklist, a technical test and adherence to the training sessions proposed to the physical therapy team (Figure 4).
Indicator: number of physical therapists who reached the target Number of physical therapists in the team
Concept of the technical test
In this factor, the evaluation was formally conducted by means of a theoretical test applied to the staff, with minimum pass score over 6.1 (performance target compliant with expectations (over 6.1):
Indicator: number of physical therapists who reached the target Number of physical therapists in the team
Adherence to training sessions
In this factor, the information was the percentage of professionals attending the training sessions proposed,
i.e. the percentual adherence of the staff to training
sessions.
Indicator: number of professionals who attended training Number of physical therapists with training sessions scheduled
Requirement 2: package of service outcome indicators
For each indicator, an expected range of results was established. Outcome targets were established and included into a package of indicators to be rated as compliant/non-compliant with the targets for these indicators. The results of the indicators were described as percentages. The reference values set as parameters for each indicator were based on evidence from theLiterature(8) or the organization history (values are
described for the respective.
Indicator 1
Indicator 1 focused on the evolution of mobility/ functionality. The physical therapy deliverable was to track the evolution of mobility through measurement instruments based on the characteristics of the treated population. The therapist must apply and interpret the results according to the prognostic loss or gain of mobility of patients. This result demonstrates the correctness of the approach used by the team in maintaining the mobility/functionality of patients.
The reference value was established based on the scores chosen by each of the participating management units. We used the Functional Independence Measure (FIM) score for adults, and the Alberta Infant Motor Scale for children. The FIM consists of items that assess postural changes, independence in performing daily activities (such as getting dressed), and cognitive service quality checklist
0 (no) 5 (partial) 10 (yes) 1- Knowledge of the case (25%)
- Knows the diagnosis - Knows the active problem - Knows previous diseases/risks - Knows the current clinical picture
2 - Therapeutic Reasoning (Prognosis/Approach) (25%) - Knows the functional diagnosis
- Knows the goal of therapy
- Knows prognosis (related to physical therapy) - Therapeutic approaches in accordance with the
stated goals
3 - Systemic view of the therapy (involves
multidisciplinary view and differentiated solutions) (25%) - Recognizes the need for evaluation by professionals - Develops differentiated solutions for patient
evolution/aware
4 - Evolution Routine (attesting items 1, 2 and 3) (25%) - Quality of evolution
- Readability - Use of acronyms
Figure 4. Description of the service quality checklist applied to the requirement
This item of the domain included four factors shared by all management units, which could be customized by management unit within the subject. Each of the items should be graded zero (no), 5 (partial) or 10 (yes).
The items evaluated in the interview were: item 1 - Knowledge of the case (25%); item 2 - therapeutic reasoning (prognosis/approach) (25%); item 3 - systemic view of the therapy (involves multidisciplinary view and differentiated solutions) (25%); and item 4 – evolution routine (attesting items 1, 2 and 3) (25%).
assessment items. The score is determined by the total sum of these items:
Total number of patients who reached the reference value in the score Total number of patients subjected to
obility/functionality evaluation
Indicator 2
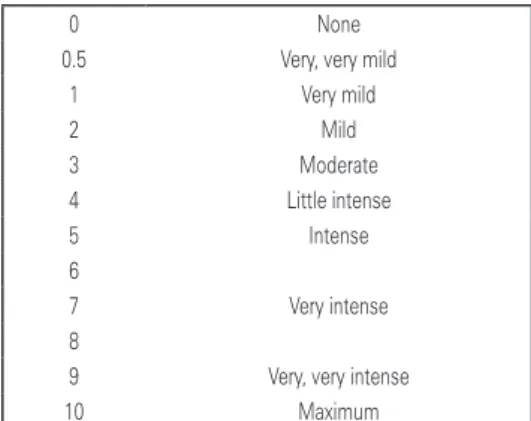
Indicator 2 was the perception of dyspnea based on the Borg scale. The most common symptom in patients on respiratory physical therapy was the presence of dyspnea (Figure 5).
The reference value was as follows: the test had to last for 2 hours to enable validation of the therapeutic decision to extubate the patient − the reference value was 12 to 14% of the total patients extubated according to the plan.
Indicator 4
Extubation failure was indicator number 4. The physical therapy deliverable was patient extubation according to the weaning protocol criteria, demonstrating the correctness of the approach as performed by the team. The indicator must also measure the rate of failure in mechanical ventilation weaning.
Total number of patients intubated within 48 hours after extubation enrolled in the protocol Total number of patients who passed the SBT
and were extubated
Indicator 5
The fifth indicator was the change in physical activity levels. The physical therapy deliverable was to track the level of physical activity performed by patients over the target period. This measure pointed to changes in the behavior related with inclusion of physical activity in patients’ lives, and the reach of the target within this population.
Total number of individuals who changed their physical activity level
Total number of individuals subjected to counseling and tracking of physical activity
The reference value was an increase of at least 1 point in the physical activity evaluation.
Requirement 3: assess the adherence to physical
therapy protocols
Adherence within this domain meant that the quality of the service depended on whether the patient/individual had been enrolled in the protocol established as the best practice.
Total number of patients enrolled in the protocol Total number of patients who meet the
protocol inclusion criteria
Requirement 4: measure whether the prognostic
treatment outcome was achieved
For this domain, we measured whether the prognostic outcome of the treatment was achieved by counting
0 None
0.5 Very, very mild 1 Very mild
2 Mild
3 Moderate 4 Little intense
5 Intense 6
7 Very intense 8
9 Very, very intense 10 Maximum
Figure 5. Description of the Borg score for assessment of dyspnea
The physical therapy deliverable was the use of procedures to improve this symptom. We must be able to measure whether the physical therapy approach decreased dyspnea symptoms for treated patients, demonstrating the correctness of the therapy applied by the team.
The reference value is determined after applying the score at the beginning and end of the therapy. The goal was to decrease the score by 2 points. This value was based on the historical results obtained by the physical therapy service at issue:
Total number of patients who reached the reference value in the score
Total number of patients subjected to dyspnea evaluation
Indicator 3
The spontaneous breathing trial (SBT) time was indicator number 3. The physical therapy deliverable was subjecting the patient to the SBT for 2 hours. This result demonstrated the correctness of the use of this approach by the team:
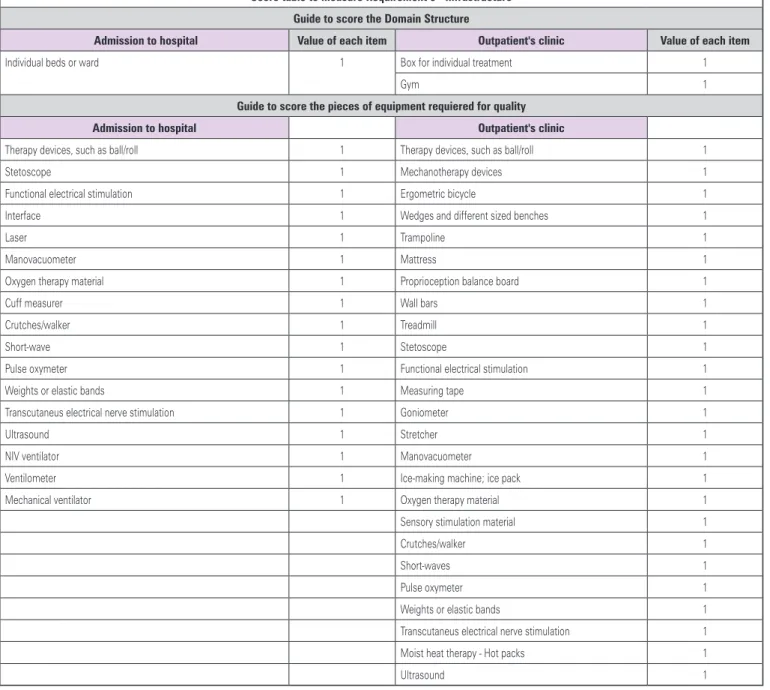
score table to measure Requirement 5 - infrastructure guide to score the domain structure
admission to hospital Value of each item outpatient's clinic Value of each item
Individual beds or ward 1 Box for individual treatment 1
Gym 1
guide to score the pieces of equipment requiered for quality
admission to hospital outpatient's clinic
Therapy devices, such as ball/roll 1 Therapy devices, such as ball/roll 1 Stetoscope 1 Mechanotherapy devices 1 Functional electrical stimulation 1 Ergometric bicycle 1 Interface 1 Wedges and different sized benches 1
Laser 1 Trampoline 1
Manovacuometer 1 Mattress 1
Oxygen therapy material 1 Proprioception balance board 1
Cuff measurer 1 Wall bars 1
Crutches/walker 1 Treadmill 1
Short-wave 1 Stetoscope 1
Pulse oxymeter 1 Functional electrical stimulation 1 Weights or elastic bands 1 Measuring tape 1 Transcutaneus electrical nerve stimulation 1 Goniometer 1
Ultrasound 1 Stretcher 1
NIV ventilator 1 Manovacuometer 1
Ventilometer 1 Ice-making machine; ice pack 1 Mechanical ventilator 1 Oxygen therapy material 1 Sensory stimulation material 1 Crutches/walker 1
Short-waves 1
Pulse oxymeter 1 Weights or elastic bands 1 Transcutaneus electrical nerve stimulation 1
Moist heat therapy - Hot packs 1
Ultrasound 1
the objectives fulfilled as proposed by the team during the physical therapy training. This item was assessed by reviewing the therapy goals page in the patient chart. The sample was calculated for a 15% error rate.
We use a menu of objectives with metric values and/or service level for the print copy, such as: “Walk with _________aid within _______days (use FIM)”:
Total number of objectives proposed for each patient Total number of objectives achieved for each patient
Requirement 5: infrastructure
In this domain, we considered three aspects that contributed for the best practice, namely the service level, as defined by the relationship between patient demand and the number of physical therapists; equipment and materials used for quality therapy performance, and the appropriate physical area according to the characteristics of the service. For this domain, we defined the minimum structure items for good patient care. Each item corresponds to 1 point and is considered over the total items included in each of the three aspects in inpatient and outpatient care (Figure 6).
NIV: non-invasive ventilation.
discUssion
This index translated the results of each management
unit, i.e. it was able to identify the most important
activity for each management unit. This means that, according to the proposed requirements and the structure of the logical matrix used to develop the index, it may be used for any type of physical therapy service due to its reproducibility and customizability. This also means that the service outcome indicators (or any other indicators used to establish the requirements) may be chosen according to the strategic planning of the area or replaced whenever the previous indicators cease to be of interest or become unstable, without the need for further monitoring and control.
Some authors identify two phases in the process of defining quality. The first phase is the correction of errors and the second is the fine-tuning of the appropriate standard. This fine-tuning includes not only the service deliverable or outcome, but also the knowledge inputs that can guide service improvements. The outcomes also depend on the patients’ interaction and reaction and as well as on the behavior of the professional, and therefore are difficult to measure. These same authors point out that feedback in the private sector is easily detectable by its variation.(10)
The Institute of Medicine (IOM) defines quality in healthcare as “the degree to which health services provided to individuals and populations improve the likelihood of desired results, consistent with current professional knowledge.”(11)
We emphasize that the effort to measure outcomes is directly related to patient satisfaction.(12)
Currently, we still face difficulties in finding publications about physical therapy. Despite the ubiquitous integration of physical therapy professionals into hospital staff and the discussions about inpatient care indicators, whether specific or not, physical therapy is not covered in the assessment of indicators.(13)
Therefore, the proposal to build a composite index that makes sense to determine the quality of a physical therapy service is more robust when compared to isolated indicators representing parts of the service process.
conclUsion
The instrument proposed enabled the assessment of several items related with the physical therapy service, allowing for customization, reproducibility and benchmarking among institutions. For management purposes, this five-requirement index demonstrates the quality and training of professionals, the service outcomes, the results of therapeutic planning and the structure of the physical therapy service. It creates an opportunity to identify points for potential improvement, as well as the strengths of the staff and the physical therapy service process.
ReFeRences
1. Nogueira RP. Perspectivas da qualidade em saúde. Rio de Janeiro: Qualitymark; 1994.
2. Bataglin MP. Avaliação em serviços de saúde. Mimeo: Curitiba; 1998. 3. Polizer R, D’ Innocenzo M. Satisfação do cliente na avaliação da assistência de
enfermagem. Rer Bras Enferm. 2006;59(4):548-51. Review.
4. Contandriopoulos AP, Champagne F, Denis JL, Pineault R. A avaliação na área da saúde: conceitos e métodos. In: Hartz ZM, organizador. Avaliação em Saúde: dos modelos conceituais à pratica na análise da implantação de programas. Rio de Janeiro: FioCruz;1997; p. 29-48.
5. Guerrini FM. Introdução à administração. São Carlos: EESCUSP; 2002. 6. Neely A. Measuring business performance: why, what and how. London: The
Economist Books; 1998.
7. Neely A, Gregory M, Platts K. Performance measurement system design: a literature review and research agenda. Int J Operat Prod Manag. 1995;15(4): 80-116.
8. Adams C, Neely A. Handbook of performance measurement. London: Bouine; 2000. Perspectives on performance: the performance prism. p. 19-23. 9. De Feo, Joseph A, Barnard W.Juran Institute’s Six Sigma Breakthrough and
Beyond: Quality Performance Breakthrough Methods New York: McGraw-Hill Professional;2003.
10. Misoczky MC, Vieira MM. Desempenho e qualidade no campo das organizações públicas: uma reflexão sobre significados. RAP. 2001;35(5): 163-77.
11. Institute of Medicine. Committee on Clinical Practice Guidelines; Field MJ, Lohr KN, editors. Guidelines for clinical practice: from development touse. Washington, DC: National Academy Press; 1992.
12. Vanti C, Bonetti F, Ceron D, Piccarreta R, Violante FS, Guccione A, et al. Cross-cultural adaptation and validation of the Physical Therapy Outpatient Satisfaction Survey in an Italian musculoskeletal population. BMC Musculoskelet Disord. 2013;14:125.