Original Article
Artigo Original
Hearing loss classification by degree,
configuration and relationship with amplified
Speech Intelligibility Index (SII)
Classificação de perdas auditivas por grau
e configuração e relações com Índice de
Inteligibilidade de Fala (SII) amplificado
Renata de Souza Lima Figueiredo1Beatriz Mendes1
Maria Carolina Versolatto Cavanaugh1
Beatriz Novaes1
Keywords
Speech Intelligibility Hearing Aids Hearing Loss Child Rehabilitation of Hearing Impaired
Descritores
Inteligibilidade de Fala Auxiliares de Audição Perda Auditiva Criança
Reabilitação de Deicientes Auditivos
Corresponding author:
Renata de Souza Lima Figueiredo Rua Estado de Israel, 1056, Vila Clementino, São Paulo (SP), Brazil, CEP: 04022-002.
E-mail: [email protected]
Received: September 11, 2015
Accepted: April 18, 2016
Study carried out at Centro Audição na Criança da Divisão de Educação e Reabilitação dos Distúrbios da Comunicação, Pontifícia Universidade Católica de São Paulo – PUC-SP - São Paulo (SP), Brazil.
1 Pontifícia Universidade Católica de São Paulo – PUC-SP - São Paulo (SP), Brazil.
Financial support: This study originated from a PhD thesis supported by CAPES-PROSUP.
Conlict of interests: nothing to declare.
ABSTRACT
Purpose: To establish the relationship between speech intelligibility index (SII) values generated at the veriication
of hearing aids programmed according to DSLm [i/o] v5 prescription rule and a proposed individual classiication
that considers the combination of hearing loss degree and coniguration. Methods: Forty-one children aged between 4 and 80 months were selected, totaling 78 ears for analysis. We considered hearing thresholds at the frequencies of 250, 500, 1000, 2000 and 4000 Hz; and analyzed values of the Speech Intelligibility Index
(SII) for the input signal of 65 dB SPL obtained during the veriication of hearing aids using the equipment VeriitAudioscan. Results: Hearing losses were classiied into ive homogeneous groups regarding audiometric
degree and coniguration. The groups were heterogeneous when compared to each other. From the groups, three ranges of SII values were determined. Equations were developed for classiication of hearing loss according
to groups and for determination of the adjusted SII values. Conclusion: The SII value is a useful indicator of audibility for speech sounds in different characteristics of hearing losses, and can guide observations of auditory
skills. The SII has stronger relationship with the association of the audiometric degree and coniguration when
compared with degree of hearing loss alone.
RESUMO
Objetivo: estabelecer relações entre valores do índice de inteligibilidade de fala - SII gerados na veriicação dos aparelhos de ampliicação sonora programados conforme regra prescritiva DSLm[i/o]v5 e uma proposta de
classiicação de indivíduos que considere a associação de grau e coniguração de perdas auditivas. Método: foram selecionadas 41 crianças com idades entre 4 e 80 meses, totalizando 78 orelhas para análise. Foram considerados os limiares auditivos nas frequências 250, 500, 1000, 2000 e 4000 Hz e analisados valores de SII para os sinais
de entrada 65 dB NPS, obtidos na veriicação dos AASI no equipamento VeriitAudioscan. Resultados: as
perdas auditivas foram classiicadas em cinco grupos homogêneos quanto às características audiológicas (grau e coniguração audiométrica) e heterogêneos entre si. A partir dos grupos, determinaram-se três intervalos de valores de SII. Foram determinadas equações para classiicação da perda auditiva conforme grupos e equações
para determinação de valores de SII ajustado. Conclusão: o valor de SII pode ser considerado um indicador da audibilidade para sons de fala para diferentes características de perdas auditivas e nortear avalições de
INTRODUCTION
The main objective of the hearing aid selection process in infants and children with hearing loss is to provide audibility to speech sounds and, thus, foster the development of oral language(1).
The hearing aid (HA) selection process in infants and young children is composed of integrated and sequential steps(2,3), namely: deinition of hearing thresholds, selection of
electroacoustic characteristics of ampliication, veriication of ampliication and, inally, validation. These steps, well known
by professionals, are systematically described in available protocols of good practice in pediatric audiology(4-6).
It is in the third step of the HA selection process that
the adequacy of ampliication is veriied according to the
prescriptive method selected. Studies show that there are large differences among the software provided by manufacturers of HA. Consequently, for the same hearing loss, different values
of gain and output are calculated, which conirms the need for
the veriication step(7,8).
It is important to evaluate the audibility of speech signal in HA selection process to ensure that infants and children with hearing loss have access to speech sounds with quality and without discomfort, using objective and subjective measurements(9). However, infants and young children are not yet able for traditional speech recognition tests and other validation methods used with adults and older children. Audiologists must, then, rely on objective measurements and procedures,
obtained in the HA veriication step, to estimate audibility to speech sounds. The veriication step can further contribute to
adjust expectations towards auditory development, considering other complex variables, and psychological development.
One such measure is the Speech Intelligibility Index (SII), which determines the proportion of audible and useful speech information available to the listener, with high correlation with speech intelligibility(10). Emerged from the review made in 1997 of ANSI S3.5-1969, the SII replaced the best known Articulation Index (AI) which, by the end of the 80s, was not widely used clinically due to the complexity of calculation. The advancement of technology has enabled the clinical use
of the SII to the extent that the HA veriication equipment
(VeriitAudioscan, Interacoustics Afinity) displays the
automatic calculation during the veriication procedure(6).
Alternately, the SII can be determined with the use of software developed by researchers at the Acoustical Society of America (ASA).
SII is calculated from the speech signal spectrum, the noise spectrum and the hearing threshold of the subject. Speech
signals and noise are iltered into frequency bands. Within
each frequency band, the audibility factor is derived from the signal to noise ratio, indicating the degree to which the speech signal is audible. A SII value of zero means that no speech sound is audible while a score of 100% means that all the speech information is available(10).
The use of SII is more common in audiology clinical practice as an aid tool in verifying output target for speech stimuli at
different intensities and as a strategy for family guidance as a predictor measure of audibility to speech sounds in different types of sound environment(6,11).
When describing the DSLm [i/o] v5 prescription and the
presentation of the irst results of the application of the method,
study(12) exposed some results on the analysis of the values of
ampliied SII compared to the average of hearing thresholds
from 2000 to 6000 Hz using the VeriitAudioscan equipment.
The conclusion was that the SII values are directly related to the mean thresholds analyzed: as the average of the thresholds increases, the SII decreases and vice versa. In general, the SII values are better than 60% for hearing loss up to 75 dB HL. For hearing losses higher than 80 dB HL, SII values may vary
from 20 to 60%, depending on the coniguration of the loss,
the test signal level and the target output difference.
Other studies have aimed to relate the values of SII directly with the development of language and with the scores of speech recognition in children. Bass-Ringdahl(13) reported that infants with less than 35% of SII do not develop canonical babble. Researchers(12,14) reported the need to be careful in relating the SII directly with scores of speech recognition in children. In general, children need more audibility to achieve the same speech recognition scores than adults because they are in the process of language development and have less dominance of oral language. Therefore, the relationship between SII and speech recognition is not straightforward. The SII is an objective measure related solely to hearing, while tests of speech recognition involve other variables related to the characteristics of speech materials and the stage of development of each child, along with their individual characteristics.
Studies(15-17) aiming to investigate the relationship between the values of SII and speech recognition scores for different test materials with certain characteristics frequency, concluded that the frequency importance function (FIF) - required by ANSI(10) for six types of speech materials - must also be established for other types of test materials so that the speech recognition scores can be related to the values of SII. These results suggest that, in addition to the degree of hearing loss,
audiometric coniguration is essential to trace prognosis of
audibility and intelligibility of speech.
Therefore, for comparative analyzes between ampliied
SII values and hearing loss, it seems that to only consider the degree obtained from the average of some frequencies does
not accurately relect the relationship between ampliied SII
and auditory characteristics. In this perspective, considering:
- that the SII estimate speech intelligibility, although it has limitations inherent the complexity of the phenomenon under measurement;
- that in public policies in Brazil, the professionals involved
in the therapeutic process very often do not have speciic
knowledge about audiological measures, and that process of selection and adjustment of HA, are performed in specialized centers, this study aims at contributing to the stage when the audiological information set and characteristics of development of every child can guide the expectations of clinicians and families regarding the development of oral language.
This study aims to conduct a comparative analysis between SII values for the input of 65 dB SPL generated during the
veriication of HA devices programmed according to the
DSLm[i/o] v5 prescription and a proposed classiication that
considers the association of the variables degree and coniguration
of hearing loss, in order to use as an indicator that may guide the observation of auditory skills likely considering complex
factors involved in the child population, during the irst stages
of the validation process.
METHODS
This study was conducted at the Center of Child Hearing (Centro Audição na Criança - CeAC)†. It is a high complexity
service accredited by the Uniied Health System (Sistema
Único de Saúde - SUS) that provides care to children with
suspected or conirmed hearing loss who are below three
years of age. This study followed the precepts established by the code of ethics for human research and was approved by the ethics committee of PUC-SP, according to the research protocol number 337/2010.
The study included 41 patients, aged between four and 80 months, diagnosed with sensorineural hearing loss of any
degree and coniguration who participated in the selection of
hearing aids during the year 2011, totaling 78 ears for analysis. Of this total, two ears of subjects with cochlear implant and two ears of two subjects with anacusis were excluded. Nonlinear hearing aids were indicated for all children.
Procedures
Determining hearing thresholds
Hearing thresholds used in programming (PT) of the devices were determined from the audiological evaluation according to the protocol established by the professionals of the institution. The thresholds used in the analysis were: 250, 500, 1000, 2000 and 4000 Hz. When the responses to
† Centre associated to the Divisão de Educação e Reabilitação dos Distúrbios da Comunicação (Division of Education and Rehabilitaion of Communication Disorders) of Pontifícia Universidade Católica de São Paulo – DERDIC/ PUC-SP, to the Programa de Estudos Pós-Graduados em Fonoaudiologia/ Linha de Pesquisa Audição na Criança (Graduate Study Program in Speech-Language and Hearing Sciences/Research Line Child Hearing) of Faculdade de Ciências Humanas e da Saúde PUC-SP.
frequencies were absent until the limit of the equipment, the values considered were recorded on the Noah software for programming the hearing aid. The program generally uses the maximum values of the AC-33 audiometer from Interacoustics: for the frequency 250 Hz, the maximum of the equipment is 105 dB; to 500 Hz, 110 dB; for 1000, 2000 and 4000 Hz, 120 dB. For ears in which the frequency 250 Hz was not recorded, the 250 Hz threshold was considered equal to that of 500Hz.
Obtaining SII values
The hearing aids were selected and programmed based on the thresholds established during the diagnostic process through the DSLm [i/o] v5 prescription. RECD measures were carried out with the ear molds. When this was not possible,
the values predicted by the VeriitAudioscan equipment
were used.
With hearing thresholds and RECD (measured or predicted), the HA were programmed via the software of their respective companies. Technologies such as nonlinear frequency compression or frequency transposition were disabled when available for the model of HA.
The verification of measures for speech sounds of 55, 65 and 75 dB SPL and for maximum output (90 dB SPL)
were carried out on the VeriitAudioscan. The speech stimuli
used was the Standard-speech (Speech-std 1) - Carrot passage. The difference of 3 dB positive or negative was used to determine similar values between the electroacoustic characteristics of gain and output prescribed by the DSLm [i/o] v5 software and values found in the HA. Exceeding these values can result
in super- or sub-ampliication(12). The relationship of the
difference between the response generated by the ampliication
devices and targets prescribed under rule DSLm[i/o] v5 was analyzed and described in the study “Reference Values
for the SII ampliied according to rule DSLm[i/o] v5”(18).
The results showed the impact of the degree of hearing loss in
the difference between the ampliied response curve and the
prescribed targets: severe and profound hearing losses, due to the reduced dynamic range feature differences considered
inappropriate ampliication. However, this difference does not relect inadequacy, since the limitation is imposed by the degree of hearing loss (dynamic ield of hearing). When we assess the adequacy of the ampliication, loudness is related to ampliied hearing thresholds and how close hearing aid
response curve is to prescribed targets.
For the current study, only the values of SII to speech stimuli at 65 dB SPL were used. Therefore, from this point, only the acronym SII 65 will be used in reference to the values of SII 65dBSPL studied here. The SII 65 values for
each tested ear were obtained in the HA veriication process,
totaling 78 SII 65 values.
Determination of algorithm with sensitivity to clusters according to auditory threshold and coniguration of
hearing loss
The technique of cluster analysis (19) was applied with the aim of composing internally homogeneous groups of individuals regarding the hearing thresholds at 250, 500, 1000, 2000 and 4000 Hz and heterogeneous among each other. The k-means method was adopted. The technique was applied considering from two to seven groups. In each group, the within groups sum of squares, which is a measure of internal heterogeneity, was calculated: the larger the sum of squares, the less homogenous are the groups; the larger the number of groups, the smaller is the sum of squares. Based on this sum, the optimum number of groups was obtained. These groups were then characterized according to hearing threshold at different frequencies, degree of hearing loss and SII 65 values.
The technique of discriminant analysis was applied with the purpose of obtaining a rule for classifying a new individual into one of the groups. The cross validation method was used to calculate the percentages of sample individuals correctly
classiied(19).
Relation between SII 65, mean hearing thresholds and
hearing thresholds at the frequencies studied
The Pearson correlation coeficient(20) was considered as
a measure of correlation between variables: SII values, mean hearing thresholds and hearing thresholds at the frequencies studied.
The procedure of forward selection of variables(21) was
adopted for the it of the regression model with the aim of
describing the relationship between SII and thresholds at 250, 500, 1000, 2000 and 4000 Hz.
Determining SII 65 interval values for prognosis of
speech sounds audibility
The irst range of SII 65 (IntSII) values that distinguished
the groups was established from the cluster analysis and the analysis of relationships between SII 65 and hearing thresholds. To establish the other intervals (IntSII), the value that maximizes
both the percentages of correct classiication among groups
was established based on values and the relationship between
sensitivity and speciicity(22). This allowed to study the variation
of sensitivity and speciicity and to establish a cutoff value.
Thereafter, the terms “sensitivity” and “speciicity” were replaced by the expression “likely to classify a given ear in a given group” conirming that ear really belonged to that group.
RESULTS
Composition of groups, analysis of the degree of hearing
loss according to group and discriminant analysis
Concerning group composition, the value of the sum of squares
decreases as the number of groups increases. After ive groups,
the value of the sum of squares tends to stabilize, indicating that
the optimal number of groups is ive, because from that number
little is gained in relation to the internal homogeneity of the
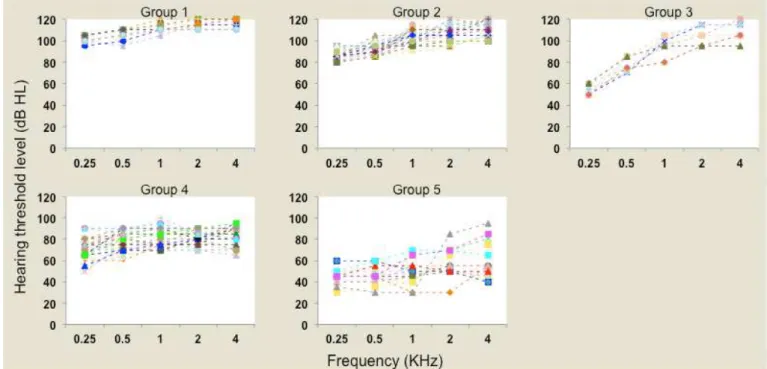
groups. Individual proiles of hearing thresholds in each group
at the analyzed frequencies (250, 500, 1000, 2000 and 4000 Hz) are shown in Figure 1.
The average of the frequencies 500, 1000, 2000 and 4000 Hz was used to classify the degree of hearing loss according to WHO(23).
Classiication rules using the technique of discriminant analysis were obtained in order to allow the classiication of
a new individual into one of the groups established by cluster analysis.
This technique provides, for each group, a function of the thresholds in these frequencies that is called discriminant function. When knowing the thresholds of an individual at these frequencies, it is possible to calculate, in each group, the corresponding values of discriminant functions, called
discriminant scores. The individual is classiied in the group
in which he/she obtains the highest score. The discriminant functions obtained were:
Group 1: -242.9 + 1.1 x PT 0.25 + 1.9 x PT 0.5 – 0.5 x PT 1 + 0.8 x PT 2 + 1.2 x PT 4;
Group 2: -195.3 + 0.9 x PT 0.25 + 1.6 x PT 0.5 – 0.4 x PT 1 + 0.7 x PT 2 + 1.1 x PT 4;
Group 3: -148.4 + 0.2 x PT 0.25 + 1.6 x PT 0.5 – 0.2 x PT 1 + 0.8 x PT 2 + 0.9 x PT 4.
Group 4: -124.7 + 0.7 x PT 0.25 + 1.4 x PT 0.5 – 0.3 x PT 1 + 0.5 x PT 2 + 0.9 x PT 4;
Group 5: -54.4 + 0.5 x PT 0.25 + 0.9 x PT 0.5 – 0.3 x PT 1 + 0.4 x PT 2 + 0.6 x PT 4.
where PT 0.25, PT 0.50, PT 1, PT 2 and PT 4 are hearing thresholds at 250, 500, 1000, 2000 and 4000 Hz, respectively.
Each ear of the sample was classiied by means of the above functions, resulting in a classiication matrix. The overall percentage of correct classiication was 92%. This high
percentage is one more indicative that the number of groups considered in this study is appropriate.
Relations between SII 65, hearing thresholds at
frequencies studied and mean auditory thresholds at different frequencies according to groups generated in
the cluster analysis
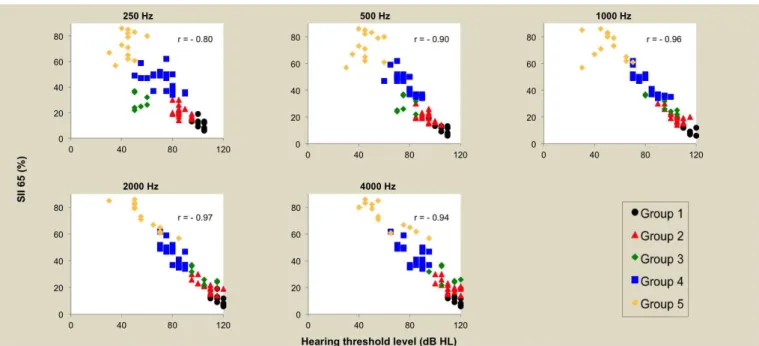
Values of the Pearson correlation coeficient were calculated
at each frequency to study the relationship between the values of SII 65 and hearing thresholds. The threshold for 2000 Hz has the strongest correlation with SII 65. There is also a strong correlation between thresholds at the different frequencies studied (Figure 2).
Figure 2 displays the relationship between SII 65 and the threshold at different frequencies.
A regression model was adjusted with SII 65 as the dependent variable and the thresholds at different frequencies as explanatory variables(21). The forward method of selection
of variables was used to it the model. In each step of this
method, an explanatory variable was added to the model. In the
irst step, the variable most highly correlated with SII 65 was
added (threshold at 2000 Hz). The second variable to enter the model was the one that had the largest additional contribution
to the irst to explain the response variable. The procedure
continued until no additional explanatory variable had a
signiicant contribution to the model to explain the response
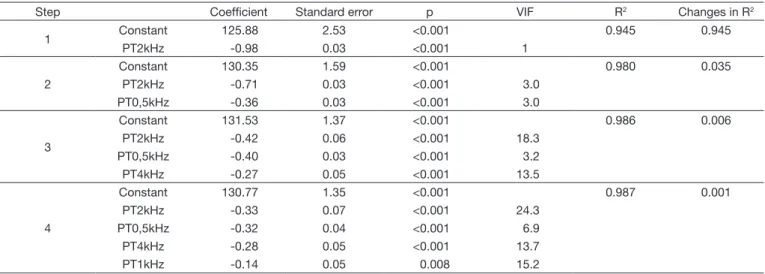
variable. A summary of the results obtained in each step is presented in Table 1.
The threshold at 2000 Hz was selected in the irst step. In the
second step, the threshold at 500 Hz was added to the model. In the third, the threshold at 4000 was added and in the fourth step the threshold at 1000 Hz. All of these thresholds have
signiicant contribution to explain the SII 65. The threshold at 250 Hz had no signiicant additional contribution to explain
the SII 65 (p = 0.966).
From the third step, variance inlation factor (VIF)(21) values greater than 10 occurred, indicating that the strong correlation
between the explanatory variables may be inluencing the
results. The increase in R2 from the third step was small. Thus the model adjusted at the second step was considered
as the inal model:
SII 65 adjusted = 130.35 -0.71 x Threshold 2 kHz - 0.36 x Threshold 0.5 kHz
This equation can be used to predict the value of the SII 65 from the thresholds at 500 and 2000 Hz.
Considering the individual values of SII 65, the values of
the Pearson correlation coeficient between the two variables
were analyzed: for the average of 500, 1000 and 2000 Hz, a
coeficient of -0.98 (p <0.001) was found; for the average of 500, 1000, 2000 and 4000 Hz, the value of -0.99 (p <0.001); and the value of -0.98 (p <0.001) for the average of the frequencies
including the frequency of 250 Hz. These values indicate the existence of almost perfect linear relationship between SII 65 and the three mean hearing thresholds. The negative correlation indicates that the higher the average of hearing thresholds, the lower the SII 65 value.
A scatter diagram was constructed to observe the behavior of SII 65 regarding the average thresholds of 500, 1000, 2000 and 4000 Hz (Figure 3). This average was selected because it had greater linearity and because the frequency 250 Hz was excluded from
the analysis for not bringing signiicant additional contribution
to explain the SII 65, as can be seen in Figure 3.
The lowest average of thresholds and the highest values of SII 65 were observed in Gr5. Although Gr3 did not differ from Gr4 regarding the mean threshold, Gr3 tended to show lower values of SII 65. Gr1 and Gr2 presented higher mean thresholds and lower values of SII 65. Gr5 and Gr4 were the most heterogeneous groups regarding SII 65 values.
With the aim of characterizing groups and degrees of hearing loss regarding the values of SII, the descriptive statistics of SII
65 per group and per degree of hearing loss were calculated (Table 2).
From the formation of the ive groups by the cluster analysis,
a comparative analysis between the SII 65 values obtained
during the veriication of HA and hearing loss characteristics (degree and coniguration) was performed.
The scatter plot (Figure 3) and the descriptive statistics of SII 65 values per group (Table 2) show that Gr4 and Gr5 differ from Gr1, Gr2 and Gr3 for presenting higher values of
standard deviation. The higher the classiication of the group (one to ive) the higher the standard deviation values of SII
65. The groups are homogeneous regarding audiological
features, but heterogeneous with respect to the ampliied SII,
especially Gr4 and Gr5.
However, when SII 65 values are analyzed according to the degree of hearing loss, Table 2 reveals that the standard deviation values of SII 65 do not increase according to the degree of hearing loss. This seems to be related to the importance of
the association of both variables, degree and coniguration of
Table 1. Summary of results obtained from regression model with adjustment SII 65 as dependent variable and the thresholds at different frequencies as explanatory variables
Step Coefficient Standard error p VIF R2 Changes in R2
1 Constant 125.88 2.53 <0.001 0.945 0.945
PT2kHz -0.98 0.03 <0.001 1
2
Constant 130.35 1.59 <0.001 0.980 0.035
PT2kHz -0.71 0.03 <0.001 3.0
PT0,5kHz -0.36 0.03 <0.001 3.0
3
Constant 131.53 1.37 <0.001 0.986 0.006
PT2kHz -0.42 0.06 <0.001 18.3
PT0,5kHz -0.40 0.03 <0.001 3.2
PT4kHz -0.27 0.05 <0.001 13.5
4
Constant 130.77 1.35 <0.001 0.987 0.001
PT2kHz -0.33 0.07 <0.001 24.3
PT0,5kHz -0.32 0.04 <0.001 6.9
PT4kHz -0.28 0.05 <0.001 13.7
PT1kHz -0.14 0.05 0.008 15.2
hearing loss, for speech intelligibility, and not just the degree of hearing loss alone. Hence the reason for an alternatively
classiication in the factors considered as parameters in the
validation process.
Determining SII 65 ranges to guide expectations of performance on the auditory skills observation related to audibility of speech sounds
Given the heterogeneity found in the SII 65 values - even
though the ears were classiied according to similar audiological
features - this study aimed to establish ranges of SII 65 values
to guide the clinician regarding the suitability of ampliication
and prognosis for audibility of speech sounds.
It can be observed from the analysis that the SII 65 value of 35% separates the Gr1, Gr2 and Gr3 from the other groups and that a value close to 60% seems to be appropriate to separate the Gr4 and Gr5 (Figure 3).
Sensitivity and speciicity were calculated to formally
determine the value that maximizes both the percentages of
correct classiication in Gr4 and Gr5 and determine a cutoff
value of SII 65 between these two groups. From these values, it was possible to establish the cutoff value of 55%, associated
to the value corresponding to higher values of speciicity and
sensitivity.
The value corresponding to higher probability of correct
classiication in both groups point is represented by a square.
This point corresponds to the SII 65 cutoff value at 55%. The area under the curve is 0.99. The higher than 0.5 this value is, the better the SII 65 separates the two groups, which
conirms the good discriminatory power of the SII 65. Estimates of the probabilities of correct classiication in the two groups
corresponding to the cutoff values are: 0.92 for the Gr4 and 1.00 for Gr5. Thus, the SII 65 values can be divided into three intervals (IntSII): IntSII≤35 - 0 to 35%; IntSII36-55 - 36-55%; and
IntSII≥56 - 56-100%.
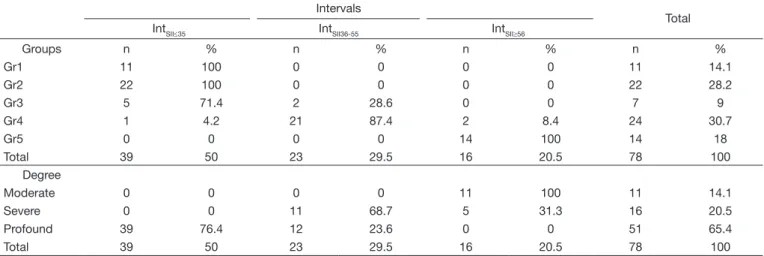
Table 3 was constructed from the three intervals determined. It shows the frequencies and percentages of SII 65 categorized in each group.
Note that of the 24 ears of Gr4 (composed of 13 ears with severe and 11 ears with profound hearing loss), only three
were classiied outside IntSII36-55, which makes the group
heterogeneous regarding the values of SII 65.
Table 3 also shows the relationship between the classiication of the degree of hearing loss according to WHO and the intervals of SII 65 determined by the analysis.
Table 2. Descriptive statistics for SII 65 values per group established by the technique of cluster analysis and per degree of hearing loss (WHO)(23) (n=78)
n Average Standard Deviation Minimum Median Maximum
Groups
Gr1 11 11.82 3.64 6 12 19
Gr2 22 20.45 4.27 14 19.5 30
Gr3 7 28.86 6.07 22 26 37
Gr4 24 44.58 7.99 34 47 62
Gr5 14 73.64 9.79 57 76 86
Degree
Moderate 11 76.64 8.82 57 80 86
Severe 16 53.18 6.27 47 50 65
Profound 51 23.2 9.83 6 22 41
Table 3. Frequencies and percentages of SII 65 intervals (IntSII) distributions, categorized by group and by degree of hearing loss (n=78) Intervals
Total
IntSII≤35 IntSII36-55 IntSII≥56
Groups n % n % n % n %
Gr1 11 100 0 0 0 0 11 14.1
Gr2 22 100 0 0 0 0 22 28.2
Gr3 5 71.4 2 28.6 0 0 7 9
Gr4 1 4.2 21 87.4 2 8.4 24 30.7
Gr5 0 0 0 0 14 100 14 18
Total 39 50 23 29.5 16 20.5 78 100
Degree
Moderate 0 0 0 0 11 100 11 14.1
Severe 0 0 11 68.7 5 31.3 16 20.5
Profound 39 76.4 12 23.6 0 0 51 65.4
DISCUSSION
Children undergoing language development have different acoustical needs compared to adults and older children. All acoustic information of speech is of utmost importance for the development of auditory and linguistic skills. The Speech Intelligibility Index (SII) is a measure used at the Audiology
clinic for relecting the likely potential of hearing use and
for assisting the clinician in the guidance on the impact of hearing loss on language development, whereas there are factors unique to each child.
The purpose of this study was to analyze comparatively the
SII 65 values obtained during the veriication of hearing aids
according to the DSLm[i/o] v5 prescription and to propose a
classiication of individuals that considers the association of the variables degree and coniguration of hearing loss.
Cluster analysis, with the composition of ive homogeneous
groups regarding characteristics of hearing loss, allowed studying and verifying the behavior of SII 65 values for different
combinations of thresholds and coniguration of hearing loss.
As in other studies(12-14,24) SII 65 values strongly correlated with the mean auditory thresholds. The correlation is always negative, indicating that as the average of thresholds increases, i.e. the degree of hearing loss increases, the SII 65 value decreases, indicating less audibility and intelligibility. Despite the differences between the studies cited above regarding which frequencies were used to calculate averages for correlation with SII 65, there is always a strong correlation.
All frequencies are important for speech intelligibility. The frequency 2000 Hz, when correlated separately with the values of SII 65, has the highest value of r, indicating that this is often the largest contributor to the behavior of the SII 65 variation. Invariably, the studies cited include frequency 2000 Hz in the mean calculation. Furthermore, according to the ANSI S3.5-1997(10) parameters, when using the method of third octave frequency, the frequency band number 12, which is equivalent to the frequency 2000 Hz, has the highest ratio of importance (0.0898) relative to the other 17 bands included in the calculation.
The SII 65 value decreases to ears of the same group with
the same degree and descending audiometric coniguration.
The ear with the lowest value of SII 65 in Gr5 (57%) has
a sloping ramp audiometric coniguration with a difference of
55 dB between the thresholds at 1000 Hz (30 dB) and 2000 Hz (85 dB). The SII 65 values higher than 57% are from ears with auditory thresholds up to 75 dB at the frequency of 2000 Hz. However, the ears with a threshold higher than 80 dB HL at the frequency of 2000 Hz have SII 65 values up to 50%.
The literature(13) points out that SII values below 35% do not favor the development of canonical babbling, that is, an
intelligibility of up to 35% is not suficient for the development
of speech production of consonants. The study mentions the need for an essential and minimum level of intelligibility for the development of babbling.
In the present study, 39 ears (50%) had SII 65 values below 35%, and the group of ears studied had predominantly
mean hearing thresholds that were higher than 80 dB HL,
coniguring a group of 65.4% (51 ears) with profound hearing
loss according to the WHO(23) classiication.
According to the cluster analysis, the 39 ears were divided among Gr1, Gr2 and Gr3, characterized by profound hearing
loss with differences in audiometric coniguration. Children
with these hearing characteristics are those whose families, early in the hearing aid selection process, should be guided
regarding the limitations of ampliication, environment and
the distance between the sound source and the microphone of hearing aids, educational approaches and other technologies available (cochlear implants). SII can and should be used as a guidance tool for families of children with hearing impairment(3,9,12). The understanding of the family in relation to hearing impairment and the importance of treatment is the
decisive factor for the consistent use of ampliication - a key
variable for child development(25,26).
Children with auditory characteristics similar to those of Gr4 and Gr5 have great variability in the SII 65 values according to the DSLm [i/o] v5, despite the homogeneity of audiological features. The adequacy of the target output
ampliication is determinant of the intelligibility factor and a
precondition for the development of auditory and language skills when dealing with children without other disabilities.
Therefore, knowing measures that assess the adequacy of
pediatric ampliication in the Audiology clinic is of fundamental
importance to the therapeutic process aiming at the development of oral language.
This study allowed determining two equations for evaluating
the appropriateness of ampliication through audiometric
characterization and analysis of variation of SII 65 in terms frequencies.
The irst equation, result of the discriminant analysis, allows
the Audiologist to determine in which group of audiological
features of the patient its and to analyze what range of SII
65 (IntSII) is expected from ampliication for the patient. The prediction of the SII 65 soon after the diagnosis without
irst having initiated the selection process itself can be of great
value to start the guidelines and facilitate the understanding of the family in relation to the hearing of the child.
The second equation, resulting from the analysis of which frequencies have a stronger contribution to the SII 65, allows the calculation of the adjusted SII 65 value that is expected
from ampliication in each case. This calculation considers
the two frequencies that together predict an appropriate SII 65 value: the frequencies of 500 and 2000 Hz.
This equation, which adjusts the SII 65 value, considers the same minimum frequencies of diagnostic pediatric audiology protocols(4), because as they together predict audiological
coniguration they allow the beginning of the intervention process with the selection and itting of hearing aids on
babies under six months of age, until they are able for visual reinforcement audiometry.
individuals, considering interferences as noise and speech material. Such calculations can be performed with the aid of a software and require data that go beyond the auditory threshold of the patient, which makes it impractical to use it in pediatric clinical practice.
The current study aimed to analyze the relationship between
the SII 65 values generated during the HA veriication in patients with different degrees and conigurations of hearing
loss, and generated simple equations that can be used in the
Audiology clinic to assess the adequacy of ampliication,
guide expectations of intelligibility in situations of silence,
instruct families about hearing and ampliication and guide
clinical decisions regarding treatment and audiological approach to each case. When there is no compatibility between expected audibility capacity and performance in validation
procedures, speech pathologists could refer to veriication and/ or adjustments of hearing aids, conirmation of thresholds or
consider other disabilities. Such equations do not replace the
veriication procedure of ampliication devices. It is during the HA veriication that the audiologist will obtain the real
value of SII 65 and evaluate the desired targets according to the DSLm [i/o] v5 method- and not according to the software provided by manufacturers of hearing aids, as evidenced by studies(7,8,27,28).
CONCLUSIONS
• Cluster analysis of the ears allowed a classiication of hearing
loss that aimed to consider variables associated to degree
and coniguration. It resulted in ive heterogeneous groups
among each other and with within-group homogeneous auditory characteristics regarding auditory thresholds.
This proposed classiication by groups seems to have
more sensitivity to discriminate individuals concerning audiological characteristics as compared with the traditional
WHO classiication. The analysis of the relations between the values of SII 65 and the classiication of hearing loss according to group, and the classiication according to
degree of hearing loss (WHO), showed that the proposed
classiication by groups seems to have more sensitivity for
predicting the speech intelligibility index (SII).
• Equations were generated from statistical models used for cluster analysis of the ears studied. The equations allow
the classiication of a new ear (individual) in the groups proposed for classiication of hearing loss. The use of the
equations assumes that the acoustic characteristics of the hearing aids hit the target in the prescriptive rule, a result
of the veriication process, essential in each case.
• The combination of frequencies 2000 Hz and 500 Hz contribute to predict the SII 65 values for each ear (individual). An equation was generated for obtaining the SII 65 value, adjusted from the hearing thresholds in the 500 and 2000 Hz frequency.
• Three intervals of SII 65 were obtained to assist the clinician
in assessing the suitability of ampliication in the pediatric population. The irst consists of SII 65 values below 35%
(IntSII≤35) and addresses hearing loss of Gr1, Gr2 and Gr3;
the second range is formed by SII 65 values between 36 and 55% (IntSII36-55) comprising Gr4; the third interval is composed by SII 65 values higher than 55% (IntSII≥56) composed by ears of Gr5.
• The appreciation of SII 65 value obtained in the veriication process, and their use in classiication proposed here, can
be a guide to expectations of parents and speech therapists involved in rehabilitation. If the auditory behavior are not consistent with the expected audibility of speech during the validation process other variables must be considered. Others disabilities should be considered or, eventually, thresholds might have changed or there could have been lack
of veriication during programming of hearing aids leading
to performance not equivalent to estimated intelligibility.
REFERENCES
1. Seewald R, Moodie S, Scollie S, Bagatto M. The DSL method for pediatric hearing instrument fitting: historical perspective and current issues. Trends Amplif. 2005;9(4):145-57. PMid:16424944. http://dx.doi. org/10.1177/108471380500900402.
2. Seewald RC, Moodie KS, Sinclair ST, Scollie SD. Predictive validity of a procedure for pediatric hearing instrument fitting. Am J Audiol. 1999;8(2):143-52. PMid:10646198. http://dx.doi.org/10.1044/1059-0889(1999/017).
3. Bagatto M, Scollie S. Protocol for the provision of amplification [Internet]. London, Ontario: Mount Sinai Hospital; 2014 [citado em 2015 Jun 3]. p. 100. Disponível em:: http://www.mountsinai.on.ca/care/infant-hearing-program/documents/ihp_amplification-protocol_nov_2014_final-aoda. pdf
4. AAA: American Academy of Audiology. Audiologic guidelines for the assessment of hearing in infants and young children. Reston: AAA; 2012. 5. Bagatto M, Moodie S, Scollie S, Seewald R, Moodie S, Pumford J, et al.
Clinical protocols for hearing instrument fitting in the Desired Sensation Level method. Trends Amplif. 2005;9(4):199-226. PMid:16424946. http:// dx.doi.org/10.1177/108471380500900404.
6. Bagatto M, Scollie SD, Hyde M, Seewald R. Protocol for the provision of amplification within the Ontario infant hearing program. Int J Audiol. 2010;49(Supl 1):S70-9. PMid:20109090. http://dx.doi. org/10.3109/14992020903080751.
7. Seewald R, Mills J, Bagatto M, Scollie S, Moodie S. A comparison of manufacturer-specific prescriptive procedures for infants. Hear J. 2008;61(11):26-34. PMid:20098630. http://dx.doi.org/10.1097/01. HJ.0000342436.70730.a8.
9. Bagatto MP, Moodie ST, Malandrino AC, Richert FM, Clench DA, Scollie SD. Clench D a, Scollie SD. The University of Western Ontario Pediatric Audiological Monitoring Protocol (UWO PedAMP). Trends Amplif. 2011;15(1):57-76. PMid:22194316. http://dx.doi. org/10.1177/1084713811420304.
10. ANSI: American National Standards Institute. Methods for calculation of speech intelligibility index. Washington: ANSI; 2012.
11. Davidson LS, Skinner MW. Audibility and speech perception of children using wide dynamic range compression hearing AIDS. Am J Audiol. 2006;15(2):141-53. PMid:17182879. http://dx.doi.org/10.1044/1059-0889(2006/018).
12. Scollie S. DSL version v5. 0: description and early results in children [Internet]. Houston: AudiologyOnline; 2007 [citado em 2012 Set 22]. Disponível em: http://www.audiologyonline.com/articles/pf_article_detail. asp?article_id=1753
13. Bass-Ringdahl SM. The relationship of audibility and the development of canonical babbling in young children with hearing impairment. J Deaf Stud Deaf Educ. 2010;15(3):287-310. PMid:20457674. http://dx.doi. org/10.1093/deafed/enq013.
14. McCreery RW, Bentler RA, Roush PA. Characteristics of hearing aid fittings in infants and young children. Ear Hear. 2013;34(6):701-10. PMid:23575463. http://dx.doi.org/10.1097/AUD.0b013e31828f1033. 15. Sherbecoe RL, Studebaker GA. Audibility-index functions for the
connected speech test. Ear Hear. 2002;23(5):385-98. PMid:12411772. http://dx.doi.org/10.1097/00003446-200210000-00001.
16. Sherbecoe RL, Studebaker GA. Audibility-index predictions of normal-hearing and normal-hearing-impaired listeners’ performance on the connected speech test. Ear Hear. 2003;24(1):71-88. PMid:12598814. http://dx.doi. org/10.1097/01.AUD.0000052748.94309.8A.
17. Gustafson SJ, Pittman AL. Sentence perception in listening conditions having similar speech intelligibility indices. Int J Audiol. 2011;50(1):34-40. PMid:21047291. http://dx.doi.org/10.3109/14992027.2010.521198. 18. Figueiredo RSL. Processos de verificação e validação da amplificação em crianças com deficiência auditiva: Índice de Inteligibilidade de Fala - SII - e comportamento auditivo [tese]. São Paulo (SP): Pontificia Universidade Catolica de São Paulo; 2013. 221 p.
19. Johnson RAWD. Applied multivariate statistical analysis. 3. ed. New Jersey: Prentice-Hall; 1992.
20. Fisher LD, Van Belle G. Biostatistics. New York: John Wiley & Sons; 1993.
21. Neter J, Kuther M, Nachtsheim C, Li W. Applied Linear Statistical Models. 5. ed. Chicago: Irwin; 2005.
22. Park S, Goo J, Jo C. Receiver Operating Characteristic (ROC) curve: practical review for radiologists. Korean J Radiol. 2004;5(1):11-8. PMid:15064554. http://dx.doi.org/10.3348/kjr.2004.5.1.11.
23. WHO: World Health Organization. Grades of hearing impairment [Internet]. Geneva: World Health Organization; 2007 [citado em 2015 Maio 15]. Disponível em: http://www.who.int/pbd/deafness/hearing_impairment_ grades/en/
24. Sininger YS, Grimes A, Christensen E. Auditory development in early amplified children: factors influencing auditory-based communication outcomes in children with hearing loss. Ear Hear. 2010;31(2):166-85. PMid:20081537. http://dx.doi.org/10.1097/AUD.0b013e3181c8e7b6. 25. Moeller MP, Hoover B, Peterson B, Stelmachowicz P. Consistency of
hearing aid use in infants with early-identified hearing loss. Am J Audiol. 2009;18(1):14-23. PMid:19029531. http://dx.doi.org/10.1044/1059-0889(2008/08-0010).
26. Novaes B, Versolatto-cavanaugh MC, Figueiredo RSL, Mendes BCA. Determinants of communication skills development in children with hearing impairment. J Soc Bras Fonoaudiol. 2012;24(4):335-41. PMid:23306683. 27. Rissatto MR, Novaes B. Próteses auditivas em crianças : importância
dos processos de verificação e validação. Pro Fono. 2009;21(2):131-6. PMid:19629323. http://dx.doi.org/10.1590/S0104-56872009000200008. 28. Scollie S. Fitting hearing aids to babies: three things you should know [Internet]. Houston: AudiologyOnline; 2006. [citado em 2011 Fev 2]. Disponível em: http://www.audiologyonline.com/articles/pf_article_detail. asp?article_id=1545
Author contributions
RSLF Research Project planning (doctorate degree): bibliographical and methodological study, collection and analysis of data. Production and reviewing; BM Research Project evaluation. Final text review; MCVC Data collection. Review