Original Article
Artigo Original
Mirna Rossi Barbosa1 Daniel de Sousa Medeiros2 Luiza Augusta Rosa Rossi-Barbosa3 Antônio Prates Caldeira1
Keywords
Hearing Loss Hearing Aids Patient Satisfaction Self-Assessment Outcome Assessment (Health Care)
Descritores
Perda Auditiva Auxiliares de Audição Satisfação do Paciente Autoavaliação Avaliação de Resultados (Cuidados de Saúde)
Correspondence address:
Mirna Rossi Barbosa
Rua São Marcos, 115, Todos os Santos, Montes Claros (MG), Brazil, CEP: 39400-128.
E-mail: [email protected]
Received: 07/24/2014
Accepted: 10/14/2014
Study carried out at the Graduate Program in Health Sciences, Universidade Estadual de Montes Claros – UNIMONTES – Montes Claros (MG), Brazil.
(1) Graduate Program in Health Sciences, Universidade Estadual de Montes Claros – UNIMONTES – Montes Claros (MG), Brazil.
(2) Regional Superintendence of Education of Montes Claros, Department of Education of Minas Gerais – Montes Claros (MG), Brazil.
(3) Department of Odontology, Universidade Estadual de Montes Claros – UNIMONTES – Montes Claros (MG), Brazil.
Financial support: Coordenação de Aperfeiçoamento de Pessoal de Nível Superior – CAPES; and Fundação de Amparo à Pesquisa do Estado de Minas Gerais – FAPEMIG.
Self-reported outcomes after hearing aid itting in
Minas Gerais, Brazil
Autoavaliação de resultados após adaptação com
aparelhos auditivos em Minas Gerais, Brasil
ABSTRACT
Purpose: To analyze the self-reported outcomes after hearing aid itting among individuals in the northern region of Minas Gerais and associated factors. Methods: A cross-sectional and analytical study with a random sample of adults and elderly attending the public health care service was conducted in the northern region of Minas Gerais (86 municipalities), Brazil. Study’s participants answered International Outcome Inventory for Hearing Aids (IOI-HA) questionnaires. Data were analyzed descriptively and analytically with Poisson regression analysis. Results: We interviewed 272 adults and 112 individuals reported not using their hearing aids regularly. The mean of IOI-HA global score was lower than expected. The individual’s relationship with their hearing aid (Factor 1) was worse than the individual’s relationship with their environment (Factor 2). Lower global scores were statistically associated with no work. Conclusions: The observed scores for the study’s population are lower than those recorded in other studies. The results suggest that there are limitations in the itting and follow-up of individuals who received hearing aids.
RESUMO
INTRODUCTION
Hearing loss has a great impact on human communication because it undermines the ability to recognize speech(1), thus compromising social relationships(2). According to Brazil’s 2010 census, more than 9.5 million inhabitants have some type of hear-ing loss(3). This number is very high, and may be an underestimate because hearing problems are not always perceived and can be denied by some people(4). With the increasing longevity of the population, hearing loss’ prevalence may increase and require diagnostic services and speciic care for the impaired hearing(5).
In Brazil, health care democratization has been increasing since the implementation of the Uniied Health System (UHS), which had positive impacts on the general population. Based on the principles of health as a citizen’s right and duty of the State, the UHS aims to provide a comprehensive and univer-sal, preventive and curative care, by means of decentralized management and provision of health services(6). This system also led to the institution of the new National Hearing Health Care Program (NHHCP), which encompasses hearing health promotion and speech therapy for people at all stages of life. This program has been deployed across 86% of the country(7). The services enabled by the Brazilian Ministry of Health must ensure that the person with hearing loss get the best use of their residual hearing. For this, the rehabilitation process must cover the selection and itting in hearing aids, with veriication of performance and beneit provided by the device, the application of speech perception protocols and questionnaires to evaluate the beneit and satisfaction of the patient and/or family, guidance and training of the handling of hearing aids, speech therapy for development of the user’s auditory and language skills, and periodic monitoring of hearing loss and ampliication(8). Despite having auditory rehabilitation guaranteed by UHS, there are costs involved in maintaining the hearing device that are the responsibility of the patient, such as the purchase of batteries.
With the implementation of the NHHCP, it has become necessary to evaluate the effects of individual hearing aid use to ensure effective treatment(9). To facilitate the comparison of results obtained by different researchers around the world, an assessment tool that is widely accepted and standardized is required(10). To this end, an evaluation has been proposed, which uses the International Outcome Inventory for Hearing Aids (IOI-HA) questionnaire(11). This questionnaire contains seven self-assessment items (use, beneit, residual activity re-striction, satisfaction, residual participation rere-striction, impact on others and quality of life). Each question offers a choice of ive graded responses ranging from 1 (worst) to 5 (best). IOI-HA has been translated into different languages and facili-tates comparisons between different investigations and clinical service models. In assessing the psychometric properties of the IOI-HA translated into Portuguese, the questionnaire showed moderate internal consistency of 0.69, measured by Cronbach’s
α coeficient, and reliability in 6 questions(12). The value of Cronbach’s αfor the questionnaire in English was 0.78(10).
The analysis of the IOI-HA still allows the extraction of two fac-tors. The grouping of the questions 1, 2, 4 and 7 consists of Factor 1, related to introspection of the patient with hearing aids, and Factor 2,
which refers to the inluence of hearing aid in the individual’s inter-action with the world, includes questions 3, 5 and 6(10).
Several studies have used the IOI-HA instrument to measure hearing aid user’s satisfaction and outcomes(10,13-18). Although the term satisfaction is already enshrined in literature in similar studies, it is worth noting that it has a polysemic connotation and different values and beliefs deine different perceptions for the term. Most of the time, patient’s satisfaction in such studies is taken as the difference between expectations and perceptions of experience, and, in a complementary way, as something that adds value to the quality of life. In general, these studies indicate that patients have good outcomes with their hearing aids. In a Swedish study(13), the average scores for the individual items lie between 3.5 and 4.3, and less than 5% of the responses received a score of 1, for all items. Similar results have been previously reported by another Swedish study(18). In the study conducted with 1,653 Australian hearing aid users(15), for items 1 (aid use) and 4 (satisfaction), the highest score of 5 was the most frequently selected. For the remaining items, 4 was the most common score. In an American study(10), the mean scores fall between 3.5 and 4.1. This seems to be indicative of a subject group that is relatively happy with their itting outcomes, on the whole. In the other hand, in the study conducted in João Pessoa, northeastern of Brazil(14), hearing aid users had dificulties in the use and handling of hearing aids, which negatively inluences on IOI-HA outcomes.
There are only a few published studies investigating factors associated with better outcomes of IOI-HA in hearing aid users. Higher mean IOI-HA scores were most strongly associated with greater satisfaction with hearing aid’s attributes of aid it/comfort, clarity of tone and sound, and comfort with loud sounds and with satisfaction in the listening situations of conversation with one person, in small groups, in large groups, and outdoors(15).
For Brazil, no studies have evaluated the factors associ-ated with the results of the IOI-HA. The present study was developed to analyze the self-reported outcomes after hearing aid rehabilitation among individuals in the northern region of Minas Gerais, Brazil, and associated factors.
METHODS
outcomes) of 30%, based on prior national studies(14). By means of the addresses, the researchers traveled to 29 cities in the north of Minas Gerais, where the patients lived. Data were collected during home visits by researchers who were not as-sociated with the hearing health care service. The researchers irst introduced themselves, explained the goals and procedures of the study, and then got the interviewee’s permission, by sign-ing the Informed Consent, which was signed by a responsible person, in cases the interviewee was illiterate and could not sign. Individuals who could not complete the questionnaire and those who admitted that they could not judge their hearing aid outcomes were excluded from the study. Patients who were not located in their homes after three attempts were also excluded. IOI-HA questionnaires were administered by trained staff to ensure that participants understood the questions. When neces-sary, questionnaires were read by the researchers. The IOI-HA questionnaire consists of seven questions that evaluate seven domains: (1) Use, (2) Beneit, (3) Residual activity limita-tion, (4) Satisfaclimita-tion, (5) Individual participation restriclimita-tion, (6) Impact on other people, and (7) Quality of life(11). Patients were instructed to choose only one answer for each question of the questionnaire that best characterizes their itting to their electronic hearing device. The global score is the sum of the scores from each of the seven items, with a minimum possible score of seven points and a maximum possible score of 35 points. A higher score indicates greater hearing aid outcomes than a lower score. The IOI-HA also allows separate assessments of the relationships between the individual and the hearing aid (Factor 1, “me and my hearing aid”, items 1, 2, 4, and 7) and between the individual and the environment in which they live (Factor 2, “me and the rest of the world”, items 3, 5, and 6).
A questionnaire was applied consisting of questions involv-ing gender, age, education, job, type of hearinvolv-ing loss, degree of hearing loss, type and category of the hearing aid, hearing aid itting coniguration (monaural or binaural), whether he/she was currently using the device and, if not, the reasons for that.
Results were descriptively and analytically analyzed. The mean and standard deviation (SD) were calculated for each item in the questionnaire, as well as the global score, and Factors 1 and 2. To evaluate factors associated with hearing aid worst outcomes, the dependent variables (global score, Factor 1 and Factor 2) and independent variables (socio-demographic variables) were transformed into dichotomous variables. Cut-offs used for the global score, Factor 1 and Factor 2 were the medians of users’ answers.
For the bivariate analysis, we used the χ2 test. Variables with p-values <0.30 were included in the multivariable model. For multiple regression analysis, we used the Poisson regression model with robust error variance, and we estimated prevalence ratios with their respective conidence intervals. We adopted a signiicance level of 5% (p<0.05). For statistical analysis of the data, we used the Statistical Package for the Social Sciences (SPSS) version 19.0. This study was approved by the Research Ethics Committee of the Universidade Estadual de Montes Claros, under report 2888/11. Participants were informed of and agreed to the research’s objectives when they signed the Informed Consent.
RESULTS
Characteristics of study’s participants
We visited 302 domiciles and interviewed 272 individuals attending the public hearing health care service select at random in 29 of 86 municipalities of northern Minas Gerais, Brazil. Thirty visits did not result in interviews (25 seniors and ive adults were excluded because they were not located after three attempts or were not able to evaluate the results of the hear-ing aid). Most of the participants were older patients (69.9%). Regarding education, 45.3% did not complete elementary school and 24.6% were illiterate (Table 1).
Characteristics n %
Gender
Female 147 54.0
Male 125 46.0
Age group (years old)
19 to 59 82 30.1
60 to 79 119 43.8
≥80 71 26.1
Education
Graduated 15 5.5
Completed high school 38 13.9 Completed elementary school 29 10.6 Did not complete elementary school 123 45.3
Illiterate 67 24.6
Work activity
Working 62 22.8
Not working/unemployed 31 11.4
Retired 179 65.8
Type of left ear hearing loss
Conductive 11 4.0
Sensorineural 81 29.8
Mixed 47 17.3
No hearing loss 5 1.8
No information 128 47.1
Degree of left ear hearing loss
Mild 12 4.4
Moderate 84 30.9
Moderately severe 14 5.1
Severe 19 7.0
Profound 12 4.4
No hearing loss 5 1.8
No information 126 46.3
Type of right ear hearing loss
Conductive 13 4.8
Sensorineural 80 29.4
Mixed 46 16.9
No hearing loss 7 2.6
No information 126 46.3
Degree of right ear hearing loss
Mild 13 4.8
Moderate 79 29.0
Moderately severe 11 4.0
Severe 24 8.8
Profound 14 5.1
No hearing loss 7 2.6
No information 124 45.6
Currently using a hearing aid
Yes 160 58.8
No 112 41.2
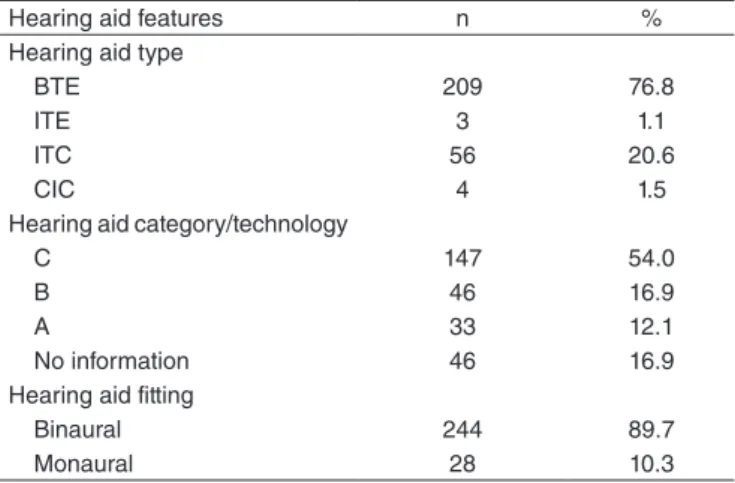
Information regarding the numbers, types and categories of hearing aids received are available in Table 2. Most users were binaurally itted (89.7%) with behind-the-ear (76.8%) hearing aids.
Of the individuals interviewed, 112 (41.2%) were not currently using the hearing aids. The reasons reported by the interviewees were: dificulty to adapt to the device due to discomfort, noise, pain in the ear, headache and rash (n=41); technical defects in the device (n=21); absence of beneit (n=19); inancial dificulties, or in access, to acquire the battery (n=13); dificulties in operating the device (n=7); tube or mold defects (n=4); other reasons (n=7).
Outcome scores and associated factors
Table 3 shows means and SDs for IOI-HA items, global scores, and Factor 1 and Factor 2 scores from this study,
compared to two national studies, and two international studies. The mean of Factor 1 was signiicantly higher than the mean of Factor 2 (p<0.001), in our study.
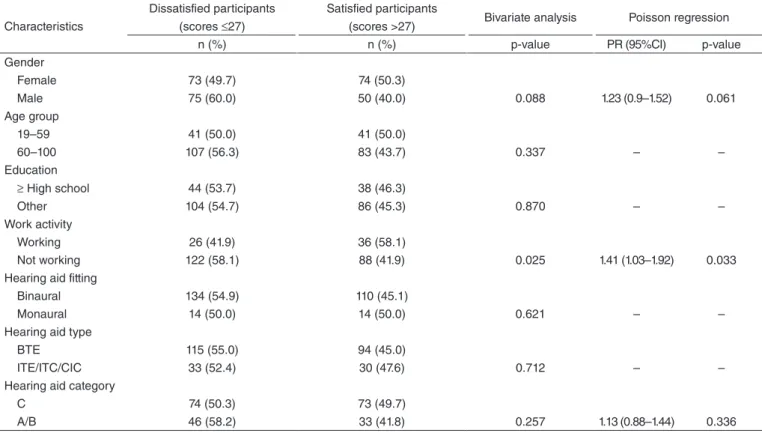
Relationships between participant’s characteristics and IOI-HA scores are available in Table 4. Using a Poisson regression model with robust error variance and p<0.30, we found that only work inactivity was signiicantly associated with low IOI-HA global scores.
Table 5 presents the bivariate and the multivariate analyses between the socio-demographic characteristics and Factors 1 and 2. Using a Poisson regression model with robust error variance and p<0.30, we found that gender, work activity and hearing aid itting coniguration were associated with Factor 1. No characteristics showed signiicant associations with Factor 2.
DISCUSSION
This study provides information on hearing aid outcomes among patients in Minas Gerais, Brazil. In general, mean scores observed in our study were lower than mean scores in similar studies(13,17,18). The exception is the study performed by the UHS in João Pessoa, Brazil(14), which showed a lower mean score in ive of the seven items assessed by the questionnaire. In our study, item scores ranged from 2.81 to 4.35 (out of a maxi-mum 5), indicating slightly positive adjustments to the hearing aid ittings(14). Probably, this score is lower than expected due to the large number of people who did not use their hearing aids for the two weeks prior to the survey. In some studies(10,13,15,18), the scores on items 1 and 2 were higher than those observed in the present study, which impacted on global score. In those stud-ies, the subjects were mostly elderly, but they varied in sample size, in participant’s characteristics and features of hearing aids.
Global IOI-HA scores from Chinese study were similar(19). Other national research studies found higher global scores compared to scores in our study(16). However, the comparable national studies had small sample sizes. For example, the study conducted in São Paulo(17) used a convenience, rather than a
Present study International studies Brazilian studies
n=272
Brännström and
Wennerström(13) Öberg et al.
(18) Morettin(17) Buriti and Oliveira(14)
n=199 n=154 n=43 n=32
IOI-HA Mean score SD Mean score SD Mean score SD Mean score SD Mean score SD
Use 3.07 1.82 3.9 1.1 3.9 1.1 4.44 0.81 3.13 1.191
Ben 2.81 1.67 4.0 1.1 4.1 0.9 3.95 0.92 2.88 1.116
RAL 3.68 1.24 3.5 1.2 3.6 1.0 3.83 0.87 2.71 0.908
Sat 4.03 1.38 4.3 1.0 4.3 1.0 4.48 0.59 3.25 1.225
RPR 4.03 1.31 4.1 1.1 4.3 0.9 4.46 0.82 3.50 1.351
Ioth. 4.35 1.11 3.9 1.1 4.0 1.0 4.44 0.95 3.50 1.251
QoL 3.76 1.21 3.8 1.0 3.7 1.0 4.09 0.92 3.38 1.173
Global 25.74 7.09 27.7 5.2 27.9 4.8 29.86 3.86
Factor 1 13.67 5.13 17.11 2.29
Factor 2 12.07 2.95 12.74 2.12
Table 3. Means and standard deviations of International Outcome Inventory for Hearing Aids items, global scores, and Factors 1 and 2 from this and other studies
Caption: IOI-HA = International Outcome Inventory for Hearing Aids; SD = standard deviation; Use = usage; Ben = benefit; RAL = residual activity restriction; Sat = satisfaction; RPR = residual participation restriction; Ioth = impact on others; QoL = quality of life
Hearing aid features n %
Hearing aid type
BTE 209 76.8
ITE 3 1.1
ITC 56 20.6
CIC 4 1.5
Hearing aid category/technology
C 147 54.0
B 46 16.9
A 33 12.1
No information 46 16.9
Hearing aid fitting
Binaural 244 89.7
Monaural 28 10.3
Caption: BTE = behind-the-ear; ITE = in-the-ear; ITC = in-the-canal; CIC = completely-in-the-canal; C = digital programmable, nonlinear, WDRC multichannel compression; B = digital programmable or non-programmable, WDRC mono- or multichannel compression; A = non-programmable, linear, single-channel compression
Characteristics
Dissatisfied participants (scores ≤27)
Satisfied participants
(scores >27) Bivariate analysis Poisson regression
n (%) n (%) p-value PR (95%CI) p-value
Gender
Female 73 (49.7) 74 (50.3)
Male 75 (60.0) 50 (40.0) 0.088 1.23 (0.9–1.52) 0.061
Age group
19–59 41 (50.0) 41 (50.0)
60–100 107 (56.3) 83 (43.7) 0.337 – –
Education
≥ High school 44 (53.7) 38 (46.3)
Other 104 (54.7) 86 (45.3) 0.870 – –
Work activity
Working 26 (41.9) 36 (58.1)
Not working 122 (58.1) 88 (41.9) 0.025 1.41 (1.03–1.92) 0.033 Hearing aid fitting
Binaural 134 (54.9) 110 (45.1)
Monaural 14 (50.0) 14 (50.0) 0.621 – –
Hearing aid type
BTE 115 (55.0) 94 (45.0)
ITE/ITC/CIC 33 (52.4) 30 (47.6) 0.712 – –
Hearing aid category
C 74 (50.3) 73 (49.7)
A/B 46 (58.2) 33 (41.8) 0.257 1.13 (0.88–1.44) 0.336
Table 4. Participant’s characteristics and their associations with International Outcome Inventory for Hearing Aids scores
Caption: PR = Prevalence Ratio; BTE = behind-the-ear; ITE = in-the-ear; ITC = in-the-canal; CIC = completely-in-the-canal; C = digital programmable, nonlinear, WDRC multichannel compression; A = non-programmable, linear, single-channel compression; B = digital programmable or non-programmable, WDRC mono- or multichannel compression
Characteristics
Factor 1 scores Poisson regression Factor 2 scores Poisson regression
≤15 n (%)
>15 n (%)
p-value
(crude) PR (95%CI)
p-value (adjusted)
≤13 n (%)
>13 n (%)
p-value
(crude) PR (95%CI)
p-value (adjusted)
Gender 0.051 0.026 0.896
Female 72 (49.0) 75 (51.0) 87 (59.2) 60 (40.8)
Male 76 (60.8) 49 (39.2) 1.27 (1.03–1.58) 73 (58.4) 52 (41.6) – –
Age group (years old) 0.136 0.677 0.385
19–59 39 (47.6) 43 (52.4) 45 (54.9) 37 (45.1)
60–100 109 (57.4) 81 (42.6) 1.07 (0.78–1.47) 115 (60.5) 75 (39.5) – –
Education 0.337 – 0.816
≥High school 41 (50.0) 41 (50.0) 35 (42.7) 47 (57.3)
Other 107 (56.3) 83 (43.7) – 84 (44.2) 106 (55.8) – –
Work activity 0.025 0.016 0.229
Working 26 (41.9) 36 (58.1) 23 (37.1) 39 (62.9)
Not working 122 (58.1) 88 (41.9) 1.47 (1.07–2.02) 96 (45.7) 114 (54.3) 1.03 (0.80–1.33) 0.83
HA fitting 0.131 0.011 0.615
Binaural 129 (52.9) 115 (47.1) 108 (44.3) 136 (55.7)
Monaural 19 (67.9) 9 (32.1) 1.41 (1.08–1.84) 11 (39.3) 17 (60.7) – –
HA type 0.511 – 0.186
BTE 116 (55.5) 93 (44.5) 96 (45.9) 113 (54.1)
ITE/ITC/CIC 32 (50.8) 31 (49.2) – 23 (36.5) 40 (63.5) 0.90 (0.69–1.17) 0.44
HA category 0.136 0.555
C 73 (49.7) 74 (50.3) 61 (41.5) 86 (58.5)
A/B 48 (60.8) 31 (39.2) 0.111 1.20 (0.94–1.52) 36 (45.6) 43 (54.4) – –
Caption: PR = Prevalence Ratio; BTE = behind-the-ear; ITE = in-the-ear; ITC = in-the-canal; CIC = completely-in-the-canal; C = digital programmable, nonlinear, WDRC multichannel compression; A = non-programmable, linear, single-channel compression; B = digital programmable or non-programmable, WDRC mono- or multichannel compression
random, sample. Of the 100 selected patients, only 43 returned to the clinic for the hearing aid outcomes evaluation. The study conducted in João Pessoa city(14) also presented a restricted sample, and it was not possible to infer each individual’s al-location process.
In this study, the hearing aid beneit item has the low-est mean score of all the IOI-HA items, indicating that many participants received no beneit from hearing aid use. For other participants, the hearing aids helped only modestly. In contrast, satisfaction with the hearing aid, assessed by questionnaire’s item 4, had a high mean score, indicating contradictory perceptions. This discrepancy between the beneit and satisfaction may be explained by patients’ feel-ings of gratitude upon receiving free hearing aids(20). Thus, the patients may not have felt “worthy” of dissatisfaction(16). In the United States, patients who utilized public health services had higher levels of hearing aid satisfaction than patients who utilized private health services(21).
The mean score for item 7 that addresses the “quality of life”, although not high, demonstrates that the hearing aid brought some joy to the lives of the participants in the study. Even some respondents who did not report beneits from hearing aid use reported positive perceptions regarding their post-itting quality of life. People who know that they are part of a scientiic research study may score higher as a result of this knowledge(13). Moreover, this perception may be a result of gratitude for the provided services or the beneit obtained when participants used the hearing aids.
The IOI-HA allows the assessment of two factors: an individual’s relationship with their hearing aid (Factor 1) and with their environment (Factor 2). The mean score for the respondents’ relationships with their environment was signii-cantly better than their relationships with their hearing aids. This inding suggests that limitations presented by individuals after ampliication, such as dificulties in understanding speech, did not negatively affect their social life or their daily activi-ties. The high mean score for item 6 (impact on others) also supports this. In another study, participants’ relationships with their hearing aids were signiicantly better than their relation-ships with their environment(22). In other studies(13,14,17,18), the individuals’ relationships with their hearing aids and with their environments were similar. Our results also showed that the low mean score for Factor 1 was likely due to the number of people who did not use their hearing aids at least for the last two weeks. Therefore, these patients did not receive beneits derived from hearing aid use. Many people, especially the elderly, do not effectively use their hearing aids. Moreover, even when they use them effectively, some still retain hearing dificulties(23). A potential explanation for the high Factor 2 score is that most of the participants were elders, who often have a less-active social life and whose everyday lives consist of activities within the home that do not require much communication with others. However, the age with the cut-off used in this study was not a variable that remained in the inal model.
Work activity was the only factor to be signiicantly associ-ated with overall worst outcomes. Individuals who did not work reported worst outcomes with hearing aid use. In a Swedish
study, work activity was not included in the analysis, and the global IOI-HA score was not signiicantly associated with any of the characteristics analyzed(13). Perhaps the communication needs of individuals who work are greater and, therefore, they are more cognizant of the beneits provided by the hearing aids. Another hypothesis could be related to inancial matters, since the patient’s income depends on their job performance. These questions were not investigated in this study.
Gender, work activity, and hearing aid itting conigura-tion were also signiicantly associated with IOI-HA Factor 1. Male individuals who did not work and were itted with mon-aural hearing aids had the lowest scores for the items related to an individual’s relationship with their hearing aid. In a study conducted in the United States, gender did not inluence the results of the IOI-HA Factor 1 scores(24). The study conducted with 8,389 hearing aid users(25) showed differences between genders; the women in the study used their hearing aids more regularly than the male participants. In a Swedish study, only hearing loss type signiicantly affected the IOI-HA scores. Although there were no signiicant differences among individu-als itted with monaural or binaural hearing aids, the monau-rally itted individuals had lower IOI-HA scores(13). Research conducted in Australia with 1,653 participants found that qualities of hearing aids (i.e. comfort, clarity of tone, comfort with loud sounds, and effective dialogue with one person, in small groups, in large groups, and outdoors) were associated with higher IOI-HA scores(15).
Numerous individuals in our study did not use their hear-ing aids regularly. Many identified “discomfort” as their reason for abandoning the hearing aids. Thus, due to poor it-tings and improper adjustments, many hearing aids remained unused. Furthermore, most of the study’s participants were over 60 years old. Older people have more dificulty handling hearing aids and remembering hearing aid use instructions(26).
In this study, hearing aid technology (type A, B and C) had no inluence on hearing aid outcomes. Similar scores were reported by individuals who received hearing aids with improved technology as by those who received hearing aids with simpler technology. A study that assessed satisfaction between analog and digital ampliication technology users found no signiicant difference between these two groups(27). Another study suggested that advanced hearing aid technology positively affected patient’s satisfaction scores(24).
and whether patients adhered to the hearing rehabilitation process(6). A possible solution to minimize hearing aid aban-donment would be to partner audiologists with the health service providers, in addition to provide basic guidelines (e.g. changing batteries, maintenance, cleaning and handling of the hearing aid) to users; they could also refer patients to an audiologist for therapy if necessary.
Hearing aid selections and ittings should continue to be evaluated. Longitudinal studies, such as the ecological momen-tary assessment, are feasible methods to evaluate dificulties faced by hearing aid users and to provide audiology services that can offer a better quality of life(30). It is necessary to identify individuals who are less satisied with their hearing aids and intervene in their behalf, so that they can achieve higher levels of satisfaction and hearing health resources can be optimized. Further studies are also needed to assess, in more detail, hear-ing aid beneits by ushear-ing an instrument such as the Abbreviated Proile of Hearing Aid Beneit (APHAB) questionnaire.
This study had some limitations. It was not possible to compare hearing aid satisfaction between people with differ-ent degrees of hearing loss because many participants did not have this information. Other factors not analyzed in this study were the associations between hearing loss type and degree with hearing aid satisfaction. The demographic characteristics evaluated explain some of the variability of the satisfaction results, but the most relevant contributors to hearing aid it-ting need to be identiied in future studies. Older people with low levels of educational attainment often found the IOI-HA instrument dificult to understand. Nevertheless, this study is the irst to evaluate hearing aid satisfaction among people of Minas Gerais, Brazil.
The observed results highlight aspects that had not been studied in Brazil with a so signiicant sample in a wide and poor area. The Hearing Health Care Service needs to adopt measures to increase patient compliance with the monitoring service and to minimize hearing aid abandonment.
CONCLUSIONS
We analyzed the self-reported outcomes after hearing aid itting among individuals in the northern region of Minas Gerais and found that the mean of IOI-HA global score was lower than expected. We also found that gender, work activ-ity and hearing aid itting coniguration were associated with the individual’s relationship with their hearing aid (Factor 1). No characteristics showed signiicant association with indi-vidual’s relationship with their environment (Factor 2). The hearing aid outcomes were lower than other studies, perhaps because many individuals were not using their hearing aids, at least, for the last two weeks.
ACKNOWLEDGMENTS
We thank the Coordenação de Aperfeiçoamento de Pessoal de Nível Superior (CAPES) for the scholarship granted and the Fundação de Amparo à Pesquisa do Estado de Minas Gerais (FAPEMIG).
*MRB was responsible for elaboration of the research, elaboration of the schedule, literature review, gathering and analysis of the data, writing and submission of the article; DSM was responsible for literature review, gathering of the data and writing of the article; LARRB was responsible for literature review, gathering and analysis of the data and writing of the article; APC was responsible for elaboration of the research, analysis of the data, correction of the manuscript and approved the final version.
REFERENCES
1. Peelle JE, Troiani V, Grossman M, Wingield A. Hearing loss in older adults affects neural systems supporting speech comprehension. J Neurosci. 2011;31(35):12638-43.
2. Pacala JT, Yueh B. Hearing deicits in the older patient: “I Didn’t Notice Anything”. JAMA. 2012;307(11):1185-94.
3. Instituto Brasileiro de Geograia e Estatística. Censo Demográico 2010: resultados gerais da amostra. Rio de Janeiro: IBGE; 2010.
4. José MR, Campos PD, Mondelli MFCG. Unilateral hearing loss: beneits and satisfaction from the use of hearing aids. Braz J Otorhinolaryngol. 2011;77(2):221-8.
5. Hampson R. Hearing aids. Eur Geriatr Med. 2012;3(3):198-200. 6. Paim J, Travassos C, Almeida C, Bahia L, Macinko J. The
Brazilian health system: history, advances, and challenges. Lancet. 2011;377(9779):1778-97.
7. Bevilacqua MC, Morettin M, Melo TM, Amantini RCB, Martinez MANS. Contributions for the Brazilian hearing health policy assessment. Rev Soc Bras Fonoaudiol. 2011;16(3):252-9.
8. Brasil. Ministério da Saúde. Secretaria de Assistência a Saúde. Portaria Nº 587, de 07 de outubro de 2004. Determina que as Secretarias de Estado da Saúde dos estados adotem as providências necessárias à organização e implantação das Redes Estaduais de Atenção à Saúde Auditiva e dá outras providências. Brasília: Diário Oicial da República Federativa do Brasil; 2004. p. 105.
9. Cook JA, Hawkins DB. Outcome measurement for patients receiving hearing aid services. Laryngoscope. 2007;117(4):610-3.
10. Cox RM, Alexander GC. The International Outcome Inventory for Hearing Aids (IOI-HA): psychometric properties of the English version. Int J Audiol. 2002; 41(1):30-5.
11. Cox RM, Hyde M, Gatehouse S, Noble W, Dillon H, Bentler R, et al. Optimal outcome measure, research priorities and international cooperation. Ear Hear. 2000;21(4 Suppl):S106-S15.
12. Gasparin M, Menegotto IH, Cunha CS. Propriedades psicométricas do questionário internacional – aparelho de ampliicação sonora individual. Braz J Otorhinolaryngol. 2010;76(1):85-90.
13. Brännström KJ, Wennerström I. Hearing aid itting outcome: clinical application and psychometric properties of a Swedish translation of the International Outcome Inventory for Hearing Aids (IOI-HA). J Am Acad Audiol. 2010;21(8):512-21.
14. Buriti AKL, Oliveira SHS. Hearing aid adaptation in users assisted by the Uniied Health System. Rev Soc Bras Fonoaudiol. 2012;17(1):41-6. 15. Hickson L, Clutterbuck S, Khan A. Factors associated with hearing aid
itting outcomes on the IOI-HA. Int J Audiol. 2010;49(8):586-95. 16. Lopes AS, Costa MJ, Aurélio NHS, Santos SN, Vaucher AV. Satisfaction
and performance of hearing aids users assisted in a Hearing Health Care Program. Rev CEFAC. 2011;13(4):698-709.
17. Morettin M. Avaliação dos benefícios e satisfação dos usuários de Aparelho de Amplificação Sonora Individual nos serviços de Audiologia do SUS. [dissertação]. São Paulo: Universidade de São Paulo; 2008.
18. Öberg M, Lunner T, Andersson G. Psychometric evaluation of hearing speciic self-report measures and their associations with psychosocial and demographic variables. Audiol Med. 2007;5(3):188-99.
20. Bevilacqua MC, Melo TM, Morettin M, Lopes AC. Evaluation of hearing health services: concepts and perspectives. Rev Soc Bras Fonoaudiol. 2009;14(3):421-6.
21. Cox RM, Alexander GC, Gray GA. Who wants a hearing aid? Personality proiles of hearing aid seekers. Ear Hear. 2005;26(1):12-26.
22. Teixeira CF, Augusto LGS, Caldas Neto CCS. Hearing aid: user satisfaction with their hearing aid and with their environment. Rev CEFAC. 2008;10(2):245-53.
23. Yamada M, Nishiwaki Y, Michikawa T, Takebayashi T. Impact of hearing dificulty on dependence in activities of daily living (ADL) and mortality: a 3-year cohort study of community-dwelling Japanese older adults. Arch Gerontol Geriatr. 2011;52:245-9.
24. Williams VA, Johnson CE, Danhauer JL. Hearing aid outcomes: effects of gender and experience on patients’ use and satisfaction. J Am Acad Audiol. 2009;20(7):422-32.
25. Staehelin K, Bertoli S, Probst R, Schindler C, Dratva J, Stutz EZ. Gender and hearing aids: patterns of use and determinants of nonregular use. Ear Hear. 2011;32(6):26-37.
26. Desjardins JL, Doherty KA. Do experienced hearing aid users know how to use their hearing aids correctly? Am J Audiol. 2009;18:69-76. 27. Magni C, Freiberger F, Tonn K. Evaluation of satisfaction measures of analogical
and digital hearing aid users. Rev Bras Otorrinolaringol. 2005;71(5):650-7. 28. Laplante-Lévesque A, Hickson L, Worrall L. Predictors of rehabilitation
intervention decisions in adults with acquired hearing impairment. J Speech Lang Hear Res. 2011;54(5):1385-99.
29. Lundberg M, Andersson G, Lunner T. A randomized, controlled trial of the Short-Term effects of complementing an Educational Program for hearing aid users with telephone consultations. J Am Acad Audiol. 2011;22(10):654-62. 30. Galvez G, Turbin MB, Thielman EJ, Istvan JA, Andrews JA, Henry JA.