Sex differences in 24-hour ultra-marathon
perfor-mance - A retrospective data analysis from 1977 to
2012
Laura Peter,IChristoph Alexander Ru¨st,I Beat Knechtle,I,IIThomas Rosemann,IRomuald LepersIII
IUniversity of Zurich, Institute of General Practice and Health Services Research, Zurich, Switzerland.IIGesundheitszentrum St. Gallen, St. Gallen,
Switzerland.IIIUniversity of Burgundy, Faculty of Sport Sciences, Dijon, France.
OBJECTIVES:This study examined the changes in running performance and the sex differences between women and men in 24-hour ultra-marathons held worldwide from 1977 to 2012.
METHOD:Changes in running speed and ages of the fastest 24-hour ultra-marathoners were determined using single- and multi-level regression analyses.
RESULTS:From 1977 to 2012, the sex differences in 24-hour ultra-marathon performance were 4.6¡0.5% for all women and men, 13.3% for the annual fastest finishers, 12.9¡0.8% for the top 10 and 12.2¡0.4% for the top 100 finishers. Over time, the sex differences decreased for the annual fastest finishers to 17%, for the annual 10 fastest finishers to 11.3¡2.2% and for the annual 100 fastest finishers to 14.2¡1.8%. For the annual fastest men, the age of peak running speed increased from 23 years (1977) to 53 years (2012). For the annual 10 and 100 fastest men, the ages of peak running speed were unchanged at 40.9¡2.5 and 44.4¡1.1 years, respectively. For women, the ages of the annual fastest, the annual 10 fastest and the annual 100 fastest remained unchanged at 43.0¡6.1, 43.2¡2.6 and 43.8¡0.8 years, respectively.
CONCLUSION:The gap between the annual top, annual top 10 and annual top 100 female and male 24-hour ultra-marathoners decreased over the last 35 years; however, it seems unlikely that women will outrun men in 24-hour ultra-marathons in the near future. The fastest 24-hour ultra-marathoners worldwide achieved their peak performance at the age of master athletes (.35 years).
KEYWORDS: Ultra-endurance; Running; Athlete.
Peter L, Ru¨st CA, Knechtle B, Rosemann T, Lepers R. Sex differences in 24-hour ultra-marathon performance - A retrospective data analysis from 1977 to 2012. Clinics. 2014;69(1):38-46.
Received for publication onApril 19, 2013;First review completed onJune 23, 2013;Accepted for publication onJuly 16, 2013 E-mail: [email protected]
Tel.: 41 0 71 226 82 82
& INTRODUCTION
Over the last several decades, the sex difference in running performance has been a matter of particular interest (1-5). When women’s running performance improved during the 1980s (6), the discussion arose whether it would be possible for women to outrun men (1,3-5,7-9). In 1992, a controversial paper published in ‘‘Nature’’ reported that the mean running speed for women and men would intersect in the future, first at the marathon distance in approximately 1998 (6). However, marathon-running performance reached a plateau for women since the mid 1980s, with a sex difference of approximately 12% (10).
Several studies addressed the question whether the sex difference in running performance would decrease with increasing race distance (1,2,4,5,9,11). It was assumed that women might be able to achieve a performance equivalent to men in ultra-marathon running (1,5,9). However, analysis of the world’s best running times at distances from 100 meters (m) to 200 kilometers (km) demonstrated a 7-19% sex difference in running performance, with an increase in sex difference for distances longer than the marathon (4). Similar findings have been reported for long-distance triathlons. Knechtle et al. (12) investigated the world’s fastest performances in ultra-triathlons held between 1985 and 2009 and demonstrated that the sex difference in performance increased with increasing race distance. Men were approximately 19% faster than women in Double (i.e., 7.6 km swim, 360 km cycle and 84.4 km run) and Triple Ironman ultra-triathlons (i.e., 11.4 km swim, 540 km cycle and 126.6 km run) and approximately 30% faster in Deca Iron ultra-triathlons (i.e., 38 km swim, 1,800 km cycle and 422 km run). In Ironman triathlons, the sex difference in swimming was stable over the last 20 years; however, the Copyrightß2014CLINICS– This is an Open Access article distributed under
the terms of the Creative Commons Attribution Non-Commercial License (http:// creativecommons.org/licenses/by-nc/3.0/) which permits unrestricted non-commercial use, distribution, and reproduction in any medium, provided the original work is properly cited.
No potential conflict of interest was reported.
difference increased slightly in cycling and decreased in running (13). The sex difference for swimming performance was smaller than for running and cycling. Thus, the sex difference in the Ironman triathlon differed between the disciplines (14).
Sex differences in endurance performances appear to be biological in origin (2). The major reasons for the observed performance differences include the larger body size of men (15) and the lower body fat percentage compared to women (15,16,17). Men have a greater maximal oxygen uptake (VO2 max) compared to women (10,15,16), which leads to a relevant advantage in aerobic performance (2,16,18). Men also have higher hemoglobin and hemato-crit counts relative to women (15). Another advantage for men is their greater training motivation (19). Women also lack experience in long-distance running competitions (2,4), which might be a disadvantage relative to men. However, there are also reasons why women could outperform men at longer distances. Women have greater fat stores (15-17) and tend to oxidize fat at a higher rate than men (20,21). Another assumption is that women seem to have less damage to skeletal muscle cells relative to men during and/or following prolonged exercises (22), which may also be an advantage at ultra-endurance distances. Women have lower body mass (23) and likely need less energy for shifting their body mass from one place to another.
The sex difference in ultra-endurance running (events lasting.6 hours) (24) has been investigated in 100-mile ultra-marathons held in North America (1,5,8,9,11) and for the world’s best running times for distances up to 200 km (4). Recent studies investigating the performance in ultra-marathon running have mainly focused on a single race or a series of races rather than on a series of races held worldwide. The aim of this study was to investigate the changes in sex differences in ultra-endurance distances on the basis of the complete, world-wide 24-hour ultra-marathons held between 1977 and 2012. A 24-hour ultra-marathon is a time-limited race. Competitors have to cover the largest possible distance within 24 hours with performances from approximately 146 km (25) to 300 km. The world record for this type of marathon is 303.5 km (www.ultra-marathon.org). We hypothesized that the sex difference at the 24-hour ultra-marathon distance has been decreasing over the past several decades.
& MATERIALS AND METHODS
All procedures used in this cross-sectional data analysis met the ethical standards of the Swiss Academy of Medical Sciences (www.samw.ch/en/Ethics/Guidelines/Currently-valid-guidelines.html) and were approved by the Institu-tional Review Board of Kanton St. Gallen, Switzerland (decision letter of June 1, 2010) with a waiver of the requirement for informed consent of the participants given the fact that the study involved the analysis of publicly available data.
Data sampling and data analysis
All competitors who ever participated in a 24-hour ultra-marathon between 1977 and 2012 were analyzed regarding the associations between age, sex and race performance (Table 1). The data set for this study was obtained from the
Table 1 -Number of total finishers for each country, sorted by the percentage of female finishers.
Country Women Men Overall
Percentage of women
New Zealand 31 26 57 54.4
Romania 2 2 4 50
Ukraine 112 273 385 29.1
United States 788 1984 2772 28.4
Canada 57 151 208 27.4
Latvia 21 58 79 26.6
Great Britain 164 455 619 26.5
Croatia 5 14 19 26.3
Japan 190 543 733 25.9
Hungary 76 223 299 25.4
Serbia 41 121 162 25.3
Turkey 2 6 8 25
Macedonia 1 3 4 25
Suisse 158 513 671 23.6
Estonia 9 30 39 23.1
Slovenia 5 17 22 22.7
Denmark 55 191 246 22.4
Finland 58 207 265 21.9
South Korea 13 47 60 21.7
Germany 1563 5722 7285 21.5
Luxembourg 3 11 14 21.4
Uruguay 10 37 47 21.3
Taiwan 59 223 282 20.9
Italy 200 767 967 20.7
Sweden 79 309 388 20.4
Kazakhstan 4 16 20 20
Mexico 1 4 5 20
Russia 448 1829 2277 19.7
Brazil 178 739 917 19.4
Czech Republic 111 461 572 19.4
Australia 80 378 458 17.5
Argentina 30 145 175 17.1
Poland 56 310 366 15.3
France 1403 8099 9502 14.8
Austria 293 1709 2002 14.6
Spain 44 316 360 12.2
Belarus 13 96 109 11.9
Netherlands 55 413 468 11.8
Ireland 5 54 59 8.5
South Africa 3 38 41 7.3
Belgium 21 404 425 4.9
Greece 9 246 255 3.5
Slovakia 5 152 157 3.2
Portugal 1 30 31 3.2
Norway 1 78 79 1.3
Lithuania 27 27 0
Bulgaria 21 21 0
Algeria 20 20 0
India 12 12 0
Cyprus 8 8 0
Mali 8 8 0
Moldova 7 7 0
Montenegro 7 7 0
Monaco 5 5 0
Iraq 3 3 0
Morocco 3 3 0
Somalia 3 3 0
Uzbekistan 3 3 0
Bosnia and Herzegovina 1 1 0
Chile 1 1 0
Egypt 1 1 0
Iran 1 1 0
Iceland 1 1 0
Malaysia 1 1 0
Senegal 1 1 0
Singapore 1 1 0
Tunisia 1 1 0
race website ‘‘Deutsche Ultramarathon-Vereinigung’’ (www. ultra-marathon.org). To facilitate reading and to increase the comparability of similar analyses of races of various distances, all race distances were transformed to running speed (km N h-1) before analysis. Running speed was calculated using the equation [running speed in kmN h-1] = [race distance achieved in km]/24 hours (h). To determine changes in peak performance in running and the age of peak running speed, running speed and the age of the annual top, annual top 10 and annual top 100 women and men were analyzed. The sex difference in running performance was calculated using the equation ([km N h-1 in women] - [km N h-1 in men])/[km N h-1 in men]6100, where the sex difference was calculated for
every pairing of equally placed competitors (e.g., between male and female 1st place, between male and female 2nd place, etc.) before calculating the mean values and standard deviations of all the pairings. To facilitate reading, all sex differences were transformed to absolute values prior to analysis. The performance density for both women and men was calculated using the equation ([running speed of the 10th place or of the 100th place finisher] - [running speed of the 1st place finisher])/ [running speed of the 1st place finisher]
6 100. The
performance density expresses the differences in running time between the 1stplace and the 10thplace finishers and between the 1st place and the 100th place finishers as percentages of the winner’s times, which indicates the densities of both the 10 and 100 fastest competitors in the race.
Statistical analyses
The data in the text and figures are reported as means¡standard deviations (SD). To increase the relia-bility of the data analyses, each set of data was tested for normal distribution and homogeneity of variances prior to statistical analyses. Normal distribution was tested using a D’Agostino and Pearson omnibus normality test, and the homogeneity of variances was tested using a Levene’s test. Trends in participation were analyzed using regression analysis with the ‘‘straight line’’ and ‘‘exponential growth equation’’ models, whereas for each set of data (e.g., each age group), both models were compared using Akaike’s Information Criteria (AIC) to decide which model resulted in the highest probability of correctness.
Single- and multi-level regression analyses were used to investigate changes in performance and the ages of the finishers. A hierarchical regression model was used to avoid the impact of a cluster effect on the results of the analysis of overall performance and sex difference if one competitor finished more than once in the annual top, annual top 10 or annual top 100. Furthermore, performance regression analyses were corrected for competitors’ ages to prevent misinterpretation of the ‘‘age effect’’ as a ‘‘time effect.’’ To analyze differences between two groups, the Student’s t-test was used for cases of normally distributed data, and the Mann-Whitney test was used for non-normally distributed data. Statistical analyses were performed using IBM SPSS Statistics software (Version 21, IBM SPSS, Chicago, IL, USA) and GraphPad Prism (Version 6.01, GraphPad Software, La Jolla, CA, USA). Significance was accepted atp,0.05 (two-sided for t-tests).
& RESULTS
Complete data containing both sex and age were available for a total of 34,049 racers, of which 6,463 were women (19%) and 27,586 were men (81%).
Participation trends
The number of races increased exponentially from one race in 1977 to 81 races in 2012. The numbers of annual overall finishers and both annual female and male finishers also increased exponentially over the time period studied. In 1977, one man finished a 24-hour ultra-marathon. In 2012, 6,463 women and 27,586 men finished 24-hour ultra-marathons. Women accounted for 19% of the overall field. Table 1 displays the number of male and female finishers by country of origin. New Zealand was the only country where the proportion of female finishers was greater than male finishers. Apart from South Africa, there were no female finishers from African countries. The proportion of women trended higher in countries with larger numbers of total finishers.
Sex difference in running speed
to -6.4% (2012) (Figure 3A). The performance density from the 100thfinisher to the fastest finishers increased for men from -67% (1989) to -24.4% (2012) and increased for women from -76.2% (1999) to -24.5% (2012) (Figure 3B).
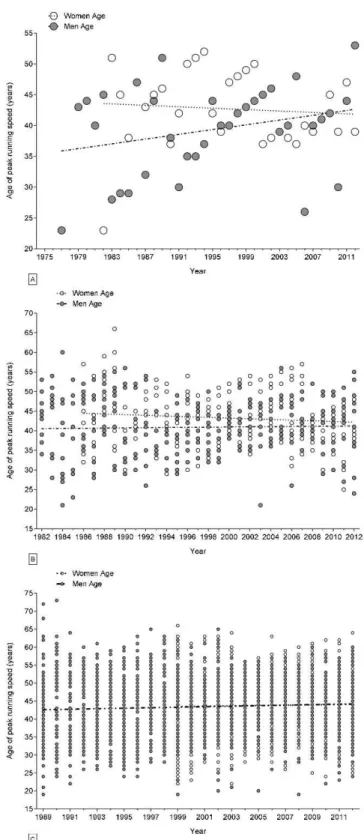
The age of peak running speed
The highest number of finishes for both men and women were from competitors aged 45-49. The age of the annual
fastest men increased from 23 years (1977) to 53 years (2012) (Figure 4A), including when controlling for repeated finishes (Table 2). The age of the annual fastest women remained unchanged at 43.0¡6.1 years (Figure 4A), including when controlling for repeated finishes (Table 2). For the annual 10 fastest finishers, the mean ages remained unchanged at 43.2¡2.6 years for women and 40.9¡2.5 years for men (Figure 4B), including when controlling for repeated finishes
(Table 2). When considering the annual 100 fastest finishers, the mean ages remained unchanged at 43.8¡0.8 years for women and 44.4¡1.1 years for men (Figure 4C), including when controlling for repeated finishes (Table 2).
& DISCUSSION
The main findings of this study were first, that there were increases in the numbers of both female and male 24-hour
ultra-marathoners from 1977-2012. Second, a decrease in the sex difference over this time was observed for the annual fastest, the annual top 10 and the annual top 100 24-hour ultra-marathoners. Third, the fastest 24-hour ultra-marath-oners worldwide were master athletes (.35 years).
Increasing numbers of 24-hour running finishers A main finding regarding participation was that the number of finishers increased exponentially for both women and men over the studied time period. New Zealand was the only country where the proportion of female finishers was higher than the proportion of male finishers. Apart from South Africa, there were no female finishers from African countries. For all countries, there appeared to be a trend toward a higher proportion of female finishers in countries with larger numbers of total finishers. These results may suggest that men were forerunners in the performance of new emerging sports, while women began later. Women started participating later in sporting compe-titions such as the marathon (15). In 1972, sex discrimination was prohibited in the USA (US Department of Labor, 1972), and in 1984, the first Olympic marathon for women took place (15). Today, the possibility for women to pursue their interests in sports is higher than in the past. Nowadays, it is possible for female ultra-marathoners to look after their children, work a full time job and train for ultra-marathons (26).
Based on the analysis of single ultra-marathons within a single country, the number of female ultra-marathoners increased during the same period (1998 to 2011), whereas the number of male ultra-marathoners remained unchanged in a mountain ultra-marathon such as the 78-km ‘‘Swiss Alpine’’ held in Davos, Switzerland (27). The number of male participants was also reported to be stable in the 100-mile ultra-marathons in the USA (7,11). Hoffman and Wegelin (7), Hoffman (11) and Eichenberger et al. (27) performed their analyses in Western countries; therefore, nationality may also have an influence on the number of competitors.
Sex difference in performance for 24-hour ultra-marathoners
The running speeds of the annual fastest, the annual top 10 and the annual top 100 women increased over the studied time period; as hypothesized, the sex difference correspondingly decreased during this same timeframe. Women lack experience in participating in endurance performance competitions (4). Over the last several decades, women have had more time to improve their experience in ultra-endurance running competitions; therefore, they have enhanced their ultra-marathon performances. Thus, the increase in the number of female competitors could be a possible explanation for the decrease in the sex difference among 24-hour ultra-marathoners.
We found differences of approximately 13% between both the annual winners and the annual top 10 finishers, and 12% for the annual top 100 finishers. This sex difference was similar to the sex difference observed in terms of marathon distance, which has remained stable since the mid 1980s (10). However, this sex difference was lower than the 20% sex difference Hoffman (8) reported for the winners of 100-mile ultra-marathons in North America. One explana-tion for this difference could be that the best ultra-marathoners opted to participate in the more famous
Figure 2 - Changes in running speed and sex differences in
100-mile runs than in the 24-hour ultra-marathon, or it could be because Hoffman (5,8) analyzed races only in North America. Coast et al. (4) described a 14% difference for the 100-mile distance and a 19.1% difference for the 200-km distance. In a 24-hour ultra-marathon, the mean distance is approximately 146 km (25); however, this distance might be considerably longer for the fastest women and men. Thus, the sex difference in the present 24-hour ultra-marathoners was also less than the difference suggested by Coast et al. (4).
The sex difference between the 100 fastest women and men was less than the sex difference between the fastest 10 women and men. The sex difference of all female and male finishers was only 4.6%, whereas the sex differences of the annual top 10 and the annual top 100 finishers were both greater than 12%. Indeed, there was a higher sex difference among elite 24-hour ultra-marathon finishers compared to the average finishers. These results correspond to the trend reported by Hoffman (8) for 100-mile runs. He reported sex differences of 20% for the fastest finish time and only 3% for the average finish time (8).
The average time differences between the winner and the 10th place athlete decreased for both women and men. In
2012, this time difference was smaller for women than men. The density for the top 10 finishers was higher for women than for men. The densities for the top 100 men (24.4%) and top 100 women (24.5%) were approximately the same in 2012. Lepers et al. reported the same trend for Ironman triathletes: the performance densities for elite women and men seemed to become similar (13).
The age of peak running performance in 24-hour ultra-marathons. An interesting finding regarding the age of the 24-hour ultra-marathoners was that the mean ages were unchanged over the entire study period - approximately 41 years for the annual top 10 men and approximately 44 years for the annual top 100 men. For women, mean ages of the top 10 and top 100 finishers remained unchanged at approximately 44 years.
The ages of the fastest women and men increased in single ultra-marathons held within a single country, such the ‘‘Swiss Alpine’’ from 1998 to 2011 in Switzerland (27) and the mile runs from 1978 to 2008 in the USA (8). In the 100-mile runs in North America, the fastest times were achieved by competitors in the 30-39 age group for men and the 40-49 age group for women (8). The fastest running times in the Table 2 -Multi-level regression analyses for changes in running speed over time, sex differences in running and ages of finishers (Model 1), with corrections for multiple finishes (Model 2) and ages of athletes with multiple finishes (Model 3).
Model ß SE (ß) Stand.ß T p-value
Running speed in men
Annual fastest 1 0.072 0.012 0.717 5.911 ,0.0001
2 0.072 0.012 0.717 5.911 ,0.0001
3 0.075 0.013 0.747 5.891 ,0.0001
Annual 10 fastest 1 0.066 0.005 0.630 14.245 ,0.0001
2 0.066 0.005 0.630 14.245 ,0.0001
3 0.067 0.005 0.633 14.344 ,0.0001
Annual 100 fastest 1 0.065 0.002 0.476 26.510 ,0.0001
2 0.065 0.002 0.476 26.510 ,0.0001
3 0.066 0.002 0.483 27.009 ,0.0001
Running speed in women
Annual fastest 1 0.099 0.026 0.579 3.826 0.001
2 0.099 0.026 0.579 3.826 0.001
3 0.099 0.027 0.578 3.739 0.001
Annual 10 fastest 1 0.102 0.007 0.678 15.101 ,0.0001
2 0.102 0.007 0.678 15.101 ,0.0001
3 0.103 0.007 0.685 15.225 ,0.0001
Annual 100 fastest 1 0.150 0.007 0.516 22.524 ,0.0001
2 0.150 0.007 0.516 22.524 ,0.0001
3 0.150 0.007 0.516 22.497 ,0.0001
Sex difference in running speed
Annual fastest 1 -0.600 0.256 -0.399 -2.343 0.026
2 -0.600 0.256 -0.399 -2.343 0.026
Annual 10 fastest 1 -0.759 0.056 -0.639 -13.612 ,0.0001
2 -0.759 0.056 -0.639 -13.612 ,0.0001
Annual 100 fastest 1 -1.139 0.040 -0.602 -28.174 ,0.0001
2 -1.139 0.040 -0.602 -28.174 ,0.0001
Age in men
Annual fastest 1 0.071 0.023 0.063 3.077 0.002
2 0.071 0.023 0.063 3.077 0.002
Annual 10 fastest 1 0.023 0.045 0.030 0.518 0.605
2 0.023 0.045 0.030 0.518 0.605
Annual 100 fastest 1 0.193 0.118 0.275 1.642 0.110
2 0.193 0.118 0.275 1.642 0.110
Age in women
Annual fastest 1 -0.058 0.124 -0.086 -0.465 0.645
2 -0.058 0.124 -0.086 -0.465 0.645
Annual 10 fastest 1 -0.087 0.052 -0.103 -1.693 0.092
2 -0.087 0.052 -0.103 -1.693 0.092
Annual 100 fastest 1 0.048 0.050 0.026 0.959 0.338
‘‘Swiss Alpine’’ were achieved by competitors in the 30-34 age group for women and the 40-44 age group for men (27). Reaburn and Dascombe (28) described a curvilinear decline in endurance performances beginning at the age of 35 years, and they defined endurance athletes older than
35 years as being ‘‘master athletes.’’ Master athletes are systematically trained for special forms of sports designed for older adults. However, in the 24-hour ultra-marathons, the male and female world elite athletes are older than 40 years. Additionally, in the ‘‘Swiss Alpine’’ ultra-marathon
Figure 3 -Differences in running speed between the 1stand the 10thplace finishers (Panel A) and between the 1stand the 100thplace
(27) and in the 100-mile runs (8), the fastest finishers were master athletes, according to Raeburn’s definition. Our results are in agreement with Reaburn’s definition of master athletes. In 24-hour ultra-marathons, the male world elite athletes were, on average, 41 years old; consequently, master athletes have to be older. Therefore, our results
suggest a change for the age definition of master athletes in terms of ultra-endurance running.
Limitations and implications for future research The strength of this study is that the results are based on an extensive dataset with a large sample size. This dataset provides a good overview of the sex differences among 24-hour ultra-marathons worldwide. However, the national-ities of the participants are unknown, and we do not have data concerning athlete physiology, psychology, body composition, training, previous experience, weather, race route, etc. A recent study identified that one’s longest training run and the best marathon time were important predictor variables for successful 24-hour ultra-marathon performance. Anthropometric characteristics, such as body fat or skinfold thickness, did not influence performance (25). For the 100-mile ultra-marathons, Hoffman and Fogard (29) investigated factors related to successful finishing, such as body mass index, training volume, ambient temperatures at the events, medication use, etc. Krouse et al. (26) investi-gated the influence of motivation, goal orientation and training for female ultra-runners and reported that general health orientation and psychological coping were the strongest motivational factors for female ultra-marathoners. To summarize, there were constant increases in the numbers of female and male 24-hour ultra-marathoners during the 1977-2012 time period. The running speeds of the annual fastest women and men increased, and the sex differences in running speed decreased over these years. The ages of peak running speed were unchanged for the annual top 10 and annual top 100 women and men. Although women’s running speeds improved, the sex differences in performance decreased over time. Therefore, it seems unlikely that women will be able to outrun men in 24-hour ultra-marathons in the near future. The fastest 24-hour ultra-marathoners worldwide achieved their peak performance at the age of master athletes (.35 years). Future studies are needed to investigate longer distance-and time-limited races. Most likely, the age of peak running speed increases in proportion to the length of the race.
& AUTHOR CONTRIBUTIONS
Peter L collected the data and drafted the manuscript. Ru¨st CA performed the statistical analyses. Knechtle B designed the study and helped drafting the manuscript. Rosemann T critically revised the manuscript for important intellectual content. Lepers R assisted in the statistical analyses and helped drafting the manuscript.
& REFERENCES
1. Bam J, Noakes TD, Juritz J, Dennis SC. Could women outrun men in ultramarathon races? Med Sci Sports Exerc. 1997;29(2):244-7, http://dx. doi.org/10.1097/00005768-199702000-00013.
2. Cheuvront SN, Carter R, Deruisseau KC, Moffatt RJ. Running per-formance differences between men and women: an update. Sports Med. 2005;35(12):1017-24, http://dx.doi.org/10.2165/00007256-200535120-00002.
3. Dyer KF. Catching up the men: Women in sport. Junction Books; 1982. 4. Coast JR, Blevins JS, Wilson BA. Do gender differences in running
performance disappear with distance? Can J Appl Physiol. 2004; 29(2):139-45.
5. Hoffman MD. Ultramarathon trail running comparison of performance-matched men and women. Med Sci Sports Exerc. 2008;40(9):1681-6, http://dx.doi.org/10.1249/MSS.0b013e318177eb63.
6. Whipp BJ, Ward SA. Will women soon outrun men? Nature. 1992; 355(6355):25, http://dx.doi.org/10.1038/355025a0.
7. Hoffman MD, Wegelin JA. The Western States 100-Mile Endurance Run: participation and performance trends. Med Sci Sports Exerc. 2009;41(12):2191-8, http://dx.doi.org/10.1249/MSS.0b013e3181a8d553.
Figure 4 -Changes in the ages of peak running speed for the
8. Hoffman MD. Performance trends in 161-km ultramarathons. Int J Sports Med. 2010;31(1):31-7.
9. Speechly DP, Taylor SR, Rogers GG. Differences in ultraendurance exercise in performance-matched male and female runners. Med Sci Sports Exerc. 1996;28(3):359-65.
10. Sparling PB, O’Donnell EM, Snow TK. The gender difference in distance running performance has plateaued: an analysis of world rankings from 1980 to 1996. Med Sci Sports Exerc. 1998;30(12):1725-9, http://dx.doi.org/ 10.1097/00005768-199812000-00011.
11. Hoffman MD, Ong JC, Wang G. Historical analysis of participation in 161 km ultramarathons in North America. Int J Hist Sport. 2010; 27(11):1877-91.
12. Knechtle B, Knechtle P, Lepers R. Participation and performance trends in ultra-triathlons from 1985 to 2009. Scand J Med Sci Sports. 2011; 21(6):e82-90, http://dx.doi.org/10.1111/j.1600-0838.2010.01160.x. 13. Lepers R. Analysis of Hawaii ironman performances in elite triathletes
from 1981 to 2007. Med Sci Sports Exerc. 2008;40(10):1828-34, http://dx. doi.org/10.1249/MSS.0b013e31817e91a4.
14. Lepers R, Maffiuletti A. Age and gender interactions in ultraendurance performance: insight from the triathlon. Med Sci Sports Exerc. 2011;43 (1):134-9, http://dx.doi.org/10.1249/MSS.0b013e3181e57997.
15. Lynch SL, Hoch AZ. The female runner: gender specifics. Clin Sports Med. 2010;29(3):477-98, http://dx.doi.org/10.1016/j.csm.2010.03.003. 16. Drinkwater BL. Women and exercise: physiological aspects. Exerc Sport Sci
Rev. 1984;12:21-51, http://dx.doi.org/10.1249/00003677-198401000-00004. 17. Durnin JV, Womersley J. Body fat assessed from total body density and its estimation from skinfold thickness: measurements on 481 men and women aged from 16 to 72 years. Br J Nutr. 1974;32(1):77-97.
18. Sparling PB. A meta-analysis of studies comparing maximal oxygen uptake in men and women. Res Q Exerc Sport. 1980;51(3):542-52.
19. Deaner RO. Distance running as an ideal domain for showing a sex difference in competitiveness. Arch Sex Behav. 2013;42(3):413-28, http:// dx.doi.org/10.1007/s10508-012-9965-z.
20. Hellstro¨m L, Blaak E, Hagstro¨m-Toft E. Gender differences in adrenergic regulation of lipid metabolism during exercise. Int J Sports Med. 1996; 17(6):439-47.
21. Tarnopolsky MA. Gender differences in substrate metabolism during endurance exercise. Can J Appl Physiol. 2000;25(4):312-27.
22. Tiidus PM. Estrogen and gender effects on muscle damage, inflamma-tion and oxidainflamma-tion stress. Can J Appl Physiol. 2000;25(4):274-87. 23. Harris JA, Benedict FG. A biometric study of human basal metabolism.
Proc Natl Acad Sci U S A. 1918;4(12):370-3, http://dx.doi.org/10.1073/ pnas.4.12.370.
24. Zaryski C, Smith DJ. Training principles and issues for ultra-endurance athletes. Curr Sports Med Rep. 2005;4(3):165-70, http://dx.doi.org/10. 1097/01.CSMR.0000306201.49315.73.
25. Knechtle B, Knechtle P, Rosemann T, Lepers R. Personal best marathon time and longest training run, not anthropometry, predict performance in recreational 24-hour ultrarunners. J Strength Cond Res. 2011; 25(8):2212-8, http://dx.doi.org/10.1519/JSC.0b013e3181f6b0c7. 26. Krouse RZ, Ransdell LB, Lucas SM, Pritchard ME. Motivation, goal
orientation, coaching, and training habits of women ultrarunners. J Strength Cond Res. 2011;25(10):2835-42, http://dx.doi.org/10.1519/ JSC.0b013e318204caa0.
27. Eichenberger E, Knechtle B, Ru¨st CA, Rosemann T, Lepers R. Age and sex interactions in mountain ultramarathon running- the Swiss Alpine Marathon. Open Access J Sports Med. 2012;3:73-80.
28. Reaburn P, Dascombe B. Endurance performance in master athletes. Eur Rev Aging Phys Act. 2008;5(1):31-42, http://dx.doi.org/10.1007/s11556-008-0029-2.