BGD
7, 6243–6264, 2010Assessing the ecological status of
plankton in Anjos Bay
G. C. Pereira et al.
Title Page
Abstract Introduction
Conclusions References
Tables Figures
◭ ◮
◭ ◮
Back Close
Full Screen / Esc
Printer-friendly Version
Interactive Discussion
Discussion
P
a
per
|
Dis
cussion
P
a
per
|
Discussion
P
a
per
|
Discussio
n
P
a
per
|
Biogeosciences Discuss., 7, 6243–6264, 2010 www.biogeosciences-discuss.net/7/6243/2010/ doi:10.5194/bgd-7-6243-2010
© Author(s) 2010. CC Attribution 3.0 License.
Biogeosciences Discussions
This discussion paper is/has been under review for the journal Biogeosciences (BG). Please refer to the corresponding final paper in BG if available.
Assessing the ecological status of
plankton in Anjos Bay: a flow
cytometry approach
G. C. Pereira1, A. R. de Figuiredo1, P. M. Jabor2, and N. F. F. Ebecken1
1
Federal University of Rio de Janeiro – COPPE/UFRJ, Centro de Tecnologia, Cidade Universit ´aria, Ilha do Fund ˜ao, Bloco B, Cx. Postal 68506 Rio de Janeiro, RJ, Brazil 2
Admiral Paulo Moreira Institute of Sea Studies – IEAPM, Departamento de Oceanografia, rua Kioto 253, Cep.28430-000 Arraial do Cabo, RJ, Brazil
Received: 21 June 2010 – Accepted: 22 July 2010 – Published: 19 August 2010
Correspondence to: G. C. Pereira (gcp@coc.ufrj.br)
BGD
7, 6243–6264, 2010Assessing the ecological status of
plankton in Anjos Bay
G. C. Pereira et al.
Title Page
Abstract Introduction
Conclusions References
Tables Figures
◭ ◮
◭ ◮
Back Close
Full Screen / Esc
Printer-friendly Version
Interactive Discussion
Discussion
P
a
per
|
Dis
cussion
P
a
per
|
Discussion
P
a
per
|
Discussio
n
P
a
per
|
Abstract
This aim of this paper is to assess the use of the heterotrophic/autotrophic ratio as an early indicator of trophic status as a part of development of a real time monitoring program at Anjos Bay, Rio de Janeiro, Brazil. An in-situ flow cytometer was used to quantify the abundances of phytoplankton and cyanobacteria, which were identified by
5
chlorophyll and phycoerythrin autofluorescence, respectively. Heterotrophic prokary-otes and viruses were quantified by DNA-binding fluorochromes; merozooplankton lar-vae were collected by plankton net and quantified by stereomicroscopy. The temporal and spatial distributions of these variables were evaluated on the basis of weekly obser-vations from August 2006 to September 2007. The heterotrophic/autotrophic ratio and
10
the viral abundance were correlated with upwelling events and assume an apparently seasonal pattern. A possible control mechanism and influential factors are discussed, and it is concluded that this ecosystem is bottom-up controlled under eutrophic condi-tions and top-down controlled under oligotrophic condicondi-tions.
1 Introduction
15
The ultimate goal in coastal ecology is to use information about ecosystem processes to manage and preserve natural resources and water quality. Because these sys-tems are somewhat resistant to external impacts and disturbances on a wide range of temporal and spatial scales, it is essential to define “good” ecological status and establish impact thresholds. In this context, ecological status is a synonym for quality.
20
According to Windhorst et al. (2005), ecological status should be assessed on the ba-sis of selected indicators of function and state and requires close cooperation between researchers and decision makers in the natural and socio-economic sciences. Ecosys-tem integrity (Karr, 1992) is a holistic and sysEcosys-temic protection strategy (M ¨uller et al., 2000) and should be understood in terms of networks of interactions between
biolog-25
BGD
7, 6243–6264, 2010Assessing the ecological status of
plankton in Anjos Bay
G. C. Pereira et al.
Title Page
Abstract Introduction
Conclusions References
Tables Figures
◭ ◮
◭ ◮
Back Close
Full Screen / Esc
Printer-friendly Version
Interactive Discussion
Discussion
P
a
per
|
Dis
cussion
P
a
per
|
Discussion
P
a
per
|
Discussio
n
P
a
per
|
2006). It is reflected in exergy capture (represented here by gross primary production), storage capacity (represented by nutrient input/output balances), cycling (represented by the turn-over of nutrient stocks), matter losses, and heterogeneity (represented by the heterotrophic/autotrophic ratio).
The establishment of an acceptable use level for ecosystem services requires
exper-5
tise from various stakeholders and social regulations (environmental laws). Definitions of “good ecological status” may vary with space, time and even culture.
Researchers have proposed several indicators of ecological status. Costanza et al. (1992) recommended using the balance among system components as an ecosys-tem health indicator, and Jørgensen et al. (2005) suggested accounting for trophic
sta-10
tus. The balance between autotrophy and heterotrophy, which determines the trophic status of the system, has attracted significant interest (Wiegner et al., 2003; Thottathil et al., 2008; Martinez-Garcia et al., 2010) because it is related to both nutrient con-ditions and organic matter cycles. Autotrophic/heterotrophic ratios greater than one indicates a heterotrophic system and ratios less than one indicate an autotrophic
sys-15
tem.
Most current ecosystem monitoring programs cannot accommodate exhaustive, costly or time-consuming techniques for describing system conditions and dynamics.
Under these constraints, flow cytometry (FCM) has been an effective tool for rapidly
analysing plankton communities since the early 1980s (Yentsch et al., 1983; Li, 1995;
20
Larsen et al., 2001; Rose et al., 2004). Recent advances related to this technique offer
the possibility of real-time monitoring (Dubellar and Greerders, 2004; Sosik and Olson, 2007).
Thus, the aim of this work is to assess the main biological components of coastal waters to evaluate prevailing ecological conditions, the first component of
environmen-25
BGD
7, 6243–6264, 2010Assessing the ecological status of
plankton in Anjos Bay
G. C. Pereira et al.
Title Page
Abstract Introduction
Conclusions References
Tables Figures
◭ ◮
◭ ◮
Back Close
Full Screen / Esc
Printer-friendly Version
Interactive Discussion
Discussion
P
a
per
|
Dis
cussion
P
a
per
|
Discussion
P
a
per
|
Discussio
n
P
a
per
|
of this indicator to environmental parameters has been well demonstrated, but possi-ble biological influences are not well understood. Although flow cytometry can also be used to estimate biomass, this issue is not addressed here due to the complex shapes of microphytoplankton; our goal is to monitor the abundance of biological components.
2 Material and methods
5
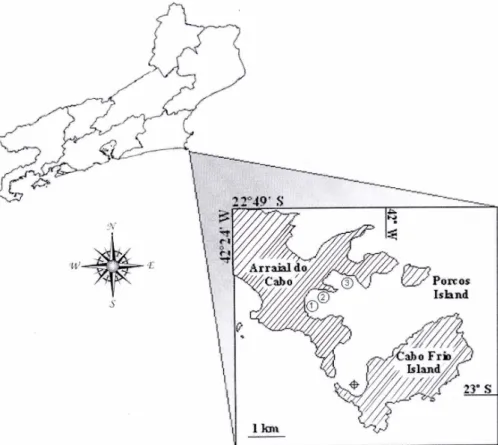
2.1 Study area
The studied plankton community is found in small (∼45 km2), shallow (∼10 m depth),
wind-driven and upwelling-influenced Anjos Bay, which is formed by Cabo Frio Island
(23◦S, 42◦W) in the state of Rio de Janeiro, southeastern Brazil. Dominant E-NE winds
are influenced by tropical maritime anticyclones due to the Coriolis Effect and Ekman
10
transport, which shunt nutrient-depleted surface water (Brazil Current) offshore
(Caste-lao and Barth, 2006). This water body is followed by up-flowing, nutrient-rich (∼12
µM-L NO3-N), deeper South Atlantic Central Water (SACW), which comes from around
200–300 m depth. This process generates a thermocline around the bay mouth, near our permanent monitoring station. Sporadically, SACW reaches the surface and enters
15
the bay. An inverse pattern can be caused by S-SW winds because cold fronts drive
the oligotrophic Brazil Current (<1 µM-L NO3-N) toward the coast. As SACW is heated
in the euphotic layer, nitrate declines more rapidly than phosphate, and the N/P ratio declines (Pereira and Ebecken, 2009b). Upwelling periods occur more frequently dur-ing the summer (from September to April), and downwelldur-ing periods are more frequent
20
BGD
7, 6243–6264, 2010Assessing the ecological status of
plankton in Anjos Bay
G. C. Pereira et al.
Title Page
Abstract Introduction
Conclusions References
Tables Figures
◭ ◮
◭ ◮
Back Close
Full Screen / Esc
Printer-friendly Version
Interactive Discussion
Discussion
P
a
per
|
Dis
cussion
P
a
per
|
Discussion
P
a
per
|
Discussio
n
P
a
per
|
2.2 Field sampling
Water samples were collected weekly from 0.5 m depth at the fixed station with a 5-L Niskin bottle from August 2006 to August 2007. The sampling point was selected because the island is an environmentally protected area and is still considered pristine. Temperature and salinity were obtained by a 316 CTD probe (General Oceanics) at
5
the time of sampling. Phosphate, nitrate and chlorophyll were measured according to SCOR (1996). An aliquot (200 mL) of water was immediately put in a cryovial and fixed with 1% paraformaldehyde (final concentration) for laboratory quantification of
heterotrophic cells. Meroplankton larvae (organisms-m3) were collected with plankton
net (100 µm mesh), immediately fixed at 4% formaldehyde (final concentration) and
10
counted under a stereomicroscope.
On three occasions when SACW was detected at the surface (T <18◦C; S<36),
sampling was conducted at 22 stations to assess spatial distribution throughout the bay.
2.3 Flow cytometry
15
During sample collection, an in-situ autonomous scanning flow cytometer (CytoBuoy b.v. Woerden, The Netherlands), which was installed into a moored buoy and oper-ated by radio transmitter (Dubellar, 2000), measured total suspended particles. The cytometer was equipped with a solid blue laser providing 20 mW at 488 nm, forward scatter (FWS) and side scatter (SWS, 446/500 nm) detectors and three others for red
20
(chlorophyll) 1, 669/725 nm), orange/yellow 2, 601/651) and green/yellow (FL-3, 515/585 nm) fluorescence. It can analyse large particles (up to 1 mm) and relatively
large water volumes (up to 4 cm3 per sample). In addition to the five average signal
heights, simple mathematical parameters were evaluated for each signal shape, in-cluding inertia, fill factor, asymmetry, number of peaks, length, and apparent size (FWS
25
BGD
7, 6243–6264, 2010Assessing the ecological status of
plankton in Anjos Bay
G. C. Pereira et al.
Title Page
Abstract Introduction
Conclusions References
Tables Figures
◭ ◮
◭ ◮
Back Close
Full Screen / Esc
Printer-friendly Version
Interactive Discussion
Discussion
P
a
per
|
Dis
cussion
P
a
per
|
Discussion
P
a
per
|
Discussio
n
P
a
per
|
particle takes to cross the laser beam) and the trigger level set by the equipment. All field data were acquired over one minute at a flow rate of 2 mm/s, triggered to the for-ward scatter channel using the CytoSift software and analysed by CytoWave software, both of which were provided by the manufacturer. For the three cases in which SACW were detected at the surface, the CytoBuoy flow cytometer was transported by a small
5
motorboat.
The abundances of heterotrophic prokaryotes and virus-like particles were evaluated in laboratory, about two hours after sampling, by a FACScan flow cytometer (Becton Dickinson, San Jose, Calif.) equipped with an air-cooled laser providing 15 mW at 488 nm and a standard filter setup that was triggered to green fluorescence.
Fluores-10
cent yellow-green 0.92-µm beads (105/ml−1) were added to all samples as an internal
quality standard (Fluoresbrite Microparticles, Polysciences) after staining with SYBR-Green-1 (Sigma-Aldrich, S ˜ao Paulo-Brazil) as described previously (Brussaard et al., 2004). The samples were analysed for one minute at a delivery rate of 50 µl/min using the CellQuest™ Pro software, which was provided by the manufacturer. Because the
15
SYBR-Green-I stained all DNA, heterotrophic prokaryote abundance was estimated by subtracting the amount of cyanobacteria that were enumerated in-situ by the CytoBuoy flow cytometer. Data were acquired from both cytometers as logarithmic values.
2.4 Data analysis
A time-series correlation matrix was calculated to access the relationships among all
20
BGD
7, 6243–6264, 2010Assessing the ecological status of
plankton in Anjos Bay
G. C. Pereira et al.
Title Page
Abstract Introduction
Conclusions References
Tables Figures
◭ ◮
◭ ◮
Back Close
Full Screen / Esc
Printer-friendly Version
Interactive Discussion
Discussion
P
a
per
|
Dis
cussion
P
a
per
|
Discussion
P
a
per
|
Discussio
n
P
a
per
|
3 Results
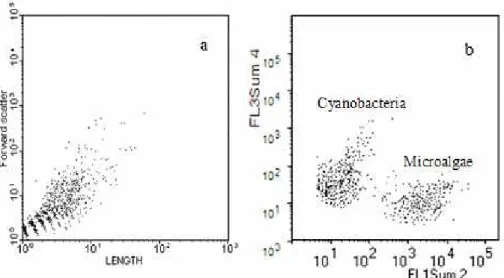
3.1 In-situ flow cytometry acquisition
Figure 2 shows in-situ and real-time scatterplots from the CytoBuoy instrument. Beads are not used as size markers because the cytometer was working directly in the sea. Figure 2a presents a distribution of all suspended particles based on their lengths
5
and forward scatter signals. Autotrophs in the same sample are plotted in Fig. 2b. Microalgae were identified by their red (chlorophyll) autofluorescence (FL1Sum 2), and cyanobacteria were easily identified by the yellow-green fluorescence (FL3Sum
4) caused by their phycoerythrin content. The highest abundance of microalgae
(9.66E+02) was found during the spring (10/06), and the lowest value (2.30E+00) was
10
found in the winter (07/07). The abundance of cyanobacteria, which always exceeded
that of microalgae, varied from 7.61E+04 during the summer (01/07) to 3.02E+03 in
the winter (07/07). Phytoplankton accounted for just 6.38% of total suspended parti-cles.
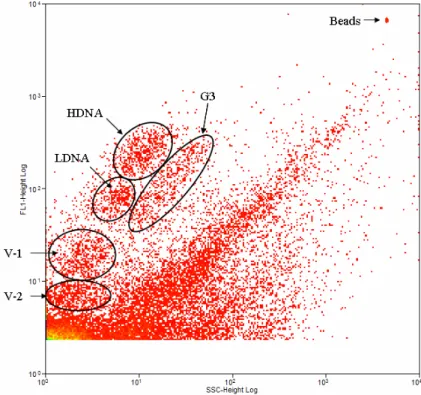
3.2 Ex-situ flow cytometry acquisitions
15
Figure 3 presents one of the FACScan cytograms after SYBR-Green-I nucleic acid staining and shows SSC (side scatter) vs. FL-1 (green fluorescence) for this cytome-ter. The detection threshold was progressively decreased until viruses were detected. Three heterotrophic prokaryote groups are shown: LDNA, HDNA and a third that we call G3. Notably, heterotrophic prokaryotes were always more abundant than
phyto-20
plankton. According to Lebaron et al. (2001), the subgroup with high DNA content (HDNA) represents active cells and the low-DNA-content (LDNA) subgroup represents inactive cells. Because Zubkov et al. (2001) showed, through methionine incorporation
followed by flow cytometric sorting, that members of the G3 subgroup have different
levels of activity as LDNA and as HDNA, the subgroups were quantified both
sepa-25
BGD
7, 6243–6264, 2010Assessing the ecological status of
plankton in Anjos Bay
G. C. Pereira et al.
Title Page
Abstract Introduction
Conclusions References
Tables Figures
◭ ◮
◭ ◮
Back Close
Full Screen / Esc
Printer-friendly Version
Interactive Discussion
Discussion
P
a
per
|
Dis
cussion
P
a
per
|
Discussion
P
a
per
|
Discussio
n
P
a
per
|
(average 1.38E+05). LDNA was the most abundant group, consistent with
observa-tions by Luna et al. (2002) and Pereira et al. (2009c), and increased by around 32% during upwelling events. The total amount of heterotrophic prokaryotes varied from
9.53E+03 in the winter (07/07) to 9.81E+05 in the summer (01/07). Figure 3 presents
two viral populations, V-1 and V-2, which are considered the major causes of mortality
5
and therefore the primary regulators of organismal abundance (Suttle, 2005). V-1, a diverse group that infects phytoplankton (Brussaard et al., 2000), varied in abundance
from 3.64E+03 to 1.92E+04 in summer (01/07); V-2 (bacteriophage) abundances
var-ied from 2.14E+03 in autumn to 4.13E+05 in summer. Thus, the total virus
abun-dance varied from 1.23E+05 to 3.62E+07 during the summer (02/07). Viruses were
10
by far the most abundant biological entities, followed by heterotrophic prokaryotes, phytoplankton and zooplankton. The latter category ranged in abundance from 9 to
1076.33 organisms/m3.
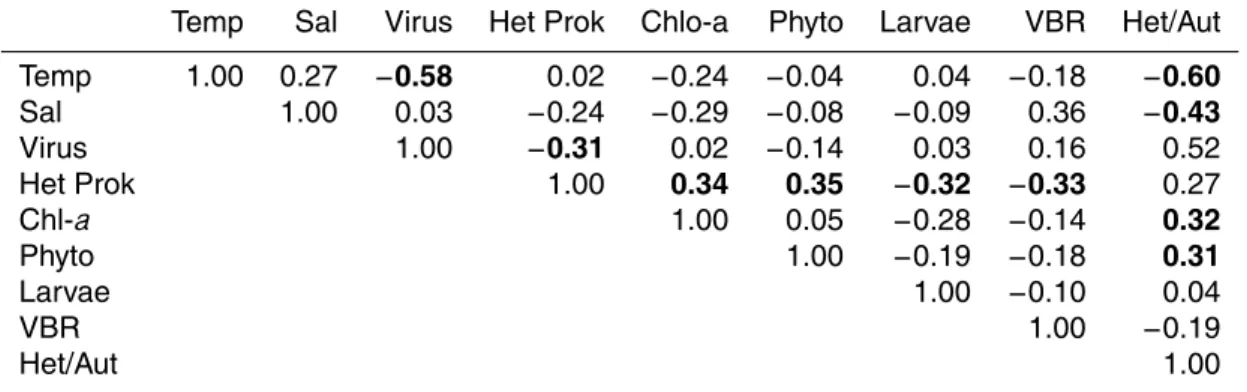
3.3 Correlations between parameters
Table 1 reveals the correlations between the studied variables for the entire time
se-15
ries. It does not include nutrient data because these variables did not present any correlation with the others. The strongest correlation was a negative correlation
be-tween the virus community and temperature (n=40, r2=−0.58, p=0.05), indicating
that upwelling waters increased the amount of virus. On the other hand, heterotrophic
prokaryotes presented the lowest negative correlation with viruses (n=40,r2=−0.31,
20
p=0.05), which may be due to the fact that only the V-2 subgroup can be hosted
by prokaryotes. Chlorophyll demonstrated a statistically significant relationship with
heterotrophic prokaryotes (n=40,r2=0.34, p=0.05), as previously noted by Cotner
and Biddanda (2002), and the real-time cytometric enumeration of phytoplankton cells
was slightly higher (n=40,r2=0.35,p=0.05). If the number of cyanobacteria is
sub-25
BGD
7, 6243–6264, 2010Assessing the ecological status of
plankton in Anjos Bay
G. C. Pereira et al.
Title Page
Abstract Introduction
Conclusions References
Tables Figures
◭ ◮
◭ ◮
Back Close
Full Screen / Esc
Printer-friendly Version
Interactive Discussion
Discussion
P
a
per
|
Dis
cussion
P
a
per
|
Discussion
P
a
per
|
Discussio
n
P
a
per
|
of meroplankton larvae is also negatively correlated with heterotrophic prokaryotes
(n=40,r2=−0.32,p=0.05) but, even though meroplankton are important grazers, no
correlation was found with phytoplankton. The ratio of viruses to bacteria (heterotrophic
prokaryotes) (VBR) was correlated with salinity (n=40,r2=0.36,p=0.05) and
nega-tively correlated with heterotrophic prokaryotes (n=40,r2=−0.33, p=0.05). Finally,
5
the heterotrophic/autotrophic ratio (Het/Aut) was the most strongly correlated variable.
It presented negative correlations with temperature (n=40,r2=−0.60, p=0.05) and
salinity (n=40, r2=−0.43, p=0.05) and positive correlations with virus abundance
(n=40,r2=0.52,p=0.05), chlorophyll (n=40,r2=0.32,p=0.05) and phytoplankton
abundance (n=40, r2=0.31, p=0.05). These relationships demonstrate the
rele-10
vance of this variable.
By analysing these correlations separately (data not shown), we verified that,
dur-ing upwelldur-ing events, both virus (n=6,r2=−0.91,p=0.05) and phytoplankton counts
(n=6, r2=−0.82, p=0.05) have strong and negative correlations with temperature;
the Het/Aut ratio had a positive and significant correlation with temperature (n=6,
15
r2=0.90,p=0.05). Under oligotrophic conditions, the abundance of merozooplankton
larvae was negatively correlated with both heterotrophic bacteria (n=34, r2=−0.40,
p=0.05) and VBR (n=34, r2=−0.40, p=0.05). A positive correlation was also
ver-ified between VBR and salinity (n=34, r2=0.38, p=0.05) and between the Het/Aut
ratio and merozooplankton larvae (n=34,r2=0.44,p=0.05).
20
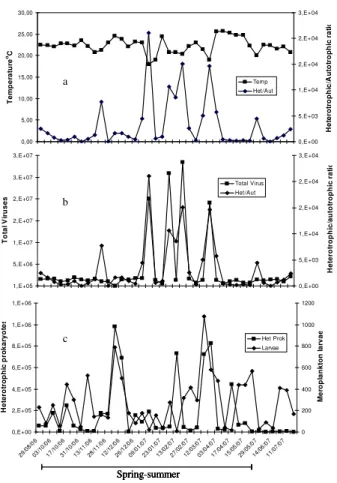
3.4 Temporal variability
Figure 4 presents the temporal distribution of the heterotrophic/autotrophic ratio. The highest prokaryotic abundance occurred during the summer (January to April), when upwelling was stronger (Fig. 4a), and was five-fold higher than phytoplankton. Most samples returned higher ratios of heterotrophic prokaryotes to phytoplankton,
suggest-25
BGD
7, 6243–6264, 2010Assessing the ecological status of
plankton in Anjos Bay
G. C. Pereira et al.
Title Page
Abstract Introduction
Conclusions References
Tables Figures
◭ ◮
◭ ◮
Back Close
Full Screen / Esc
Printer-friendly Version
Interactive Discussion
Discussion
P
a
per
|
Dis
cussion
P
a
per
|
Discussion
P
a
per
|
Discussio
n
P
a
per
|
shows that meroplankton larvae peaks are not coupled to the abundance of het-erotrophic prokaryotes or the hethet-erotrophic/autotrophic ratio.
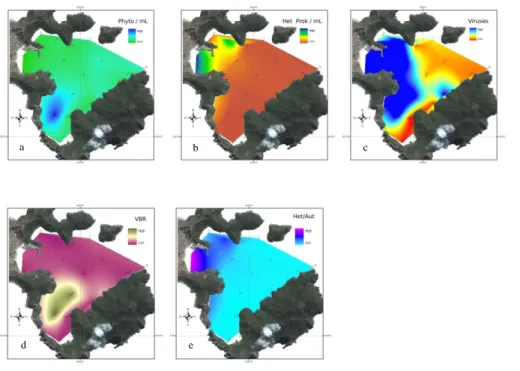
3.5 Spatial distribution of cytometric measurements
Figure 5 shows the spatial distribution of the average value of the cytometrically-measured variables for the three cases in which SACW was detected at the
sur-5
face. Figure 5a and b presents the spatial distribution of phytoplankton and
erotrophic prokaryotes abundances, respectively. The highest occurrences of het-erotrophic prokaryotes (marked as 1, 2 and 3 in Fig. 1) are easily explainable by sewage discharges from the harbor and the marine farm. Similarly, Fig. 5c shows the distribution of the virioplankton community. Although we have only observed a negative
10
correlation between virus abundance and heterotrophic prokaryotes, this figure sug-gests that the virioplankton distribution is tightly coupled to host availability. Figure 5d shows the spatial distribution of VBR, which is influenced by the sporadic entrance of upwelled waters from outside the bay. Finally, Fig. 5e presents the spatial distribution of the Heterotrophic/Autotrophic ratio, which indicates the highest heterotrophic activity
15
at the Anjos and Forno inlets.
4 Discussion
4.1 General conditions
The balance between autotrophy and heterotrophy in aquatic ecosystems is consid-ered an important indicator of trophic status. Values of the autotrophic/heterotrophic
20
BGD
7, 6243–6264, 2010Assessing the ecological status of
plankton in Anjos Bay
G. C. Pereira et al.
Title Page
Abstract Introduction
Conclusions References
Tables Figures
◭ ◮
◭ ◮
Back Close
Full Screen / Esc
Printer-friendly Version
Interactive Discussion
Discussion
P
a
per
|
Dis
cussion
P
a
per
|
Discussion
P
a
per
|
Discussio
n
P
a
per
|
because the abundance of prokaryotes was at least one order of magnitude higher than that of phytoplankton.
4.2 Sources of variability
Both anthropogenic activities (sewage discharges from the harbor and marine farm) and upwelling are important sources of allochthonous DOC and nutrients that sustain
5
the productivity of the bay. However, the increased amount of virus in the water col-umn caused by upwelling can drive an autochthonous source of carbon, as has been previously demonstrated (Middelboe et al., 2003; Suttle, 2005); Danovaro et al. (2001) also demonstrated a high abundance of viruses on the sediment. The concurrence of high VBR values and phytoplankton abundances at the same site is consistent with this
10
hypothesis under conditions of phytoplankton growth in upwelling conditions and pre-dominant autotrophy. Clearly, viruses are important players because they can strongly influence the heterotrophic/autotrophic balance; they should be taken into account in monitoring and management programs. Although we did not find a correlation be-tween viruses and phytoplankton, several articles (Short and Suttle, 2002; Larsen et
15
al., 2008; Vardi et al., 2009) have described this control as an effect of species-specific
interactions.
Under oligotrophic conditions, the viral pressure is expected to decrease as the lyso-genic life cycle becomes prevalent (Cochran and Paul, 1998). Merozooplankton lar-vae may become more omnivorous and less dependent on phytoplankton.
Quantifica-20
tion of zooplankton grazing and production has been the subject of intensive research for decades. Despite the negative correlation shown in Table 1, the presence of
het-erotrophic prokaryotes inside the zooplankton gut is well known and has been eff
ec-tively demonstrated (Bianchi et al., 1992; Braun et al., 1999). However, it is not known whether the prokaryotes were ingested or whether they represent symbiotic flora
25
BGD
7, 6243–6264, 2010Assessing the ecological status of
plankton in Anjos Bay
G. C. Pereira et al.
Title Page
Abstract Introduction
Conclusions References
Tables Figures
◭ ◮
◭ ◮
Back Close
Full Screen / Esc
Printer-friendly Version
Interactive Discussion
Discussion
P
a
per
|
Dis
cussion
P
a
per
|
Discussion
P
a
per
|
Discussio
n
P
a
per
|
can certainly influence heterotrophic and autotrophic metabolisms through alternative inner carbon sources like leakage due to sloppy feeding (Møller, 2005). Our results suggest that this phenomenon is widespread and that interactions among autotrophic and heterotrophic microorganisms are among the most important factors controlling the productivity of aquatic systems. In short, upwelling promotes a shift from heterotrophy
5
to autotrophy on an apparently seasonal basis. Most primary production is based in autotrophic prokaryotes because cyanobacteria were more abundant than microalgae. In oligotrophic conditions, however, the abundances of autotrophic and heterotrophic prokaryotes are similar and therefore indicate equilibrium.
5 Conclusions
10
This work represents the preliminary development of a real-time environmental mon-itoring program. Management strategies must assess current environmental condi-tions before making decisions about, for example, discharges. In this context, the heterotrophic/autotrophic ratio can be used as an early indicator of system status.
This differentiation is important because different food web configurations have diff
er-15
ent processing capabilities. We have identified differences based on horizontal
BGD
7, 6243–6264, 2010Assessing the ecological status of
plankton in Anjos Bay
G. C. Pereira et al.
Title Page
Abstract Introduction
Conclusions References
Tables Figures
◭ ◮
◭ ◮
Back Close
Full Screen / Esc
Printer-friendly Version
Interactive Discussion
Discussion
P
a
per
|
Dis
cussion
P
a
per
|
Discussion
P
a
per
|
Discussio
n
P
a
per
|
References
Bianchi, M., Marty, D., Teyssi ´e, J. L., and Fowler, S. W.: Strictly aerobic and anaerobic bacteria associated with sinking particulate matter and zooplankton fecal pellets, Mar. Ecol. Prog. Ser., 88, 55–60, 1992.
Braun, S. T., Proctor, L. M., Zani, S., Mellon, M. T., and Zehr, J. P.: Molecular evidence for
5
zooplankton-associated nitrogen-fixing anaerobes based on amplification on thenifHgene, FEMS Microbiol Ecol., 28(3), 273–279, 1999.
Brussaard, C. P. D.: Optimization of Procedures for Counting Viruses by Flow Cytometry, Appl. Environ. Microb., 70(3), 1506–1513, 2004.
Brussard, C. P. D., Marie, D., and Bratbak, G.: Flow cytometric detection of viruses, J. Virol.
10
Methods, 85, 175–182, 2000.
Cochran, P. K. and Paul, J. H.: Seasonal Abundance of Lysogenic Bacteria in a Subtropical Estuary, Appl. Environ. Microb., 64(6), 2308–2312, 1998.
Carbonel, C. A. A. H.: Modelling of upwelling–downwelling cycles caused by variable wind in a very sensitive coastal system, Cont. Shelf Res., 23, 1559–1578,
doi:10.1016/S0278-15
4343(03)00145-6, 2003.
Castelao, R. M. and Barth, J. A.: Upwelling around Cabo Frio, Brazil: The importance of wind stress curl, Geophys. Res. Lett., 33, L03602, doi:10.1029/2005GL025182, 2006.
Costanza, R., Norton, B. G., and Haskell, B. D. (Eds.): Ecosyst Health: New Goals for Environ-mental Management, Island Press, Washington, D.C., 1992.
20
Cotner, J. B. and Biddanda, B. A.: Small Players, Large Role: Microbial Influence on Biogeo-chemical Processes in Pelagic Aquatic Ecosystems, Ecosystems, 5, 105–121, 2002. Danovaro, R., Dell’Anno, A., Trucco, A., Serresi, M., and Vanucci, S.: Determination of Virus
Abundance in Marine Sediments, Appl. Environ. Microb., 3(67), 1384–1387, 2001.
Dubellar, B. J. and Greerders, P. J. F.: Innovative Technologies to Monitor Plankton Dynamics.
25
Scanning Flow Cytometry: A New Dimension in Real-Time, In-Situ Water Quality Monitoring, Sea Technol., 45(88), 15–21, 2004.
Dubellar, G. B. J., Venekamp, R. R., and Gerritzen, P. L.: Handsfree counting and classification of living cells and colonies, 6th Congress on Marine Sciences, Havana, Cuba, 2003.
Dubellar, G. B. J. and Gerritzen, P. L.: Cytobuoy: a step forward towards using flow cytometry
30
in operational oceanography, Sci. Mar., 64, 255–265, 2000.
BGD
7, 6243–6264, 2010Assessing the ecological status of
plankton in Anjos Bay
G. C. Pereira et al.
Title Page
Abstract Introduction
Conclusions References
Tables Figures
◭ ◮
◭ ◮
Back Close
Full Screen / Esc
Printer-friendly Version
Interactive Discussion
Discussion
P
a
per
|
Dis
cussion
P
a
per
|
Discussion
P
a
per
|
Discussio
n
P
a
per
|
www.spatialanalysisonline.com
Hansen, B. and Bech, G.: Bacteria associated with a marine planktonic copepod in culture, I., Bacterial genera in seawater, body surface, intestines and fecal pellets and succession during fecal pellet degradation, J. Plankton Res., 18(2), 257–273, 1996.
Jørgensen, S. E., Xu, F. L., Salas, F., and Marques, J. C.: Application of Indicators for the
5
Assessment of Ecosystem Health, in: Handbook of Ecological Indicators for Assessment of Ecosystem Health, edited by: Jorgensen, S. E., Costanza, R., and Xu, F. L., CRC Press, 5–64, 2005.
Karr, J. R.: Ecological Integrity. Protecting earth’s life support systems, in: Ecosystem Health, edited by: Costanza, R., Norton, B. G., and Haskell, B. D., Island Press, Washington, D.C.,
10
223–238, 1992.
Larsen, J. B., Larsen, A., Thyrhaug, R., Bratbak, G., and Sandaa, R.-A.: Response of marine viral populations to a nutrient induced phytoplankton bloom at differentpCO2levels, Biogeo-sciences, 5, 523–533, doi:10.5194/bg-5-523-2008, 2008.
Larsen A., Castberg, T., Sandaa, R.-A., Brussaard, C., Egge, J., Heldal, M., Paulino, A.,
15
Thyrhaug, R., van Hannen, E., and Bratbak, G.: Population dynamics and diversity of phy-toplankton, bacteria and virus in a seawater enclosure, Mar. Ecol. Prog. Ser., 221, 47–57, 2001.
Lebaron, P., Servais, P., Agogui ´e, H., Courties, C., and Joux, F.: Does the high nucleic acid content of individual bacterial cells allow us to discriminate between active cells and inactive
20
cells in aquatic systems? Appl. Environ. Microb., 67(4), 1775–1782, 2001.
Li, W. K. W.: Cytometric diversity in marine ultraphytoplankton, Limnol. Oceanogr., 42(5), 874– 880, 1995.
Luna, G. M., Manini, E., and Danovaro, R.: Large fraction of dead and inactive bacteria in coastal marine sediment: comparison of protocols for determination and ecological
signifi-25
cance, Appl. Environ. Microb., 68(7), 3509–3513, 2002.
Mart´ınez-Garc´ıa, S., Fern ´andez, E., Calvo-D´ıaz, A., Mara ˜n ´on, E., Mor ´an, X. A. G., and Teira, E.: Response of heterotrophic and autotrophic microbial plankton to inorganic and organic inputs along a latitudinal transect in the Atlantic Ocean, Biogeosciences, 7, 1701–1713, doi:10.5194/bg-7-1701-2010, 2010.
30
BGD
7, 6243–6264, 2010Assessing the ecological status of
plankton in Anjos Bay
G. C. Pereira et al.
Title Page
Abstract Introduction
Conclusions References
Tables Figures
◭ ◮
◭ ◮
Back Close
Full Screen / Esc
Printer-friendly Version
Interactive Discussion
Discussion
P
a
per
|
Dis
cussion
P
a
per
|
Discussion
P
a
per
|
Discussio
n
P
a
per
|
Møller, E. F.: Sloppy feeding in marine copepods: prey-size-dependent production of dissolved organic carbon, J. Plankton Res., 27(1), 27–35, 2005.
M ¨uller, F., Hoffmann-Kroll, R., and Wiggering, H.: Indicating ecosystem integrity – theoretical concepts and environmental requirements, Ecol. Model., 130, 13–23, 2000.
Pereira, G. C., Coutinho, R., and Ebecken, N. F. F.: Data Mining for environmental analysis
5
and diagnostic: a case study of upwelling ecosystem of Arraial do Cabo. Braz. J. Oceanogr., 56(1), 1–12, 2008.
Pereira, G. C. and Ebecken, N. F. F.: Knowledge discovering for coastal water classification, Expert Syst. Appl., 36, 8604–8609, 2009a.
Pereira, G. C., Evsukoff, A., and Ebecken, N. F. F.: Fuzzy modelling of chlorophyll production in
10
a Brazilian upwelling system, Ecol. Model., 220, 1506–1512, 2009b.
Pereira, G. C., Granato, A., Figueiredo, A. R., and Ebecken, N. F. F.: Virioplankton Abundance in Trophic Gradients of an Upwelling Field, Braz. J. Mirobiol., 40, 857–865, 2009c.
Rose, J. M., Caron, D. A., Sieracki, M. E., and Poulton, N.: Counting heterotrophic nanoplank-tonic protists in cultures and aquatic communities by flow cytometry, Aquat. Microb. Ecol.,
15
34, 263–277, 2004.
SCOR1996: Protocols for the Joint Global Ocean Flux Study (JGOFS) core measurements, Bergen, Norway: Scientific Committee on Ocean Research, International Council of Scien-tific Unions 9, 170.
Short, S. M. and Suttle, C. A.: Sequence Analysis of Marine Virus Communities Reveals that
20
Groups of Related Algal Viruses Are Widely Distributed in Nature, Appl. Environ. Microb., 68(3), 1290–1296, 2002.
Sosik, H. M. and Olson, R. J.: Automated taxonomic classification of phytoplankton sampled with imaging-in-flow cytometry, Limnol. Oceanogr. Methods, 5, 204–216, 2007.
Stenseth, N. C., Llope, M., Anad ´on, R., Ciannelli1, L., Chan, K. S., Hjermann1, D., Bagøien, E.,
25
and Ottersen, G.: Seasonal plankton dynamics along a cross-shelf gradient, Proc. R. Soc. B., 273, 2831–2838, doi:10.1098/rspb.2006.3658, 2006.
Suttle, C. A.: Viruses in the sea, Nature, 437, 356–361, 2005.
Thottathil, S. D., Balachandran, K. K., Gupta, G. V. M., Madhu, N. V., and Nair, S.: Influence of allochthonous input on autotrophiceheterotrophic switch-over in shallow waters of a tropical
30
estuary (Cochin Estuary), India, Estuar. Coast. Shelf S., 78, 551–562, 2008.
BGD
7, 6243–6264, 2010Assessing the ecological status of
plankton in Anjos Bay
G. C. Pereira et al.
Title Page
Abstract Introduction
Conclusions References
Tables Figures
◭ ◮
◭ ◮
Back Close
Full Screen / Esc
Printer-friendly Version
Interactive Discussion
Discussion
P
a
per
|
Dis
cussion
P
a
per
|
Discussion
P
a
per
|
Discussio
n
P
a
per
|
phytoplankton, Science, 326, 861–865, 2009.
Wiegner, T. N., Seitzinger, S. P., Breitburg, D. L., and Sanders, J. G.: The Effects of Multiple Stressors on the Balance between Autotrophic and Heterotrophic Processes in an Estuarine System, Estuaries, 26(2A), 352–364, 2003.
Windhorst, W., Colijn, F., Kabuta, S., Laane, R. P., and Lenhart, H. J.: Defining a good
eco-5
logical status of coastal waters – a case study for the Elbe plume, in: Managing European Coast, edited by: Vermaat, J. E., Bouwer, L., Turner, K., and Salomons, W., Springer Berlin, Heidelberg, 2005.
Yentsch, C. M., Horan, P. K., Muirhead, K. M., Haugen, H. E., Legendre, L., Murphy, M. J., Perry, D. A., Phinney, S. A., Pompini, R. W., Sinrad, W. M., Yentsch, C. S., and Zahuranec, B.
10
J.: Flow cytometry and cell sorting: a technique for analysis and sorting of aquatic particles, Limnol. Oceanogr., 28, 1275–1280, 1983.
Zubkov, M. V., Fuchs, B. D., Burkill, P. H., and Amann, R.: Comparison of cellular and biomass specific activities of dominant bacterioplankton groups in stratified waters of the Celtic sea, Appl. Environ. Microb., 67(11), 5210–5218, 2001.
BGD
7, 6243–6264, 2010Assessing the ecological status of
plankton in Anjos Bay
G. C. Pereira et al.
Title Page
Abstract Introduction
Conclusions References
Tables Figures
◭ ◮
◭ ◮
Back Close
Full Screen / Esc
Printer-friendly Version
Interactive Discussion
Discussion
P
a
per
|
Dis
cussion
P
a
per
|
Discussion
P
a
per
|
Discussio
n
P
a
per
|
Table 1. Spearman correlation of the variables: Temp refers to temperature as Sal to salinity, Virus to viruses, Het Prok to heterotrophic prokaryotes, Phyto is the total counts of autotrophs, VBR is the virus/bacterial ratio and Het/Aut is the heterotrophic/autotrophic ratio. Numbers in bold are statistically significant. Correlations are significant atp <,05000.
Temp Sal Virus Het Prok Chlo-a Phyto Larvae VBR Het/Aut
Temp 1.00 0.27 −0.58 0.02 −0.24 −0.04 0.04 −0.18 −0.60 Sal 1.00 0.03 −0.24 −0.29 −0.08 −0.09 0.36 −0.43 Virus 1.00 −0.31 0.02 −0.14 0.03 0.16 0.52 Het Prok 1.00 0.34 0.35 −0.32 −0.33 0.27
Chl-a 1.00 0.05 −0.28 −0.14 0.32
Phyto 1.00 −0.19 −0.18 0.31
Larvae 1.00 −0.10 0.04
VBR 1.00 −0.19
BGD
7, 6243–6264, 2010Assessing the ecological status of
plankton in Anjos Bay
G. C. Pereira et al.
Title Page
Abstract Introduction
Conclusions References
Tables Figures
◭ ◮
◭ ◮
Back Close
Full Screen / Esc
Printer-friendly Version
Interactive Discussion
Discussion
P
a
per
|
Dis
cussion
P
a
per
|
Discussion
P
a
per
|
Discussio
n
P
a
per
|
Fig. 1. Rio de Janeiro state and the Anjos Bay in Arraial do Cabo. 1 is a point of episodic
BGD
7, 6243–6264, 2010Assessing the ecological status of
plankton in Anjos Bay
G. C. Pereira et al.
Title Page
Abstract Introduction
Conclusions References
Tables Figures
◭ ◮
◭ ◮
Back Close
Full Screen / Esc
Printer-friendly Version
Interactive Discussion
Discussion
P
a
per
|
Dis
cussion
P
a
per
|
Discussion
P
a
per
|
Discussio
n
P
a
per
|
Fig. 2. Representative real time cytograms of CytoBuoy flow cytometry. In(a)all suspended
BGD
7, 6243–6264, 2010Assessing the ecological status of
plankton in Anjos Bay
G. C. Pereira et al.
Title Page
Abstract Introduction
Conclusions References
Tables Figures
◭ ◮
◭ ◮
Back Close
Full Screen / Esc
Printer-friendly Version
Interactive Discussion
Discussion
P
a
per
|
Dis
cussion
P
a
per
|
Discussion
P
a
per
|
Discussio
n
P
a
per
|
Fig. 3. One of the FACScan cytograms of upwelled waters after SYBR Green I nucleic acid
BGD
7, 6243–6264, 2010Assessing the ecological status of
plankton in Anjos Bay
G. C. Pereira et al.
Title Page Abstract Introduction Conclusions References Tables Figures ◭ ◮ ◭ ◮ Back Close
Full Screen / Esc
Printer-friendly Version Interactive Discussion Discussion P a per | Dis cussion P a per | Discussion P a per | Discussio n P a per | 0,00 5,00 10,00 15,00 20,00 25,00 30,00 29/0 8/06 03/1 0/06 17/1 0/06 31/1 0/06 13/1 1/06 28/1 1/06 12/1 2/06 26/1 2/06 09/0 1/07 23/0 1/07 13/0 2/07 27/0 2/07 12/0 3/07 03/0 4/07 17/0 4/07 15/0 5 /07
29/0 5/07
14/0 6 /07
11/0 7/07 T e m p e ra tu re oC 0,E+00 5,E+03 1,E+04 2,E+04 2,E+04 3,E+04 H e te ro tr o p h ic /A u to tr o p h ic r a ti o Temp Het/Aut 1,E+05 5,E+06 1,E+07 2,E+07 2,E+07 3,E+07 3,E+07 29/0 8/06 03/1 0/06 17/1 0/06 31/1 0/06 13/1 1/06 28/1 1/06 12/1 2/06 26/1 2/06 09/0 1/07 23/0 1/07 13/0 2/07 27/0 2/07 12/0 3/07 03/0 4/07 17/0 4/07 15/0 5/07 29/0 5/07 14/0 6/07 11/0 7/07 T o ta l V ir u s e s 0,E+00 5,E+03 1,E+04 2,E+04 2,E+04 3,E+04 H e te ro tr o p h ic /a u to tr o p h ic r a ti o Total Virus Het/Aut 0,E+00 2,E+05 4,E+05 6,E+05 8,E+05 1,E+06 1,E+06 29/0 8/06 03/1 0/06 17/1 0/06 31/1 0/06 13/1 1/06 28/1 1/06 12/1 2/06 26/1 2/06 09/0 1/07 23/0 1/07 13/0 2/07 27/0 2/07 12/0 3/07 03/0 4/07 17/0 4/07 15/0 5/07 29/0 5/07 14/0 6/07 11/0 7/07 H e te ro tr o p h ic p ro k a ry o te s 0 200 400 600 800 1000 1200 M e ro p la n k to n l a rv a e Het Prok Larvae Spring-summer 0,00 5,00 10,00 15,00 20,00 25,00 30,00 29/0 8/06 03/1 0/06 17/1 0/06 31/1 0/06 13/1 1/06 28/1 1/06 12/1 2/06 26/1 2/06 09/0 1/07 23/0 1/07 13/0 2/07 27/0 2/07 12/0 3/07 03/0 4/07 17/0 4/07 15/0 5 /07
29/0 5/07
14/0 6 /07
11/0 7/07 T e m p e ra tu re oC 0,E+00 5,E+03 1,E+04 2,E+04 2,E+04 3,E+04 H e te ro tr o p h ic /A u to tr o p h ic r a ti o Temp Het/Aut 1,E+05 5,E+06 1,E+07 2,E+07 2,E+07 3,E+07 3,E+07 29/0 8/06 03/1 0/06 17/1 0/06 31/1 0/06 13/1 1/06 28/1 1/06 12/1 2/06 26/1 2/06 09/0 1/07 23/0 1/07 13/0 2/07 27/0 2/07 12/0 3/07 03/0 4/07 17/0 4/07 15/0 5/07 29/0 5/07 14/0 6/07 11/0 7/07 T o ta l V ir u s e s 0,E+00 5,E+03 1,E+04 2,E+04 2,E+04 3,E+04 H e te ro tr o p h ic /a u to tr o p h ic r a ti o Total Virus Het/Aut 0,E+00 2,E+05 4,E+05 6,E+05 8,E+05 1,E+06 1,E+06 29/0 8/06 03/1 0/06 17/1 0/06 31/1 0/06 13/1 1/06 28/1 1/06 12/1 2/06 26/1 2/06 09/0 1/07 23/0 1/07 13/0 2/07 27/0 2/07 12/0 3/07 03/0 4/07 17/0 4/07 15/0 5/07 29/0 5/07 14/0 6/07 11/0 7/07 H e te ro tr o p h ic p ro k a ry o te s 0 200 400 600 800 1000 1200 M e ro p la n k to n l a rv a e Het Prok Larvae Spring-summer a b c 0,00 5,00 10,00 15,00 20,00 25,00 30,00 29/0 8/06 03/1 0/06 17/1 0/06 31/1 0/06 13/1 1/06 28/1 1/06 12/1 2/06 26/1 2/06 09/0 1/07 23/0 1/07 13/0 2/07 27/0 2/07 12/0 3/07 03/0 4/07 17/0 4/07 15/0 5 /07
29/0 5/07
14/0 6 /07
11/0 7/07 T e m p e ra tu re oC 0,E+00 5,E+03 1,E+04 2,E+04 2,E+04 3,E+04 H e te ro tr o p h ic /A u to tr o p h ic r a ti o Temp Het/Aut 1,E+05 5,E+06 1,E+07 2,E+07 2,E+07 3,E+07 3,E+07 29/0 8/06 03/1 0/06 17/1 0/06 31/1 0/06 13/1 1/06 28/1 1/06 12/1 2/06 26/1 2/06 09/0 1/07 23/0 1/07 13/0 2/07 27/0 2/07 12/0 3/07 03/0 4/07 17/0 4/07 15/0 5/07 29/0 5/07 14/0 6/07 11/0 7/07 T o ta l V ir u s e s 0,E+00 5,E+03 1,E+04 2,E+04 2,E+04 3,E+04 H e te ro tr o p h ic /a u to tr o p h ic r a ti o Total Virus Het/Aut 0,E+00 2,E+05 4,E+05 6,E+05 8,E+05 1,E+06 1,E+06 29/0 8/06 03/1 0/06 17/1 0/06 31/1 0/06 13/1 1/06 28/1 1/06 12/1 2/06 26/1 2/06 09/0 1/07 23/0 1/07 13/0 2/07 27/0 2/07 12/0 3/07 03/0 4/07 17/0 4/07 15/0 5/07 29/0 5/07 14/0 6/07 11/0 7/07 H e te ro tr o p h ic p ro k a ry o te s 0 200 400 600 800 1000 1200 M e ro p la n k to n l a rv a e Het Prok Larvae Spring-summer 0,00 5,00 10,00 15,00 20,00 25,00 30,00 29/0 8/06 03/1 0/06 17/1 0/06 31/1 0/06 13/1 1/06 28/1 1/06 12/1 2/06 26/1 2/06 09/0 1/07 23/0 1/07 13/0 2/07 27/0 2/07 12/0 3/07 03/0 4/07 17/0 4/07 15/0 5 /07
29/0 5/07
14/0 6 /07
11/0 7/07 T e m p e ra tu re oC 0,E+00 5,E+03 1,E+04 2,E+04 2,E+04 3,E+04 H e te ro tr o p h ic /A u to tr o p h ic r a ti o Temp Het/Aut 1,E+05 5,E+06 1,E+07 2,E+07 2,E+07 3,E+07 3,E+07 29/0 8/06 03/1 0/06 17/1 0/06 31/1 0/06 13/1 1/06 28/1 1/06 12/1 2/06 26/1 2/06 09/0 1/07 23/0 1/07 13/0 2/07 27/0 2/07 12/0 3/07 03/0 4/07 17/0 4/07 15/0 5/07 29/0 5/07 14/0 6/07 11/0 7/07 T o ta l V ir u s e s 0,E+00 5,E+03 1,E+04 2,E+04 2,E+04 3,E+04 H e te ro tr o p h ic /a u to tr o p h ic r a ti o Total Virus Het/Aut 0,E+00 2,E+05 4,E+05 6,E+05 8,E+05 1,E+06 1,E+06 29/0 8/06 03/1 0/06 17/1 0/06 31/1 0/06 13/1 1/06 28/1 1/06 12/1 2/06 26/1 2/06 09/0 1/07 23/0 1/07 13/0 2/07 27/0 2/07 12/0 3/07 03/0 4/07 17/0 4/07 15/0 5/07 29/0 5/07 14/0 6/07 11/0 7/07 H e te ro tr o p h ic p ro k a ry o te s 0 200 400 600 800 1000 1200 M e ro p la n k to n l a rv a e Het Prok Larvae Spring-summer a b c
BGD
7, 6243–6264, 2010Assessing the ecological status of
plankton in Anjos Bay
G. C. Pereira et al.
Title Page
Abstract Introduction
Conclusions References
Tables Figures
◭ ◮
◭ ◮
Back Close
Full Screen / Esc
Printer-friendly Version
Interactive Discussion
Discussion
P
a
per
|
Dis
cussion
P
a
per
|
Discussion
P
a
per
|
Discussio
n
P
a
per
|
a b c
d e
a b c
d e
Fig. 5. Spatial distribution of the studied variables measured by flow cytometry within the