RESEARCH ARTICLE
Correlates of Self-Reported Sleep Duration in
Middle-Aged and Elderly Koreans: from the
Health Examinees Study
Hyung-Suk Yoon1,2,3, Jae Jeong Yang2,3, Minkyo Song1,2,3, Hwi-Won Lee1,2, Sohee Han2,3, Sang-Ah Lee4, Ji-Yeob Choi1,2,5, Jong-koo Lee6,7, Daehee Kang1,2,3,5
*
1Department of Biomedical Sciences, Seoul National University Graduate School, Seoul, Korea,
2Department of Preventive Medicine, Seoul National University College of Medicine, Seoul, Korea,
3Institute of Environmental Medicine, Seoul National University Medical Research Center, Seoul, Korea,
4Department of Preventive Medicine, Kangwon National University, Kangwon-do, Korea,5Cancer Research Institute, Seoul National University, Seoul, Korea,6JW Lee Center for Global Medicine, Seoul National University College of Medicine, Seoul, Korea,7Department of Family Medicine, Seoul National University College of Medicine, Seoul, Korea
Abstract
Though various factors related to fluctuations in sleep duration have been identified, infor-mation remains limited regarding the correlates of short and long sleep duration among the Korean population. Thus, we investigated characteristics that could be associated with short and/or long sleep duration among middle-aged and elderly Koreans. A total of 84,094 subjects (27,717 men and 56,377 women) who participated in the Health Examinees Study were analyzed by using multinomial logistic regression models. To evaluate whether socio-demographic factors, lifestyle factors, psychological conditions, anthropometry results, and health conditions were associated with short and/or long sleep duration, odds ratios (ORs) and 95% confidence intervals (CIs) were estimated with sleep duration of 6–7 hours as the reference group, accounting for putative covariates. Regardless of sexual differences, we found that adverse behaviors and lifestyle factors including low educational attainment, un-employment, being unmarried, current smoking status, lack of exercise, having irregular meals, poor psychosocial well-being, frequent stress events, and poor self-rated health were significantly associated with abnormal sleep duration. Similarly, diabetes mellitus and depression showed positive associations with abnormal sleep duration in both men and women. Our findings suggest that low sociodemographic characteristics, adverse lifestyle factors, poor psychological conditions, and certain disease morbidities could be associated with abnormal sleep duration in middle-aged and elderly Koreans.
Introduction
Sleep is indispensable to human survival. Evidence suggests that sleep imbalance, such as depri-vation and/or fluctuations in usual sleep episodes, is significantly associated with diminished
PLOS ONE | DOI:10.1371/journal.pone.0123510 May 1, 2015 1 / 22
OPEN ACCESS
Citation:Yoon H-S, Yang JJ, Song M, Lee H-W, Han S, Lee S-A, et al. (2015) Correlates of Self-Reported Sleep Duration in Middle-Aged and Elderly Koreans: from the Health Examinees Study. PLoS ONE 10(5): e0123510. doi:10.1371/journal.pone.0123510
Academic Editor:Ignacio Correa-Velez, Queensland University of Technology, AUSTRALIA
Received:May 20, 2014
Accepted:March 4, 2015
Published:May 1, 2015
Copyright:© 2015 Yoon et al. This is an open access article distributed under the terms of the
Creative Commons Attribution License, which permits unrestricted use, distribution, and reproduction in any medium, provided the original author and source are credited.
Data Availability Statement:All relevant data are within the paper and its Supporting Information files.
Funding:The authors have no support or funding to report.
quality of life [1] while influencing adverse physical and psychological health outcomes [2–4]. Studies have reported that short (generally less than 6 hours per day) or long (generally more than 8–9 hours per day) sleep duration is related to an increased risk of chronic diseases such as obesity [5,6], hypertension [7], diabetes [8,9], and metabolic syndrome [10–12]. Furthermore, sleep imbalance is supposed to result in higher mortality rates across the lifespan [13–16].
Inadequate sleep duration is assumed to be detrimental to a person’s health and well-being. To prevent the potential harm linked to inadequate sleep duration, factors highly correlated with abnormal sleep duration should be investigated. Recently in epidemiology significant at-tention has been paid to how adverse patterns are induced during usual sleep episodes; thus, re-search examining the social and individual correlates of sleep duration continues to
accumulate. Previous studies have indicated that individual characteristics, such as eating pat-terns [17], physical activity [18], socioeconomic status [19,20] and smoking habits [21], might be meaningful correlates of short or long sleep duration. Nevertheless, given that sleep patterns appear to be the result of complex interactions between sociocultural and individual factors [3], there is still need for studies exploring the effects of diverse contexts on sleep duration.
Evidence of the potential correlates of sleep duration has been reported, but little informa-tion exists for the Korean populainforma-tion. How adverse patterns are induced during usual sleep epi-sodes in Koreans may provide valuable clues to understanding various cross-cultural aspects of sleep episodes, because sociocultural patterns that have occurred in both developed and devel-oping countries have coexisted in Korea due to the rapid economic growth. In the present study, we conducted a cross-sectional analysis based on data from a large-scale cohort study in Korea in order to identify the sex-specific putative correlates of short or long sleep duration.
Materials and Methods
Ethical statements
This study is based on a large-scale genomic cohort study—the Health Examinees (HEXA) Study—which was approved by the Ethics Committee of the Korean Health and Genomic Study of the Korean National Institute of Health and the institutional review boards of all par-ticipating hospitals. Following a standardized study protocol, all study participants were pro-spectively recruited and voluntarily signed an informed consent form before entering the study.
The HEXA Study
The HEXA study was launched to investigate the risk factors regarding epidemiological charac-teristics, genomic features, and gene-environment interactions for major chronic diseases in the Korean population. Between 2004 and 2008, a total of 85,323 participants aged 40–69 were recruited from health examination centers and training hospitals across the country. Brief in-formation on the study protocol is summarized as follows: (1) all participants voluntarily signed an informed consent form before entering the study; (2) a survey using detailed, inter-view-based questionnaires was conducted to collect information on individual characteristics, including demographics, disease history, current medication use, lifetime consumption of to-bacco and alcohol, dietary habits, physical activity, and reproductive history; (3) physical ex-aminations covering anthropometric indices (height, weight, waist circumference (WC), body mass index (BMI), and body compositions) and measurement of blood pressure were per-formed by skilled medical staff; (4) biological samples (plasma, serum, buffy coat, blood cell, DNA, and urine) were collected and stored under stable conditions; and (5) laboratory analy-ses, such as liver function tests, lipid profiles, blood panels, and others were also conducted. Based on the unique health insurance system in Korea, the HEXA study enables repeated
Correlates of Sleep Duration
measurements on a nationwide scale; thus, this study can assess chronological changes in health status within the Korean population.
Analytic study population
Among a total of 85,323 subjects aged 40–69 who had participated in the HEXA study, subjects who did not provide information on sleep duration (N = 1,229) were excluded from the present study. Thus, a total of 84,094 subjects including 27,717 men and 56,377 women were included in the final analysis.
Assessment of sleep duration
As a measure of sleep quantity, sleep duration was elicited by posing the close-ended question,
“On average, how many hours of sleep did you get per day during the past year (including nap times)?”Four response categories were given:<6 hours, 6–7 hours, 8–9 hours, and10 hours. Using‘6–7 hours’(a normal sleep duration) as the reference point, other groups were assumed to represent the following:‘less than 6 hours’were short sleepers,‘8–9 hours’were moderately long sleepers, and‘10 hours or more’were long sleepers.
Classification of variables
Characteristics that might be related to sleep duration were selected within five domains: socio-demographic factors (i.e., age, educational attainment, occupational classification, marital sta-tus, and menopausal status for women only), lifestyle factors (i.e., smoking status, alcohol consumption, eating habits, multi-vitamin intake, and physical activity), psychological condi-tions (i.e., psychosocial well-being status, stress events, and self-reported health status), and an-thropometry results (i.e., BMI and WC).
Sociodemographic factors. Age was categorized into three groups: forties (40–49 years old), fifties (50–59 years old), and sixties (60–69 years old). Educational attainment was classi-fied into three categories: middle school or below (i.e., no schooling, dropped out of elementary school, graduated elementary school or dropped out of middle school, and graduated middle school or dropped out of high school), high school graduate (i.e., graduated high school or technical/professional institution and dropped out of university), and college or above (i.e., graduated university or graduate school and above). Occupational status was classified accord-ing to major professions based on the Korean Standard Classification of Occupations (KSCO) derived from the International Standard Classification of Occupations (ISCO). Hierarchical oc-cupational categories were classified into three groups: non-manual (i.e., legislators, senior offi-cials and managers, professionals and related workers, clerks), manual (i.e., service and sale workers, skilled agricultural, forestry and fishery workers, craft and related trades workers, plant-machine operators/assemblers, and elementary occupations), and unemployed which in-cluded housewives. Marital status was defined as married or single, the latter including subjects who never married or were separated, divorced, and bereaved. Menopausal status was defined as postmenopausal women who have gone a year with no flow or premenopausal women who still experienced menstrual cycles.
Lifestyle factors. Smoking status was ascertained by posing the following question:“Have you smoked more than 20 packs of cigarettes (400 cigarettes) in your lifetime?”People who smoked a minimum of 400 cigarettes during their lifetime and continued to smoke were classi-fied as current smokers; non-smokers who had never smoked in their lifetime and quitters were both classified as non-current smokers. Drinking status was also divided into two catego-ries: current drinkers and non-current drinkers. Usual eating habits were determined by how many meals a subject had per day and were classified into two groups, having three meals a day
Correlates of Sleep Duration
vs. having irregular meals. Multi-vitamin users were defined as those who had been taking a multi-vitamin supplement more than once per week for the purpose of nutritional and/or health improvement; all others were regarded as non-users. Physical activity was assessed by posing the following question:“Do you do any sports regularly until you sweat?”Subjects who responded“yes”to the question were assigned to the regular exercise group; the respondents who answered“no”were assigned to the non-regular exercise group.
Psychological conditions. The Psychosocial Well-Being Index (PWI), which was modi-fied from the General Health Questionnaire score for Koreans, was used to evaluate respon-dents’mental health and it has been validated in a large community sample in Korea (Cronbach’sα= .92) [22]. The PWI questionnaire is an 18-item scale designed to evaluate socio-psychological distress symptoms experienced using a four-point response scale (score of 0 = none of the time; score of 3 = all the time). Scores range from 0 to 54, with higher scores in-dicating higher distress symptoms. Generally, stress levels are categorized into three groups: positive well-being group (PWI8), moderate distress group (PWI 9–26), and severe distress group (PWI27). Stress events were addressed with the following question:“Have you ever felt stressed that was physically or mentally unbearable during the past month?”Response cate-gories included, not at all, often, and a lot of the time. Self-reported health status was addressed with the following question:“Which statement corresponds to your current health status?”
The five response choices were summarized into three categories: healthy (very healthy and healthy), normal, and unhealthy (unhealthy and very unhealthy).
Anthropometry. Anthropometric data on height and weight was used to calculate BMI as the Quetelet’s index (kg/m2). BMI was split into sex-specific quartiles as follows: Q122.6, 22.6<Q224.4, 24.4<Q326.1, and 26.1<Q4 in men; and Q121.8,
21.8<Q223.5, 23.5<Q325.5, 25.5<Q4 in women. In the same vein, WC (cm) was
also classified into quartile groups according to sex distribution: Q181.3, 81.3<Q286.0, 86.0<Q391.0, and 91.0<Q4 in men; and Q173.5, 73.5<Q279.0,
79.0<Q384.3, 84.3<Q4 in women.
Health conditions. The HEXA questionnaire covered personal medical history and cur-rent medication use for diverse diseases. In the present study, a total of 21 diseases (i.e., pulmo-nary tuberculosis, acute liver disease, chronic liver disease, cancer, diabetes mellitus, thyroid disease, hyperlipidemia, depression, cataracts, hypertension, myocardial infarction, stroke, asthma/chronic bronchitis, cholelithiasis, fatty liver disease, gastritis, intestinal polyps, peptic ulcers, arthritis, osteoporosis, and bladder infection) were evaluated. Each disease status was defined by responses to two separate questions:“Have you ever been diagnosed one of the fol-lowing diseases by a doctor in a hospital?”and“Are you currently undergoing any treatment for the disease?”Current health conditions were summarized into currently getting treatment
vs. no treatment (i.e., never diagnosed, completely cured, and receiving no more medication).
Statistical analysis
To ensure sex-specific differences across the whole analytic study population, baseline charac-teristics regarding sociodemographic factors, lifestyle, psychological conditions, anthropome-try results, and health conditions were first compared according to sex strata. After confirming the statistical significance of sex differences, all analyses were stratified by sex to determine sex-specific effects on the association between putative correlates and sleep duration (S1andS2 Ta-bles). Selected characteristics for the five domains across sleep duration (<6 hours, 6–7 hours,
8–9 hours, and10 hours) were compared by using chi-square test for categorical variables and analysis of variance (ANOVA) for continuous variables. All results yielding ap-value less than 0.05 were considered statistically significant.
Correlates of Sleep Duration
Multinomial logistic regression analyses were used to identify the correlates that were signif-icantly associated with short and/or long sleep duration. Along with 6–7 hours of sleep as the comparison group, odds ratios (ORs) and 95% confidence intervals (CIs) were calculated. In all multinomial analyses, the associations with sleep duration were adjusted for all other putative correlates in four domains including sociodemographic factors, lifestyle factors, psychological conditions, and anthropometry results. Correlates included in the fully adjusted models were as follows: age (‘40–49’,‘50–59’, and‘60–69’years), educational attainment (‘college degree or higher’,‘high school graduate’, and‘middle school or below’), occupational classification (‘non-manual’,‘manual’, and‘unemployed or housewives’), marital status (‘married’and‘ sin-gle’), menopausal status (‘premenopausal’and‘postmenopausal’), smoking status (‘ non-cur-rent smokers’and‘current smokers’), alcohol consumption (‘non-current drinkers’and
‘current drinkers’), eating habits (‘having three meals a day’and‘having irregular meals’), multi vitamin intake (‘multi-vitamin users’and‘non-users’), physical activity (‘regular exercis-ers’and‘non-exercisers’), PWI status (‘positive wellbeing’,‘moderate distress’, and‘severe dis-tress’), stress events (‘not at all’,‘often’, and‘frequent’), self-reported health status (‘healthy’,
‘normal’, and‘unhealthy’), BMI (quartile groups by sex strata), and WC (quartile groups by sex strata). To determine whether the variables were inter-correlated in the models, variance infla-tion factors (VIFs) for multicollinearity were also computed. After confirming that no multi-collinearity was detected (VIFs<2.0; data not shown), multinomial logistic regression
analyses were carried out and nominalp-values were estimated. Additionally, considering the multiple hypothesis testing in the present study, the False Discovery Rate (FDR) controlling method was used to adjust spurious association with false positive results. Based on the Benja-mini—Hochberg’s method,p-values were corrected for multiple comparisons.
Finally, sensitivity analyses were conducted to ensure robustness of the results. Using the three-phase approach to rule out the residual effects of medication use on usual sleep duration, we conducted sensitivity analyses as follows: 1) subjects who were currently taking medication for the diseases that had exhibited a significant association with sleep duration in a univariate analysis, regardless of sex, were excluded from the primary analysis; 2) considering sex-specific associations between medication use and sleep duration, diseases were differently selected by sex strata in univariate analyses and subjects on the medications were excluded accordingly; and 3) subjects who were currently taking any medications for 21 selected diseases above men-tioned were wholly excluded from the primary analysis.
All statistical analyses were performed using SAS software version 9.3 (SAS Institute, Cary, North Carolina).
Results
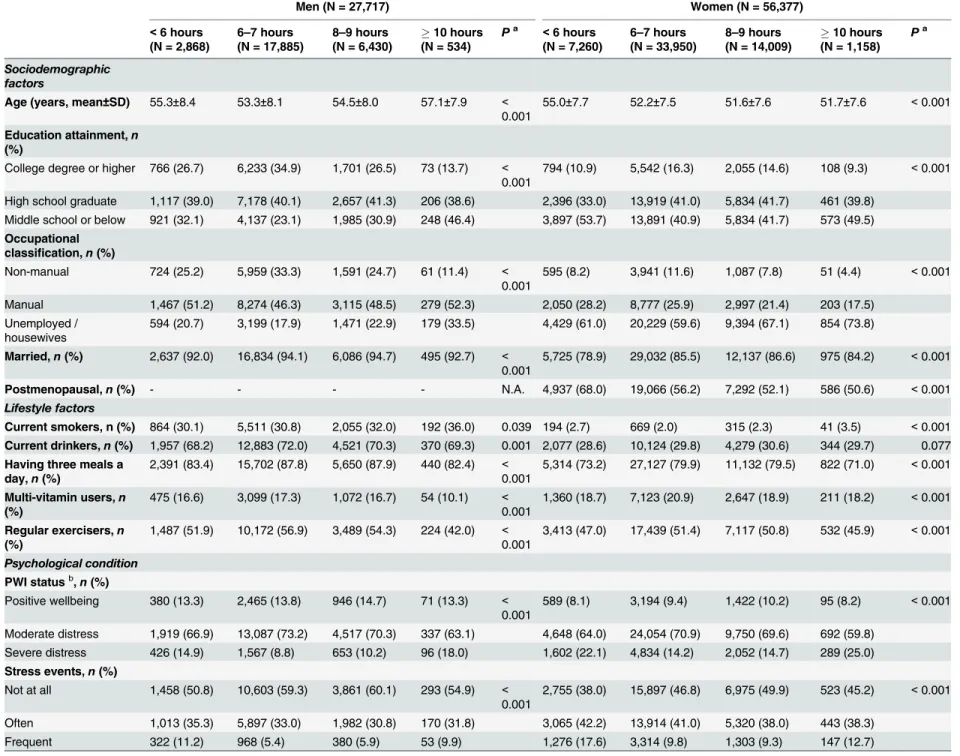
Baseline characteristics regarding sleep duration, sociodemographic factors, lifestyle, psycho-logical conditions, anthropometry results, and disease-related treatment status are summa-rized inS1andS2Tables. Approximately 65% of men and 60% of women reported a normal sleep duration (6–7 hours); but short or long sleep durations appeared to be fairly common; among men, the proportion of short (<6 hours) and long sleepers (10 hours) were 10.4% and 1.9%, respectively; among women, there was a relatively greater proportion of short and long sleepers (12.9% and 2.0%, respectively); the mean age of men was 53.9 years and for women 52.4 years; higher proportions of subjects with a college degree or higher, non-manual occupation, current smokers, current drinkers, and regular exercisers were observed among men (p<0.001); while women appeared to have poorer psychological conditions compared
to men (p<0.001,S1 Table). Prevalence of currently receiving treatment of chronic liver
dis-eases, diabetes mellitus, hypertension, and fatty liver diseases was significantly higher among Correlates of Sleep Duration
men; while those of thyroid diseases, depression, and arthritis were significantly higher among women (p<0.001,S2 Table).
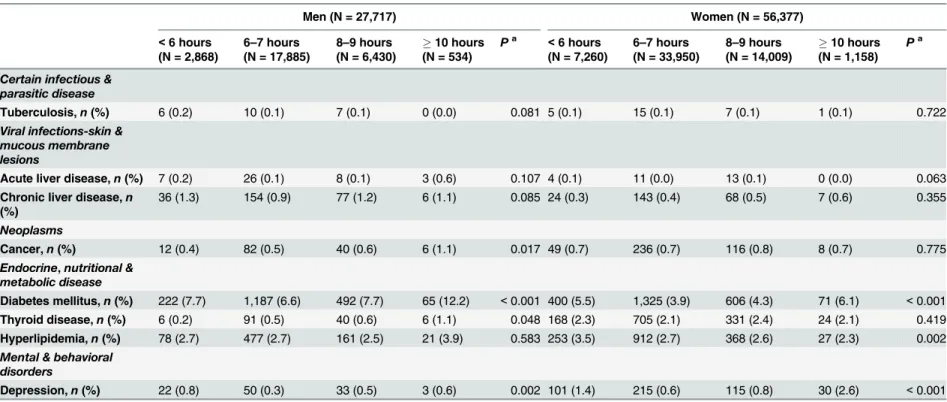
Distributions of the selected correlates across categories of sleep duration are presented in Ta-bles1and2. Age was inversely correlated with sleep duration for both sexes. Higher proportions of subjects with the lowest education attainment, severe distress, frequent stress events, and self-reported unhealthy status were observed in short and long sleep duration regardless of sex. Cur-rent smokers were more frequent in both men and women who slept more than 10 hours per day (Table 1). Subjects who were currently taking medications for diabetes mellitus, depression, hypertension, stroke, peptic ulcer, and arthritis exhibited a significant association with sleep du-ration regardless of sex. Treatments for cancer and thyroid disease were significantly associated with sleep duration among men; for women, significant associations with sleep duration were observed in medication use on hyperlipidemia, cataract, myocardial infarction, asthma/chronic bronchitis, fatty liver disease, gastritis, osteoporosis, and bladder infection (Table 2).
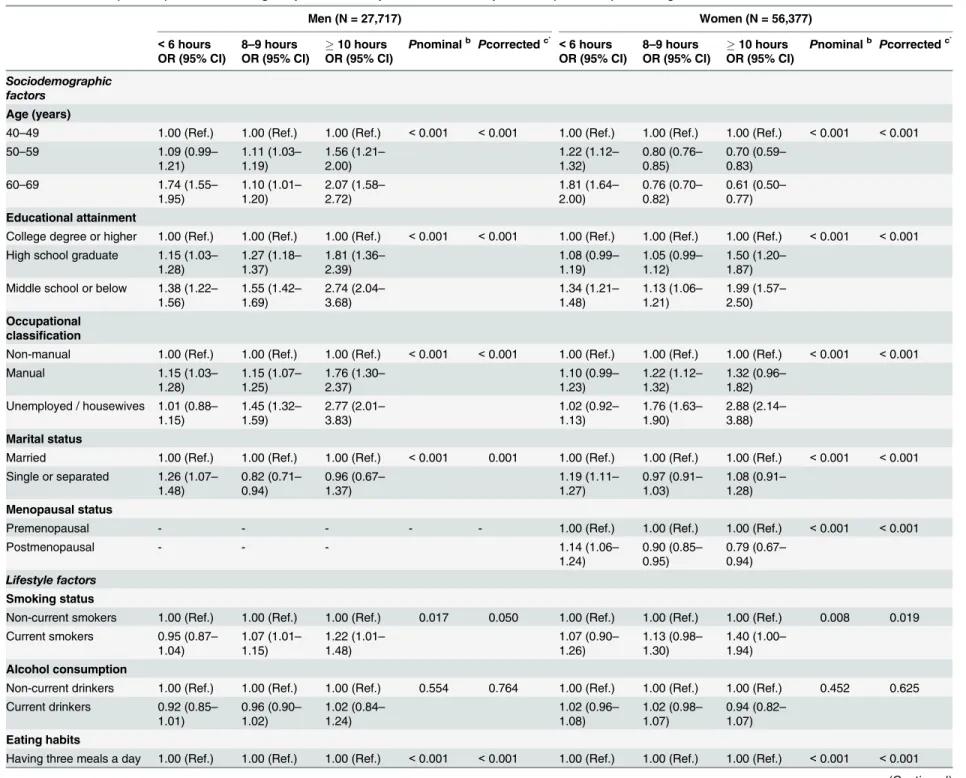
After considering the putative effects of habitual characteristics, several correlates were se-lected as having a significant, direct association with both short and long sleep duration among men (represented by ORs): being older (OR = 1.74, 95% CI = 1.55–1.95 and OR = 2.07, 95% CI = 1.58–2.72, respectively), having the lowest education attainment (OR = 1.38, 95% CI = 1.22–1.56 and OR = 2.74, 95% CI = 2.04–3.68, respectively), having a manual job
(OR = 1.15, 95% CI = 1.03–1.28 and OR = 1.76, 95% CI = 1.30–2.37, respectively), having irreg-ular meals (OR = 1.41, 95% CI = 1.26–1.58 and OR = 1.57, 95% CI = 1.24–2.00, respectively), being a non-exerciser (OR = 1.09, 95% CI = 1.00–1.18 and OR = 1.48, 95% CI = 1.23–1.78, re-spectively), and having poor self-reported health (OR = 1.28, 95% CI = 1.12–1.45 and
OR = 1.61, 95% CI = 1.24–2.09, respectively). Among women, both short and long sleep dura-tion were associated with having the lowest educadura-tion attainment (OR = 1.34, 95% CI = 1.21–
1.48 and OR = 1.99, 95% CI = 1.57–2.50, respectively), having irregular meals (OR = 1.50, 95% CI = 1.41–1.59 and OR = 1.59, 95% CI = 1.39–1.82, respectively), severe distress based on PWI status (OR = 1.18, 95% CI = 1.05–1.32 and OR = 1.40, 95% CI = 1.08–1.83, respectively), and poor self-rated health (OR = 1.38, 95% CI = 1.28–1.50 and OR = 1.46, 95% CI = 1.22–1.74, re-spectively). Interestingly, compared to middle-aged women, elderly women showed a 1.81-fold increase in the odds for short sleep (95% CI = 1.64–2.00) but approximately 40% decrease in the odds for long sleep duration (OR = 0.61, 95% CI = 0.50–0.77;Table 3).
Single correlates for short or long sleep duration among men were as follows: being single (OR = 1.26, 95% CI = 1.07–1.48), having severe distress based on PWI status (OR = 1.24, 95% CI = 1.04–1.48), having frequent stress events (OR = 1.84, 95% CI = 1.58–2.13) and being in the highest BMI quartile group (OR = 1.32, 95% CI = 1.15–1.51) raised the odds of having short sleep duration. In contrast, being unemployed (OR = 2.77, 95% CI = 2.01–3.83), being a current smoker (OR = 1.22, 95% CI = 1.01–1.48), consuming multi-vitamins (OR = 1.53, 95% CI = 1.14–2.04), and being in the highest viscerally obese group (OR = 1.66, 95% CI = 1.23–
2.23) raised the odds of having long sleep duration. Most of the selected correlates for short or long sleep duration among men were reproduced in women: being single (OR = 1.19, 95% CI = 1.11–1.27), frequent stress events (OR = 1.59, 95% CI = 1.46–1.73), and being in the high-est BMI quartile group (OR = 1.09, 95% CI = 1.00–1.19) raised the odds of having short sleep duration, whereas being unemployed or housewives (OR = 2.88, 95% CI = 2.14–3.88), being a current smoker (OR = 1.40, 95% CI = 1.00–1.94), and not exercising (OR = 1.26, 95% CI = 1.11–1.42) raised the odds of having long sleep duration. Postmenopausal status was in-versely correlated with sleep duration (OR = 1.14, 95% CI = 1.06–1.24 for short sleep and OR = 0.79, 95% CI = 0.67–0.94 for long sleep;Table 3).
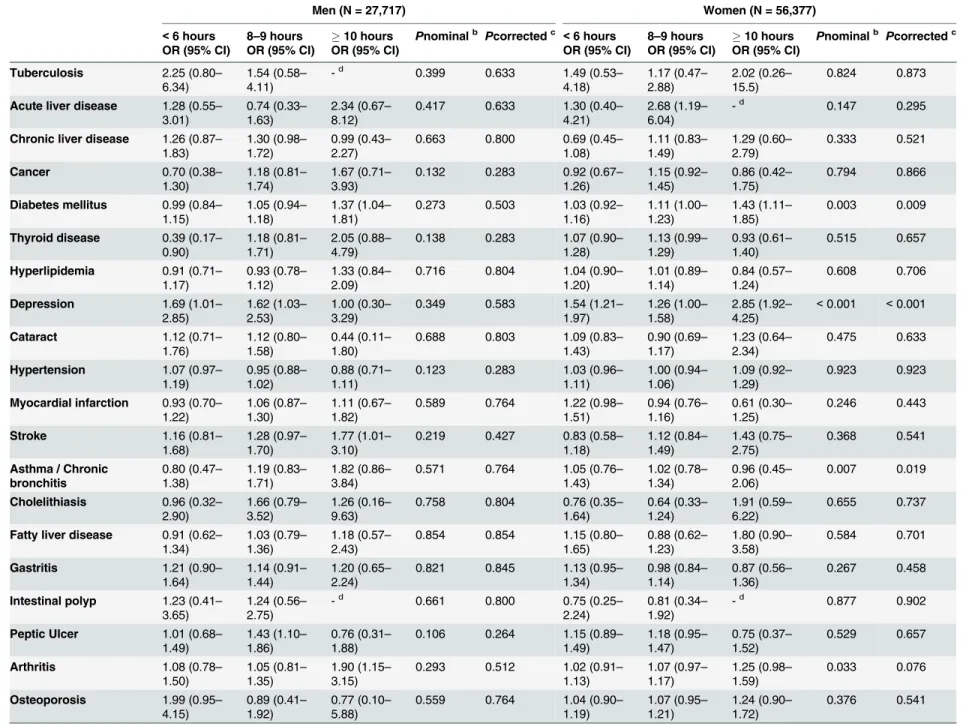
Those currently receiving treatment for diabetes had significantly increased odds of having long sleep duration, regardless of sex (OR = 1.37, 95% CI = 1.04–1.81 for men and OR = 1.43,
Correlates of Sleep Duration
Table 1. Basic characteristics of the study population across categories of sleep duration.
Men (N = 27,717) Women (N = 56,377)
<6 hours (N = 2,868)
6–7 hours
(N = 17,885)
8–9 hours
(N = 6,430)
10 hours (N = 534)
Pa
<6 hours (N = 7,260)
6–7 hours
(N = 33,950)
8–9 hours
(N = 14,009)
10 hours (N = 1,158)
Pa
Sociodemographic factors
Age (years, mean±SD) 55.3±8.4 53.3±8.1 54.5±8.0 57.1±7.9 <
0.001
55.0±7.7 52.2±7.5 51.6±7.6 51.7±7.6 <0.001
Education attainment,n (%)
College degree or higher 766 (26.7) 6,233 (34.9) 1,701 (26.5) 73 (13.7) <
0.001
794 (10.9) 5,542 (16.3) 2,055 (14.6) 108 (9.3) <0.001
High school graduate 1,117 (39.0) 7,178 (40.1) 2,657 (41.3) 206 (38.6) 2,396 (33.0) 13,919 (41.0) 5,834 (41.7) 461 (39.8) Middle school or below 921 (32.1) 4,137 (23.1) 1,985 (30.9) 248 (46.4) 3,897 (53.7) 13,891 (40.9) 5,834 (41.7) 573 (49.5) Occupational
classification,n(%)
Non-manual 724 (25.2) 5,959 (33.3) 1,591 (24.7) 61 (11.4) <
0.001
595 (8.2) 3,941 (11.6) 1,087 (7.8) 51 (4.4) <0.001
Manual 1,467 (51.2) 8,274 (46.3) 3,115 (48.5) 279 (52.3) 2,050 (28.2) 8,777 (25.9) 2,997 (21.4) 203 (17.5) Unemployed /
housewives
594 (20.7) 3,199 (17.9) 1,471 (22.9) 179 (33.5) 4,429 (61.0) 20,229 (59.6) 9,394 (67.1) 854 (73.8)
Married,n(%) 2,637 (92.0) 16,834 (94.1) 6,086 (94.7) 495 (92.7) <
0.001
5,725 (78.9) 29,032 (85.5) 12,137 (86.6) 975 (84.2) <0.001
Postmenopausal,n(%) - - - - N.A. 4,937 (68.0) 19,066 (56.2) 7,292 (52.1) 586 (50.6) <0.001
Lifestyle factors
Current smokers, n (%) 864 (30.1) 5,511 (30.8) 2,055 (32.0) 192 (36.0) 0.039 194 (2.7) 669 (2.0) 315 (2.3) 41 (3.5) <0.001
Current drinkers,n(%) 1,957 (68.2) 12,883 (72.0) 4,521 (70.3) 370 (69.3) 0.001 2,077 (28.6) 10,124 (29.8) 4,279 (30.6) 344 (29.7) 0.077 Having three meals a
day,n(%)
2,391 (83.4) 15,702 (87.8) 5,650 (87.9) 440 (82.4) <
0.001
5,314 (73.2) 27,127 (79.9) 11,132 (79.5) 822 (71.0) <0.001
Multi-vitamin users,n (%)
475 (16.6) 3,099 (17.3) 1,072 (16.7) 54 (10.1) <
0.001
1,360 (18.7) 7,123 (20.9) 2,647 (18.9) 211 (18.2) <0.001
Regular exercisers,n (%)
1,487 (51.9) 10,172 (56.9) 3,489 (54.3) 224 (42.0) <
0.001
3,413 (47.0) 17,439 (51.4) 7,117 (50.8) 532 (45.9) <0.001
Psychological condition
PWI statusb,n(%)
Positive wellbeing 380 (13.3) 2,465 (13.8) 946 (14.7) 71 (13.3) <
0.001
589 (8.1) 3,194 (9.4) 1,422 (10.2) 95 (8.2) <0.001
Moderate distress 1,919 (66.9) 13,087 (73.2) 4,517 (70.3) 337 (63.1) 4,648 (64.0) 24,054 (70.9) 9,750 (69.6) 692 (59.8) Severe distress 426 (14.9) 1,567 (8.8) 653 (10.2) 96 (18.0) 1,602 (22.1) 4,834 (14.2) 2,052 (14.7) 289 (25.0) Stress events,n(%)
Not at all 1,458 (50.8) 10,603 (59.3) 3,861 (60.1) 293 (54.9) <
0.001
2,755 (38.0) 15,897 (46.8) 6,975 (49.9) 523 (45.2) <0.001
Often 1,013 (35.3) 5,897 (33.0) 1,982 (30.8) 170 (31.8) 3,065 (42.2) 13,914 (41.0) 5,320 (38.0) 443 (38.3) Frequent 322 (11.2) 968 (5.4) 380 (5.9) 53 (9.9) 1,276 (17.6) 3,314 (9.8) 1,303 (9.3) 147 (12.7)
(Continued)
Correla
tes
of
Sleep
Duration
PLOS
ONE
|DOI:10.137
1/journal.p
one.0123510
May
1,
2015
7/2
Table 1. (Continued)
Men (N = 27,717) Women (N = 56,377)
<6 hours (N = 2,868)
6–7 hours
(N = 17,885)
8–9 hours
(N = 6,430)
10 hours (N = 534)
Pa <6 hours (N = 7,260)
6–7 hours
(N = 33,950)
8–9 hours
(N = 14,009)
10 hours (N = 1,158)
Pa
Self-reported health status,n(%)
Healthy 1,176 (41.0) 8,020 (44.8) 2,757 (42.9) 195 (36.5) <
0.001
1,938 (26.7) 11,180 (32.9) 4,559 (32.5) 316 (27.3) <0.001
Normal 1,082 (37.7) 7,432 (41.6) 2,646 (41.2) 196 (36.7) 3,038 (41.9) 15,888 (46.8) 6,273 (44.8) 478 (41.3) Unhealthy 573 (20.0) 2,181 (12.2) 920 (14.3) 140 (26.2) 2,158 (29.7) 6,327 (18.6) 2,923 (20.9) 346 (29.9) Anthropometry
BMI (kg/m2, mean
±SD) 24.5±2.9 24.4±2.7 24.3±2.7 24.5±2.6 0.003 24.1±3.0 23.7±2.9 23.8±2.9 24.1±3.1 <0.001
WC (cm, mean±SD) 86.5±7.9 86.1±7.3 86.3±7.5 87.6±7.5 <
0.001
80.2±8.5 78.9±8.0 79.2±8.1 80.2±8.4 <0.001
Note: N.A., not applicable; PWI, psychosocial well-being index;BMI, body mass index; WC, waist circumference; aCalculated by chi-square test for categorical variables or analysis of variance (ANOVA) for continuous variables
bDe
fined as Positive wellbeing group: PWI score8, Moderate distress group: PWI score 8–27, and Severe distress group: PWI score27
doi:10.1371/journal.pone.0123510.t001
Table 2. Prevalence of study population currently receiving treatment of diseases across categories of sleep duration.
Men (N = 27,717) Women (N = 56,377)
<6 hours (N = 2,868)
6–7 hours
(N = 17,885)
8–9 hours
(N = 6,430)
10 hours (N = 534)
Pa
<6 hours (N = 7,260)
6–7 hours
(N = 33,950)
8–9 hours
(N = 14,009)
10 hours (N = 1,158)
Pa
Certain infectious & parasitic disease
Tuberculosis,n(%) 6 (0.2) 10 (0.1) 7 (0.1) 0 (0.0) 0.081 5 (0.1) 15 (0.1) 7 (0.1) 1 (0.1) 0.722
Viral infections-skin & mucous membrane lesions
Acute liver disease,n(%) 7 (0.2) 26 (0.1) 8 (0.1) 3 (0.6) 0.107 4 (0.1) 11 (0.0) 13 (0.1) 0 (0.0) 0.063
Chronic liver disease,n (%)
36 (1.3) 154 (0.9) 77 (1.2) 6 (1.1) 0.085 24 (0.3) 143 (0.4) 68 (0.5) 7 (0.6) 0.355
Neoplasms
Cancer,n(%) 12 (0.4) 82 (0.5) 40 (0.6) 6 (1.1) 0.017 49 (0.7) 236 (0.7) 116 (0.8) 8 (0.7) 0.775
Endocrine,nutritional & metabolic disease
Diabetes mellitus,n(%) 222 (7.7) 1,187 (6.6) 492 (7.7) 65 (12.2) <0.001 400 (5.5) 1,325 (3.9) 606 (4.3) 71 (6.1) <0.001
Thyroid disease,n(%) 6 (0.2) 91 (0.5) 40 (0.6) 6 (1.1) 0.048 168 (2.3) 705 (2.1) 331 (2.4) 24 (2.1) 0.419
Hyperlipidemia,n(%) 78 (2.7) 477 (2.7) 161 (2.5) 21 (3.9) 0.583 253 (3.5) 912 (2.7) 368 (2.6) 27 (2.3) 0.002
Mental & behavioral disorders
Depression,n(%) 22 (0.8) 50 (0.3) 33 (0.5) 3 (0.6) 0.002 101 (1.4) 215 (0.6) 115 (0.8) 30 (2.6) <0.001
(Continued)
Correla
tes
of
Sleep
Duration
PLOS
ONE
|DOI:10.137
1/journal.p
one.0123510
May
1,
2015
8/2
Table 2. (Continued)
Men (N = 27,717) Women (N = 56,377)
<6 hours (N = 2,868)
6–7 hours
(N = 17,885)
8–9 hours
(N = 6,430)
10 hours (N = 534)
Pa <6 hours (N = 7,260)
6–7 hours
(N = 33,950)
8–9 hours
(N = 14,009)
10 hours (N = 1,158)
Pa
Diseases of the eye & adnexa
Cataract,n(%) 24 (0.8) 110 (0.6) 49 (0.8) 2 (0.4) 0.602 74 (1.0) 214 (0.6) 77 (0.5) 10 (0.9) <0.001
Diseases of the circulatory system
Hypertension,n(%) 612 (21.3) 3,153 (17.6) 1,156 (18.0) 112 (21.0) <0.001 1,417 (19.5) 5,044 (14.9) 2,030 (14.5) 194 (16.8) <0.001
Myocardial infarction,n (%)
66 (2.3) 335 (1.9) 145 (2.3) 18 (3.4) 0.051 125 (1.7) 318 (0.9) 123 (0.9) 8 (0.7) <0.001
Stroke,n(%) 39 (1.4) 140 (0.8) 79 (1.2) 15 (2.8) <0.001 40 (0.6) 146 (0.4) 72 (0.6) 10 (0.9) 0.048
Diseases of the respiratory system Asthma / Chronic bronchitis,n(%)
16 (0.6) 92 (0.5) 45 (0.7) 8 (1.5) 0.088 53 (0.7) 181 (0.5) 77 (0.5) 7 (0.6) <0.001
Diseases of the digestive system
Cholelithiasis,n(%) 4 (0.1) 17 (0.1) 12 (0.2) 1 (0.2) 0.346 8 (0.1) 41 (0.1) 11 (0.1) 3 (0.3) 0.417
Fatty liver disease,n(%) 31 (1.1) 188 (1.1) 75 (1.2) 8 (1.5) 0.678 41 (0.6) 126 (0.4) 46 (0.3) 9 (0.8) 0.034
Gastritis,n(%) 54 (1.9) 243 (1.4) 108 (1.7) 11 (2.1) 0.232 188 (2.6) 598 (1.8) 243 (1.7) 21 (1.8) <0.001
Intestinal polyp,n(%) 4 (0.1) 20 (0.1) 9 (0.1) 0 (0.0) 0.420 4 (0.1) 20 (0.1) 7 (0.1) 0 (0.0) 0.895
Peptic Ulcer,n(%) 32 (1.1) 159 (0.9) 89 (1.4) 5 (0.9) 0.044 83 (1.1) 250 (0.7) 123 (0.9) 8 (0.7) 0.025
Diseases of the musculo-skeletal system
Arthritis,n(%) 47 (1.6) 198 (1.1) 87 (1.4) 18 (3.4) <0.001 494 (6.8) 1,599 (4.7) 699 (5.0) 79 (6.8) <0.001
Osteoporosis,n(%) 11 (0.4) 24 (0.1) 9 (0.1) 1 (0.2) 0.092 292 (4.0) 934 (2.8) 399 (2.8) 42 (3.6) <0.001
Diseases of the genitoruinary system
Bladder infection,n(%) 3 (0.1) 17 (0.1) 13 (0.2) 0 (0.0) 0.494 40 (0.6) 123 (0.4) 54 (0.4) 8 (0.7) 0.041
aChi-square test for categorical variables
doi:10.1371/journal.pone.0123510.t002
Correla
tes
of
Sleep
Duration
PLOS
ONE
|DOI:10.137
1/journal.p
one.0123510
May
1,
2015
9/2
Table 3. Odd ratios (95% CIs)afor short or long sleep duration compared to normal sleep duration (6
–7 hours) according to selected correlates.
Men (N = 27,717) Women (N = 56,377)
<6 hours 8–9 hours 10 hours Pnominalb Pcorrectedc` <6 hours 8–9 hours 10 hours Pnominalb Pcorrectedc`
OR (95% CI) OR (95% CI) OR (95% CI) OR (95% CI) OR (95% CI) OR (95% CI)
Sociodemographic factors
Age (years)
40–49 1.00 (Ref.) 1.00 (Ref.) 1.00 (Ref.) <0.001 <0.001 1.00 (Ref.) 1.00 (Ref.) 1.00 (Ref.) <0.001 <0.001
50–59 1.09 (0.99–
1.21)
1.11 (1.03– 1.19)
1.56 (1.21– 2.00)
1.22 (1.12– 1.32)
0.80 (0.76– 0.85)
0.70 (0.59– 0.83)
60–69 1.74 (1.55–
1.95)
1.10 (1.01– 1.20)
2.07 (1.58– 2.72)
1.81 (1.64– 2.00)
0.76 (0.70– 0.82)
0.61 (0.50– 0.77) Educational attainment
College degree or higher 1.00 (Ref.) 1.00 (Ref.) 1.00 (Ref.) <0.001 <0.001 1.00 (Ref.) 1.00 (Ref.) 1.00 (Ref.) <0.001 <0.001
High school graduate 1.15 (1.03– 1.28)
1.27 (1.18– 1.37)
1.81 (1.36– 2.39)
1.08 (0.99– 1.19)
1.05 (0.99– 1.12)
1.50 (1.20– 1.87) Middle school or below 1.38 (1.22–
1.56)
1.55 (1.42– 1.69)
2.74 (2.04– 3.68)
1.34 (1.21– 1.48)
1.13 (1.06– 1.21)
1.99 (1.57– 2.50) Occupational
classification
Non-manual 1.00 (Ref.) 1.00 (Ref.) 1.00 (Ref.) <0.001 <0.001 1.00 (Ref.) 1.00 (Ref.) 1.00 (Ref.) <0.001 <0.001
Manual 1.15 (1.03–
1.28)
1.15 (1.07– 1.25)
1.76 (1.30– 2.37)
1.10 (0.99– 1.23)
1.22 (1.12– 1.32)
1.32 (0.96– 1.82) Unemployed / housewives 1.01 (0.88–
1.15)
1.45 (1.32– 1.59)
2.77 (2.01– 3.83)
1.02 (0.92– 1.13)
1.76 (1.63– 1.90)
2.88 (2.14– 3.88) Marital status
Married 1.00 (Ref.) 1.00 (Ref.) 1.00 (Ref.) <0.001 0.001 1.00 (Ref.) 1.00 (Ref.) 1.00 (Ref.) <0.001 <0.001 Single or separated 1.26 (1.07–
1.48)
0.82 (0.71– 0.94)
0.96 (0.67– 1.37)
1.19 (1.11– 1.27)
0.97 (0.91– 1.03)
1.08 (0.91– 1.28) Menopausal status
Premenopausal - - - 1.00 (Ref.) 1.00 (Ref.) 1.00 (Ref.) <0.001 <0.001
Postmenopausal - - - 1.14 (1.06–
1.24)
0.90 (0.85– 0.95)
0.79 (0.67– 0.94) Lifestyle factors
Smoking status
Non-current smokers 1.00 (Ref.) 1.00 (Ref.) 1.00 (Ref.) 0.017 0.050 1.00 (Ref.) 1.00 (Ref.) 1.00 (Ref.) 0.008 0.019 Current smokers 0.95 (0.87–
1.04)
1.07 (1.01– 1.15)
1.22 (1.01– 1.48)
1.07 (0.90– 1.26)
1.13 (0.98– 1.30)
1.40 (1.00– 1.94) Alcohol consumption
Non-current drinkers 1.00 (Ref.) 1.00 (Ref.) 1.00 (Ref.) 0.554 0.764 1.00 (Ref.) 1.00 (Ref.) 1.00 (Ref.) 0.452 0.625 Current drinkers 0.92 (0.85–
1.01)
0.96 (0.90– 1.02)
1.02 (0.84– 1.24)
1.02 (0.96– 1.08)
1.02 (0.98– 1.07)
0.94 (0.82– 1.07) Eating habits
Having three meals a day 1.00 (Ref.) 1.00 (Ref.) 1.00 (Ref.) <0.001 <0.001 1.00 (Ref.) 1.00 (Ref.) 1.00 (Ref.) <0.001 <0.001
(Continued)
Table 3. (Continued)
Men (N = 27,717) Women (N = 56,377)
<6 hours 8–9 hours 10 hours Pnominalb Pcorrectedc` <6 hours 8–9 hours 10 hours Pnominalb Pcorrectedc`
OR (95% CI) OR (95% CI) OR (95% CI) OR (95% CI) OR (95% CI) OR (95% CI)
Having irregular meals 1.41 (1.26– 1.58)
1.02 (0.93– 1.12)
1.57 (1.24– 2.00)
1.50 (1.41– 1.59)
1.03 (0.98– 1.09)
1.59 (1.39– 1.82) Intake of multi vitamin
Multi-vitamin users 1.00 (Ref.) 1.00 (Ref.) 1.00 (Ref.) 0.074 0.199 1.00 (Ref.) 1.00 (Ref.) 1.00 (Ref.) 0.004 0.012
Non-users 1.00 (0.90–
1.11)
0.97 (0.90– 1.05)
1.53 (1.14– 2.04)
1.09 (1.02– 1.16)
1.09 (1.04– 1.15)
1.04 (0.89– 1.21) Physical activity
Regular exercisers 1.00 (Ref.) 1.00 (Ref.) 1.00 (Ref.) 0.002 0.005 1.00 (Ref.) 1.00 (Ref.) 1.00 (Ref.) <0.001 0.002 Non-exercisers 1.09 (1.00–
1.18)
1.06 (1.00– 1.12)
1.48 (1.23– 1.78)
1.04 (0.98– 1.10)
1.07 (1.03– 1.12)
1.26 (1.11– 1.42) Psychological condition
PWI statusd
Positive wellbeing 1.00 (Ref.) 1.00 (Ref.) 1.00 (Ref.) <0.001 <0.001 1.00 (Ref.) 1.00 (Ref.) 1.00 (Ref.) <0.001 <0.001 Moderate distress 0.92 (0.81–
1.04)
0.90 (0.82– 0.98)
0.85 (0.65– 1.12)
0.96 (0.87– 1.05)
0.89 (0.83– 0.95)
0.88 (0.70– 1.10) Severe distress 1.24 (1.04–
1.48)
1.00 (0.87– 1.14)
1.30 (0.90– 1.87)
1.18 (1.05– 1.32)
0.88 (0.80– 0.96)
1.40 (1.08– 1.83) Stress events
Not at all 1.00 (Ref.) 1.00 (Ref.) 1.00 (Ref.) <0.001 <0.001 1.00 (Ref.) 1.00 (Ref.) 1.00 (Ref.) <0.001 <0.001
Often 1.21 (1.10–
1.32)
0.92 (0.86– 0.98)
0.96 (0.78– 1.17)
1.14 (1.08– 1.21)
0.88 (0.84– 0.92)
0.85 (0.75– 0.98)
Frequent 1.84 (1.58–
2.13)
0.96 (0.84– 1.09)
1.13 (0.81– 1.57)
1.59 (1.46– 1.73)
0.87 (0.81– 0.94)
0.91 (0.74– 1.11) Self-reported health
status
Healthy 1.00 (Ref.) 1.00 (Ref.) 1.00 (Ref.) <0.001 <0.001 1.00 (Ref.) 1.00 (Ref.) 1.00 (Ref.) <0.001 <0.001
Normal 0.92 (0.84–
1.01)
1.01 (0.95– 1.08)
0.95 (0.77– 1.17)
1.02 (0.95– 1.09)
0.98 (0.94– 1.03)
0.96 (0.83– 1.12)
Unhealthy 1.28 (1.12–
1.45)
1.10 (1.00– 1.22)
1.61 (1.24– 2.09)
1.38 (1.28– 1.50)
1.18 (1.11– 1.26)
1.46 (1.22– 1.74) Anthropometry
Body mass indexe(kg/ m2)
Quartile 1 (Lowest) 1.00 (0.88– 1.14)
0.99 (0.91– 1.08)
0.71 (0.54– 0.95)
<0.001 <0.001 0.99 (0.91– 1.08)
1.04 (0.98– 1.10)
0.92 (0.76– 1.11)
0.282 0.461
Quartile 2 1.00 (Ref.) 1.00 (Ref.) 1.00 (Ref.) 1.00 (Ref.) 1.00 (Ref.) 1.00 (Ref.)
Quartile 3 1.07 (0.94– 1.21)
0.94 (0.86– 1.02)
0.88 (0.68– 1.13)
1.01 (0.93– 1.09)
1.03 (0.97– 1.09)
0.93 (0.78– 1.11) Quartile 4 (Highest) 1.32 (1.15–
1.51)
0.87 (0.79– 0.96)
0.67 (0.50– 0.90)
1.09 (1.00– 1.19)
1.01 (0.94– 1.08)
1.00 (0.81– 1.22)
(Continued)
Table 3. (Continued)
Men (N = 27,717) Women (N = 56,377)
<6 hours 8–9 hours 10 hours Pnominalb Pcorrectedc` <6 hours 8–9 hours 10 hours Pnominalb Pcorrectedc`
OR (95% CI) OR (95% CI) OR (95% CI) OR (95% CI) OR (95% CI) OR (95% CI)
Waist circumferencef (cm)
Quartile 1 (Lowest) 1.03 (0.90– 1.17)
0.92 (0.84– 1.01)
0.95 (0.71– 1.27)
<0.001 0.002 1.06 (0.98– 1.15)
0.95 (0.89– 1.01)
0.91 (0.76– 1.10)
0.109 0.231
Quartile 2 1.00 (Ref.) 1.00 (Ref.) 1.00 (Ref.) 1.00 (Ref.) 1.00 (Ref.) 1.00 (Ref.)
Quartile 3 0.95 (0.85– 1.08)
0.96 (0.88– 1.04)
1.11 (0.85– 1.44)
1.03 (0.95– 1.11)
1.00 (0.94– 1.06)
1.03 (0.86– 1.23) Quartile 4 (Highest) 0.96 (0.84–
1.11)
1.09 (0.98– 1.20)
1.66 (1.23– 2.23)
1.00 (0.92– 1.10)
1.07 (1.00– 1.15)
1.21 (0.98– 1.48)
Note: Unknown values were wholly included in the statistical models but were not presented in the table
aAll ORs were adjusted for sociodemographic factors (i.e., age, education attainment, occupational classification, marital status, and menopausal status for women only), lifestyle
factors (i.e., smoking status, alcohol consumption, eating habits, intake of multi vitamin, and physical activity), psychological conditions (i.e., PWI status, stress events, and self-reported health status), and anthropometry (i.e., body mass index and waist circumference)
bEstimated in multinomial logistic regression models according to a nominal scale
cComputed by using the Benjamini—Hochberg’s false discovery rate (FDR) controlling method
dDefined as Positive wellbeing group: PWI score8, Moderate distress group: PWI score 8
–27, and Severe distress group: PWI score27
eDefined as Quartile 1: BMI22.6 kg/cm2, Quartile 2: 22.6 kg/cm2<BMI24.4 kg/cm2, Quartile 3: 24.4 kg/cm2<BMI26.1 kg/cm2, and Quartile 4: BMI>26.1 kg/cm2in men;
Quartile 1: BMI21.8 kg/cm2, Quartile 2: 21.8 kg/cm2<BMI23.5 kg/cm2, Quartile 3: 23.5 kg/cm2<BMI25.5 kg/cm2, and Quartile 4: BMI>25.5 kg/cm2in women fDefined as Quartile 1: WC81.3cm, Quartile 2: 81.3cm<WC86.0cm, Quartile 3: 86.0cm<WC91.0cm, and Quartile 4: WC>91.0cm in men; Quartile 1: WC73.5cm,
Quartile 2: 73.5cm<WC79.0cm, Quartile 3: 79.0cm<WC84.3cm, Quartile 4: 84.3cm<WC in women
doi:10.1371/journal.pone.0123510.t003
Correla
tes
of
Sleep
Duration
PLOS
ONE
|DOI:10.137
1/journal.p
one.0123510
May
1,
2015
12
95% CI = 1.11–1.85 for women). Men who were undergoing treatment for thyroid disease were less likely to be short sleepers (OR = 0.39, 95% CI = 0.17–0.90), but men taking medication for depression were more likely to be short sleepers (OR = 1.69, 95% CI = 1.01–2.85). Treatment for depression appeared to be associated with increased odds of having both short and long sleep duration among women (OR = 1.54, 95% CI = 1.21–1.97 for short sleep and OR = 2.85, 95% CI = 1.92–4.25 for long sleep). Among men, medical treatments for stroke and arthritis was associated with higher odds of having long sleep duration (OR = 1.77, 95% CI = 1.01–3.10 and OR = 1.90, 95% CI = 1.15–3.15;Table 4).
After adjusting for multiple comparisons, significant associations between putative corre-lates and sleep duration were still observed, especially for sociodemographic factors and psy-chological conditions in both sexes. However, all adjustedp-values for health conditions failed to reach the level of statistical significance among men. Among women, current treatments for diabetes mellitus and depression appeared to be correlated with variations in the usual sleep duration when multiple comparisons were controlled (pcorrected = 0.009 and<0.001,
respec-tively; Tables3and4).
Three-phase sensitivity analyses indicate that all results are robust to residual effects of med-ication use and/or comorbidity status on usual sleep duration. Generally comparable trends were achieved regardless of underlying assumptions, though minor variations in each effect size were observed (S3andS4Tables).
Discussion
The present study attempted to identify characteristics within five domains (i.e., sociodemo-graphic factors, lifestyle factors, psychological conditions, anthropometry, and health condi-tions) that might be simultaneously and/or independently associated with short or long sleep duration among middle-aged and elderly Koreans. Regardless of sexual differences, adverse be-haviors and lifestyle factors including being unmarried, having low socioeconomic status, cur-rently smoking, not exercising, having irregular meals, and having poor psychosocial well-being, experiencing frequent stress events, or having poor self-rated health all raised the odds of having an abnormal sleep duration. Furthermore, diabetes mellitus and depression were positively associated with abnormal sleep duration in both men and women. The present find-ings have indicated that a substantial proportion of the middle-aged and elderly Korean popu-lations may be affected by deleterious effects of inadequate sleep duration. We found that 12.1% of the study population slept less than 6 hours (10.4% for men and 12.9% for women) and 2.0% slept 10 hours and more (1.9% for men and 2.0% for women). Overall prevalence of short and long sleepers followed a similar trend when compared to the statistics derived from the Fourth Korea National Health and Nutrition Examination Survey (KNHANES IV, 2007–
2009); but absolute proportions for short and long sleep duration were higher than those of ours (data not shown). This can be explained by the healthy volunteer effect in the HEXA study: our participants recruited for the health examination centers may be more likely to be concerned with health status and to engage in health-seeking behaviors compared to the gener-al population. In order to encourage good physicgener-al hegener-alth and psychosocigener-al well-being, people who sleep too little or too much should be treated as at-risk populations and a target for tailor-made interventions involving risk modification on sleep.
Sociodemographic factors
In general, aging is assumed to influence certain variations in sleep duration, quality, and archi-tecture due to physiological age-dependent changes in circadian rhythms, homeostatic regula-tion, respiratory functioning, and endocrine functioning [23]. Age appears to be a predictor of Correlates of Sleep Duration
Table 4. Odd ratios (95% CIs)afor short or long sleep duration compared to normal sleep duration (6
–7 hours) according to currently receiving treatment of diseases.
Men (N = 27,717) Women (N = 56,377)
<6 hours 8–9 hours 10 hours Pnominalb Pcorrectedc <6 hours 8–9 hours 10 hours Pnominalb Pcorrectedc
OR (95% CI) OR (95% CI) OR (95% CI) OR (95% CI) OR (95% CI) OR (95% CI)
Tuberculosis 2.25 (0.80–
6.34)
1.54 (0.58– 4.11)
-d 0.399 0.633 1.49 (0.53–
4.18)
1.17 (0.47– 2.88)
2.02 (0.26– 15.5)
0.824 0.873
Acute liver disease 1.28 (0.55– 3.01)
0.74 (0.33– 1.63)
2.34 (0.67– 8.12)
0.417 0.633 1.30 (0.40– 4.21)
2.68 (1.19– 6.04)
-d 0.147 0.295
Chronic liver disease 1.26 (0.87– 1.83)
1.30 (0.98– 1.72)
0.99 (0.43– 2.27)
0.663 0.800 0.69 (0.45– 1.08)
1.11 (0.83– 1.49)
1.29 (0.60– 2.79)
0.333 0.521
Cancer 0.70 (0.38–
1.30)
1.18 (0.81– 1.74)
1.67 (0.71– 3.93)
0.132 0.283 0.92 (0.67– 1.26)
1.15 (0.92– 1.45)
0.86 (0.42– 1.75)
0.794 0.866
Diabetes mellitus 0.99 (0.84– 1.15)
1.05 (0.94– 1.18)
1.37 (1.04– 1.81)
0.273 0.503 1.03 (0.92– 1.16)
1.11 (1.00– 1.23)
1.43 (1.11– 1.85)
0.003 0.009
Thyroid disease 0.39 (0.17–
0.90)
1.18 (0.81– 1.71)
2.05 (0.88– 4.79)
0.138 0.283 1.07 (0.90– 1.28)
1.13 (0.99– 1.29)
0.93 (0.61– 1.40)
0.515 0.657
Hyperlipidemia 0.91 (0.71–
1.17)
0.93 (0.78– 1.12)
1.33 (0.84– 2.09)
0.716 0.804 1.04 (0.90– 1.20)
1.01 (0.89– 1.14)
0.84 (0.57– 1.24)
0.608 0.706
Depression 1.69 (1.01–
2.85)
1.62 (1.03– 2.53)
1.00 (0.30– 3.29)
0.349 0.583 1.54 (1.21– 1.97)
1.26 (1.00– 1.58)
2.85 (1.92– 4.25)
<0.001 <0.001
Cataract 1.12 (0.71–
1.76)
1.12 (0.80– 1.58)
0.44 (0.11– 1.80)
0.688 0.803 1.09 (0.83– 1.43)
0.90 (0.69– 1.17)
1.23 (0.64– 2.34)
0.475 0.633
Hypertension 1.07 (0.97–
1.19)
0.95 (0.88– 1.02)
0.88 (0.71– 1.11)
0.123 0.283 1.03 (0.96– 1.11)
1.00 (0.94– 1.06)
1.09 (0.92– 1.29)
0.923 0.923
Myocardial infarction 0.93 (0.70– 1.22)
1.06 (0.87– 1.30)
1.11 (0.67– 1.82)
0.589 0.764 1.22 (0.98– 1.51)
0.94 (0.76– 1.16)
0.61 (0.30– 1.25)
0.246 0.443
Stroke 1.16 (0.81–
1.68)
1.28 (0.97– 1.70)
1.77 (1.01– 3.10)
0.219 0.427 0.83 (0.58– 1.18)
1.12 (0.84– 1.49)
1.43 (0.75– 2.75)
0.368 0.541
Asthma / Chronic bronchitis
0.80 (0.47– 1.38)
1.19 (0.83– 1.71)
1.82 (0.86– 3.84)
0.571 0.764 1.05 (0.76– 1.43)
1.02 (0.78– 1.34)
0.96 (0.45– 2.06)
0.007 0.019
Cholelithiasis 0.96 (0.32–
2.90)
1.66 (0.79– 3.52)
1.26 (0.16– 9.63)
0.758 0.804 0.76 (0.35– 1.64)
0.64 (0.33– 1.24)
1.91 (0.59– 6.22)
0.655 0.737
Fatty liver disease 0.91 (0.62– 1.34)
1.03 (0.79– 1.36)
1.18 (0.57– 2.43)
0.854 0.854 1.15 (0.80– 1.65)
0.88 (0.62– 1.23)
1.80 (0.90– 3.58)
0.584 0.701
Gastritis 1.21 (0.90–
1.64)
1.14 (0.91– 1.44)
1.20 (0.65– 2.24)
0.821 0.845 1.13 (0.95– 1.34)
0.98 (0.84– 1.14)
0.87 (0.56– 1.36)
0.267 0.458
Intestinal polyp 1.23 (0.41–
3.65)
1.24 (0.56– 2.75)
-d 0.661 0.800 0.75 (0.25–
2.24)
0.81 (0.34– 1.92)
-d 0.877 0.902
Peptic Ulcer 1.01 (0.68–
1.49)
1.43 (1.10– 1.86)
0.76 (0.31– 1.88)
0.106 0.264 1.15 (0.89– 1.49)
1.18 (0.95– 1.47)
0.75 (0.37– 1.52)
0.529 0.657
Arthritis 1.08 (0.78–
1.50)
1.05 (0.81– 1.35)
1.90 (1.15– 3.15)
0.293 0.512 1.02 (0.91– 1.13)
1.07 (0.97– 1.17)
1.25 (0.98– 1.59)
0.033 0.076
Osteoporosis 1.99 (0.95–
4.15)
0.89 (0.41– 1.92)
0.77 (0.10– 5.88)
0.559 0.764 1.04 (0.90– 1.19)
1.07 (0.95– 1.21)
1.24 (0.90– 1.72)
0.376 0.541
(Continued)
Table 4. (Continued)
Men (N = 27,717) Women (N = 56,377)
<6 hours 8–9 hours 10 hours Pnominalb Pcorrectedc <6 hours 8–9 hours 10 hours Pnominalb Pcorrectedc
OR (95% CI) OR (95% CI) OR (95% CI) OR (95% CI) OR (95% CI) OR (95% CI)
Bladder infection 0.76 (0.22–
2.64)
1.81 (0.87– 3.76)
-d 0.756 0.804 1.26 (0.87
– 1.81)
1.06 (0.77– 1.46)
1.65 (0.80– 3.40)
0.185 0.351
Note: Unknown values were wholly included in the statistical models but were not presented in the table aAll ORs were adjusted for sociodemographic factors (i.e., age, education attainment, occupational classi
fication, marital status, and menopausal status for women only), lifestyle factors (i.e., smoking status, alcohol consumption, eating habits, intake of multi vitamin, and physical activity), psychological condition (i.e., PWI status, stress events, and self-reported health status), and anthropometry (i.e., body mass index and waist circumference)
bEstimated in multinomial logistic regression models according to a nominal scale
cComputed by using the Benjamini
—Hochberg’s false discovery rate (FDR) controlling method dEstimate was not provided due to the cell with zero count
doi:10.1371/journal.pone.0123510.t004
Correla
tes
of
Sleep
Duration
PLOS
ONE
|DOI:10.137
1/journal.p
one.0123510
May
1,
2015
15
short and long sleep duration, but the influence of age may differ by sex. Studies have consis-tently reported that total sleep duration decreases with age [24,25], particularly among women [18]. However, the controversy as to whether aging is significantly linked to long sleep duration has not been resolved; some studies continue to show that long sleepers are more prevalent in elderly men [26,27]. Further studies focusing on the biological mechanisms of sleep structure by age are warranted.
Socioeconomic status is assumed to play a crucial role in sleep duration; having a low socio-economic status has been shown to correlate with both short and long sleep duration even after adjusting for other physical/psychological health-related characteristics [19,20,28], which is in line with the present findings. Socioeconomic status might help stimulate the motivation for healthy behaviors; additionally, higher socioeconomic status is assumed to provide individuals with health-promoting resources to avoid risky behaviors [29]. In the same vein, higher socio-economic status would mediate the association between adverse sleep duration and healthy be-haviors. This in turn helps avoid inadequate sleep duration. Although we could not clarify the underlying mechanisms linking socioeconomic status to sleep structure, our findings suggest that socioeconomic disparities are detrimental to sleep duration. Interestingly, being unem-ployed appeared to be associated with a nearly threefold increase in the odds of having longer sleep duration in both sexes. This can be reasonably explained by unemployed individuals being undeterred by a fixed work schedule; thus, these subjects can have the opportunity to sleep more than employed individuals. Consistent with our findings, study in Finland demonstrated that occupation was associated with both short and long sleep duration [30]; being unemployed predicted a 2.42-fold increase in longer sleep duration [31]. Furthermore, being a housewife was associated with both short and long sleep duration among a sample of Chinese women [18].
In terms of marital status, being unmarried was a significant correlate of short sleep dura-tion for both men and women; this is consistent with other studies [3,32]. Marital status was re-ported to be an independent risk factor for low sleep quality, while those living with a spouse or family member tend to have better sleep quality [33,34]. Marriage is generally regarded as a key social relationship in adulthood, which can be a protective factor against risks of morbidity and/or mortality [35]. Notably, support from other relationships cannot fully compensate for the effect of being single [35]; we suppose that sleep deprivation and disturbance might be greater in single people because they might have overall poorer psychological conditions and/ or engage in more unhealthy behaviors.
Postmenopausal women appear to frequently experience a significant decrease in sleep quantity. Generally, women in menopausal transition and in the postmenopausal period are re-ported to have sleep problems such as shorter duration, low sleep efficiency, overall low quality, and insomnia complaints [36–38]. This phenomenon may be explained by hormonal changes, climacteric symptoms, or ageing effect accompanying changes in circadian rhythms and physi-ological functions. Studies focused on sleep physiology at different stages of a woman's life cycle will further clarify the complex mechanism.
Lifestyle factors
In the present study, current smoking was related to long sleep duration for both men and women. The association between smoking and long sleep has been controversial [18,21,39]—in contrast to our findings, current smoking has been reported as a correlate of short sleep dura-tion. Nevertheless, smokers appear more likely to suffer from disturbed sleep, regardless of sex. Studies have consistently indicated that smoking can independently lead to disturbed sleep ar-chitecture for both men and women [39,40]. An integrated approach to understand the under-lying dynamics between smoking and sleep duration is necessary. Although alcohol
Correlates of Sleep Duration
consumption was not associated with abnormal sleep duration in the present study, previous studies have demonstrated associations between alcohol consumption and short [41] and long sleep duration [31]. To better clarify the association between alcohol consumption and sleep duration, the quantity of alcohol consumption should be considered in further studies.
Having irregular meals was a meaningful correlate of both short and long sleep duration in the present study. Generally, short sleepers are assumed to engage in more irregular meals and frequent snacking [42]. Long sleep duration has been also reported to correlate with unconven-tional eating rhythms [17]. Given that sleep irregularity, uncontrolled diet, and psychological stress are interrelated, this cycle may be alleviated by behavioral sleep modification or simple diet modifications. The association between multi-vitamin intake and sleep duration differed by sex; men showed significant associations with long sleep duration while women participants showed associations with short sleep duration. A plausible explanation of these findings is re-verse causation: unhealthy individuals with sleep problems might take health supplements (like multi-vitamins) [18]; thus, multi-vitamin intake may be associated with general abnormal sleep duration. Further studies that include detailed information are needed to clarify their as-sociation with sleep patterns.
Regular exercise was revealed to be associated with a lower likelihood of abnormal sleep du-ration. It is generally thought that physical exercise can be a therapy comparable to pharmaco-logical treatments for treating sleep disorders and depression [43,44]. Furthermore, a recent study demonstrated a dose-response relationship between exercise and sleep episodes, whereby higher levels of exercise influence favorable sleep patterns, including higher sleep quality, short-ened sleep latency, fewer awakenings, and better psychological functioning [45]. These associa-tions can be explained via several biological mechanisms [43–46]: exercise is assumed to (1) affect endogenous concentration of melatonin, which is related to circadian rhythms; (2) pro-mote sleep-wake homeostatic regulation; (3) play a crucial role in thermoregulation linked to sleep; and (4) increase the secretion of endogenous opioid peptides (β- endorphin) in the brain. Common benefits of physical exercise appear to activate physiological and/or psychological al-terations, which can produce positive alterations connected with improved sleep duration.
Psychological conditions
Poor psychological conditions, such as severe distress as measured by the PWI, frequent stress events, and poor self-rated health, had consistent associations with abnormal sleep duration. These results confirm past results showing that (1) psychosocial stressors could be a key com-ponent to changes in sleep architecture (i.e., increased sleep latency, decreased sleep efficiency, decreased rapid eye movement (REM) and slow-wave sleep, and increased frequency of awak-ening) that are closely correlated with impaired and disturbed sleep [47–49]; and (2) short and long sleep are positively associated with poor self-rated health, even after adjusting for other confounding factors such as age, gender, socioeconomic status, lifestyle habits, and mental con-ditions [27,50]. Sleep disturbances also show a significantly inverse association with fair self-rated health [51]. These psychological factors systematically interfere with each other, leading to impaired sleep duration in both a dependent and/or independent manner. Furthermore, given that mental health directly affects physiological health, psychological factors may act as a modifier for typical sleep episodes. Hypothetically, the causal link between psychological dis-tress and sleep problems is assumed to be mediated by emotional stability; diverse supportive relationships can provide emotional comfort and attenuate stress responses in sleep [52,53]. Such factors are also able to buffer against the harms of psychological distress and risky health behaviors [54]. Additionally, health-promoting effects can be induced even with fair sleep con-ditions. In order to draw a definitive conclusion regarding causal associations, future studies
Correlates of Sleep Duration
assessing more detailed psychological health information and other confounding factors, in-cluding disease comorbidity, quality of life, and social networks, should be conducted with ob-jective measures of sleep structure.
Health conditions
Although we cannot clarify the causal relationships due to the limits of a cross-sectional study design, our findings revealed that sleep duration could be negatively influenced by the presence of disease and/or drug treatment. In the present study, diabetes mellitus was significantly asso-ciated with long sleep duration in both men and women; furthermore, depression was linked to adverse sleep duration regardless of sex. Previous studies have reported that (1) several health conditions, such as hypertension, coronary heart disease, stroke, diabetes, gout, hyper-lipidemia, fatty liver, and a history of cancer were significantly associated with short and/or long sleep duration among Chinese women population [18]; (2) short sleep duration was more frequently observed among elderly Taiwanese who had high depression scores while heart dis-ease was related to long sleep duration [29]; and (3) some chronic diseases, including obesity, diabetes, hypertension, and cardiovascular disease, were associated with short and long sleep duration among U.S. adults [55]. The link between sleep and adverse health outcomes can be explained by biological alterations related to inadequate sleep duration: (1) sleep impairments significantly affect the normal functioning of daily metabolic and hormonal processes by changes in circulating levels of various hormones [56]; (2) altered hormones levels are linked to abnormal appetite regulation, impaired glucose metabolism, and disturbances in immune function [56–59]; and (3) cortisol secretion is remarkably increased, which promotes the devel-opment of the metabolic and cognitive consequences of glucocorticoid excess [60,61]. Further longitudinal follow-up and biological studies will help evaluate the long-term effects of adverse sleep duration on health.
Several study limitations should be noted. First, because the present study was based on a cross-sectional analysis from a prospective cohort study, we could not determine the causal re-lationships and chronological variations between sleep duration and its correlates. Second, al-though a regular intake of pharmaceutical drugs such as sleeping pills and antidepressants is known to affect sleep quantity as well as quality, we could not consider pharmaceutical status in our analyses due to lacking the information. Furthermore, the caffeine effects in sleep dis-ruption [62] could not be explored in the present study due to lack of details on caffeine use in-cluding dietary sources of caffeine and the average amount of caffeine consumed in everyday life. Given this limitation, our findings should be interpreted with caution. Third, we collected sleep duration data based on a single question separated into specific categories:<6 hours, 6–7
hours, 8–9 hours, and10 hours. This limited information made it difficult to provide more specific analyses for evaluating the relationships between sleep duration and its correlates, thereby resulting in less accurate results. For example, we did not calculate mean sleep duration nor did we distinguish sleep duration on weekdays from that on weekends. In spite of these limitations however, the cross-sectional analysis of a large-scale, population-based cohort pro-vides adequate power. Hence, we were able to conduct an analysis on sleep duration by assess-ing a wide range of sociodemographic factors, lifestyles, psychological factors, and various health conditions. Our approach allowed us to reveal significant correlates of sleep duration among the middle-aged and elderly Korean population, which may help extend our under-standing of other Asian populations regarding sleep duration. Moreover, considering how indi-vidual characteristics appear to be inter-correlated with sociocultural aspects in a complex manner, the study findings could provide clues to estimate the sociocultural factors involved with inadequate sleep duration in a developed, non-Western society.
Correlates of Sleep Duration
Conclusion
Detrimental health behaviors and lifestyle factors, such as being unmarried, having low socio-economic status, currently smoking, not exercising, having irregular meals, having poor psy-chosocial conditions, and receiving medical treatment for diabetes and depression, might be meaningful correlates of abnormal sleep duration among middle-aged and elderly Koreans. Further studies assessing factors related to sleep and its proximal and distal consequences should be explored in depth while considering other dimensions (e.g., sleep structure and ar-chitecture) beyond sleep duration.
Supporting Information
S1 Table. Basic characteristics of the study population.
(PDF)
S2 Table. Prevalence of currently receiving treatment of selected diseases of the study popu-lation.
(PDF)
S3 Table. Phase sensitivity analysis among men: odd ratios (95% CIs) for short or long sleep duration compared to normal sleep duration (6–7 hours) according to selected corre-lates.
(PDF)
S4 Table. Phase sensitivity analysis among women: odd ratios (95% CIs) for short or long sleep duration compared to normal sleep duration (6–7 hours) according to selected corre-lates.
(PDF)
Acknowledgments
This study was supported by the National Genome Research Institute, Korea Center for Dis-ease Control and Prevention. We would like to thank the participants and all members of the HEXA Study Group.
Author Contributions
Conceived and designed the experiments: HSY JKL DK. Analyzed the data: HSY JJY MS. Wrote the paper: HSY JJY MS HWL. Contributed to interpretation of the results: SH SAL JYC. Contributed to the editing of the manuscript: JJY HWL JKL DK.
References
1. Franco OH, Wong YL, Kandala NB, Ferrie JE, Dorn JM, Kivimäki M, et al. Cross-cultural comparison of correlates of quality of life and health status: the Whitehall II Study (UK) and the Western New York Health Study (US). Eur J Epidemiol. 2012; 27: 255–265. doi:10.1007/s10654-012-9664-zPMID: 22392587
2. Fang J, Wheaton AG, Keenan NL, Greenlund KJ, Perry GS, Croft JB. Association of sleep duration and hypertension among US adults varies by age and sex. Am J Hypertens. 2012; 25: 335–341. doi:10. 1038/ajh.2011.201PMID:22052075
3. Stranges S, Dorn JM, Shipley MJ, Kandala NB, Trevisan M, Miller MA, et al. Correlates of short and long sleep duration: a cross-cultural comparison between the United Kingdom and the United States: the Whitehall II Study and the Western New York Health Study. Am J Epidemiol. 2008; 168: 1353– 1364. doi:10.1093/aje/kwn337PMID:18945686
4. Hayashino Y, Yamazaki S, Takegami M, Nakayama T, Sokejima S, Fukuhara S. Association between number of comorbid conditions, depression, and sleep quality using the Pittsburgh Sleep Quality Index:
Correlates of Sleep Duration
Results from a population-based survey. Sleep Med. 2010; 11: 366–371. doi:10.1016/j.sleep.2009.05. 021PMID:20219425
5. Park SE, Kim HM, Kim DH, Kim J, Cha BS, Kim DJ. The association between sleep duration and gener-al and abdomingener-al obesity in Koreans: data from the Korean Nationgener-al Hegener-alth and Nutrition Examination Survey, 2001 and 2005. Obesity (Silver Spring). 2009; 17: 767–771. doi:10.1038/oby.2008.586PMID: 19180067
6. Cappuccio FP, Taggart FM, Kandala NB, Currie A, Peile E, Stranges S, et al. Meta-analysis of short sleep duration and obesity in children and adults. Sleep. 2008; 31: 619–626. PMID:18517032
7. Cappuccio FP, Stranges S, Kandala NB, Miller MA, Taggart FM, Kumari M, et al. Gender-specific asso-ciations of short sleep duration with prevalent and incident hypertension: the Whitehall II Study. Hyper-tension. 2007; 50: 693–700. PMID:17785629
8. Yaggi HK, Araujo AB, McKinlay JB. Sleep duration as a risk factor for the development of type 2 diabe-tes. Diabetes Care. 2006; 29: 657–661. PMID:16505522
9. Knutson K, Ryden A, Mander B, Van C. Role of sleep duration and quality in the risk and severity of type 2 diabetes mellitus. Arch Intern Med. 2006; 166: 1768–1774. PMID:16983057
10. Arora T, Jiang CQ, Thomas GN, Lam KB, Zhang WS, Cheng KK, et al. Self-Reported long total sleep duration is associated with metabolic syndrome: The Guangzhou Biobank Cohort Study. Diabetes Care. 2011; 34: 2317–2319. doi:10.2337/dc11-0647PMID:21873559
11. Knutson K, Spiegel K, Penev P, Van Cauter E. The metabolic consequences of sleep deprivation. Sleep Med Rev. 2007; 11: 163–178. PMID:17442599
12. Stefani KM, Kim HC, Kim J, Oh K, Suh I. The influence of sex and age on the relationship between sleep duration and metabolic syndrome in Korean adults. Diabetes Res Clin Pract. 2013; 102: 250– 259. doi:10.1016/j.diabres.2013.10.003PMID:24168829
13. Tamakoshi A, Ohno Y; JACC Study Group. Self-reported sleep duration as a predictor of all-cause mor-tality: results from the JACC study, Japan. Sleep. 2004; 27: 51–54. PMID:14998237
14. Patel SR, Ayas NT, Malhotra MR, White DP, Schernhammer ES, Speizer FE, et al. A prospective study of sleep duration and mortality risk in women. Sleep. 2004; 27: 440–444. PMID:15164896
15. Kripke D, Garfinkel L, Wingard D, Klauber M, Marler M. Mortality associated with sleep duration and in-somnia. Arch Gen Psychiatry. 2002; 59: 131–136. PMID:11825133
16. Yeo Y, Ma SH, Park SK, Chang SH, Shin HR, Kang D, et al. A prospective cohort study on the relation-ship of sleep duration with all-cause and disease-specific mortality in the Korean Multi-center Cancer Cohort study. J Prev Med Public Health. 2013; 46: 271–281. doi:10.3961/jpmph.2013.46.5.271PMID: 24137529
17. Kim S, DeRoo LA, Sandler DP. Eating patterns and nutritional characteristics associated with sleep du-ration. Public Health Nutr. 2011; 14: 889–895. doi:10.1017/S136898001000296XPMID:21029511
18. Tu X, Cai H, Gao YT, Wu X, Ji BT, Yang G, et al. Sleep duration and its correlates in middle-aged and elderly Chinese women: the Shanghai Women's Health Study. Sleep Med. 2012; 13: 1138–1145. doi: 10.1016/j.sleep.2012.06.014PMID:22938861
19. Patel SR. Social and demographic factors related to sleep duration. Sleep. 2007; 30: 1077–1078. PMID:17910376
20. Stamatakis KA, Kaplan GA, Roberts RE. Short sleep duration across income, education, and race/eth-nic groups: population prevalence and growing disparities during 34 years of follow-up. Ann Epidemiol. 2007; 17: 948–955. PMID:17855122
21. Sabanayagam C, Shankar A. The association between active smoking, smokeless tobacco, second-hand smoke exposure and insufficient sleep. Sleep Med. 2011; 12: 7–11. doi:10.1016/j.sleep.2010.09. 002PMID:21144798
22. Chang S-J. Developing the Psychosocial Well-being Index (PWI) for the measurement of psychosocial distress The Korean society for preventive medicine: Measuring health indicators. 2000: 92–143, Gye-chuk, Seoul.
23. Espiritu JR. Aging-related sleep changes. Clin Geriatr Med. 2008; 24: 1–14. PMID:18035227
24. Ohayon M, Carskadon M, Guilleminault C, Vitiello M. Meta-analysis of quantitative sleep parameters from childhood to old age in healthy individuals: developing normative sleep values across the human lifespan. Sleep. 2004; 27: 1255–1273. PMID:15586779
25. Campbell SS, Murphy PJ. The nature of spontaneous sleep across adulthood. J Sleep Res. 2007; 16: 24–32. PMID:17309760
26. Patel SR, Blackwell T, Ancoli-Israel S, Stone KL; Osteoporotic Fractures in Men-MrOS Research Group. Sleep characteristics of self-reported long sleepers. Sleep. 2012; 35: 641–648. doi:10.5665/ sleep.1822PMID:22547890
Correlates of Sleep Duration