* Naslov / Address: Luísa Faria, Faculty of Psychology and Education, University of Porto, Rua Dr. Manuel Pereira da Silva 4200-392 Porto, Portugal, e-mail: [email protected]
Validation of the Emotional Skills and Competence
Questionnaire (ESCQ) in the Portuguese academic context
Luísa Faria1* and Nelson Lima Santos2 1Faculty of Psychology and Education, University of Porto, Porto, Portugal 2Fernando Pessoa University, Porto, Portugal
Abstract: The aim of this study is to present a group of validation studies of the Emotional Skills and Competence Questionnaire (ESCQ, Takšić, 2000, 2001) in the Portuguese academic context,
and to compare them with those of the original Croatian version. The Portuguese sample includes 730 students, 381 high-school students (10th and 12th graders) and 349 university students (1st and 2nd graders), from different vocational areas (Scientiic and Humanities) to whom the ESCQ was col -lectively administered during regular academic hours. The results point to good alpha values, similar to those of the original version (> .80), except for the “Ability to manage and regulate emotion” that proved to be less satisfactory (.67). The exploratory factorial structures evidenced 3 factors, explaining
together about 30% of the total variance. The conirmatory factorial analysis revealed that the best itted model has two correlated factors (.55; perception and expression), and integrates only 11 items
from the original questionnaire (r2 > .30). The internal validity and the discriminative power of the
items proved to be satisfactory. Overall, the ESCQ evidenced satisfactory results in the Portuguese academic context and good perspectives for widespread use in other settings.
Keywords: emotional intelligence; self-report; construct validity; academic context.
Validacija vprašalnika emocionalne inteligentnosti ESCQ
na vzorcu Portugalskih dijakov in študentov
Luísa Faria1 in Nelson Lima Santos2 1Faculty of Psychology and Education, University of Porto, Porto, Portugal 2Fernando Pessoa University, Porto, Portugal
Povzetek: Cilj raziskave je preveriti veljavnost vprašalnika emocionalne inteligentnosti ESCQ (Takšić,
2000, 2001) na vzorcu portugalskih študentov in jo primerjati z veljavnostjo originalne, hrvaške verzije
vprašalnika. Portugalski vzorec vključuje 730 oseb, od njih je 381 dijakov in 349 študentov različnih študijskih smeri. Udeleženci so vprašalnik reševali o okviru pouka oziroma v okviru fakultetnih ob
-veznosti. Rezultati kažejo na dobro notranjo konsistentnost lestvic, ki je podobna kot pri originalnem
vprašalniku (> ,80), razen za lestvico sposobnost upravljanja in uravnavanja emocij, kjer je notranja
konsistentnost precej nižja (,67). Eksploratorna faktorska analiza je pokazala tri faktorje, ki pojasnjujejo približno 30% celotne variance. Konirmatorna faktorska analiza pa je pokazala, da najboljši model za izbrane podatke vključuje dva, med seboj povezana faktorja (,55; zaznavanje in izražanje emocij),
nativnost teh postavk je zadovoljiva. Na splošno lahko zaključimo, da rezultati kažejo na zadovoljive
merske karakteristike portugalske verzije vprašalnika ESCQ in smiselnost njegove uporabe tudi na
drugih vzorcih in v drugačnih kontekstih.
Ključne besede: čustvena inteligentnost, samoocenjevanje, konstruktna veljavnost
CC = 3120, 2220
Emotional intelligence as “the ability to perceive emotions, to access and generate emotions so as to assist thought, to understand emotions and emotional knowledge, and to relectively regulate emotions so as to promote emotional and intellectual growth” (Mayer & Salovey, 1997, p. 5) is one of the most interesting constructs in Psychology, because it combines emotion with intelligence, accepting the fact that “emotion makes thinking more intelligent and that one thinks intelligently about emotions” (Mayer & Salovey, 1997, p. 5). Emotional intelligence is involved in several settings such as family, school, and labour, contributing to school success and positive performance in the work place, as well as to social competencies and adaptive behaviour.
The development of intelligence, and also of emotional intelligence, socially interpreted as a fundamental and valuable human resource, requires the incorpora-tion of social values and norms, which establish the criteria of success and failure, as well as the distribution of reinforcements or punishments. Consequently, it cannot be conceived independently of the social values and of the objectives of culture, in general, and of school and work contexts, in particular (Faria, 2002).
So, the individuals from different cultures have been submitted to differential socialization practices, which led them to endorse various beliefs, values, expectations and norms. It is thus expected that they value differently socially relevant attributes, such as intelligence (Salili, 1994).
One of the main challenges in the domain of emotional intelligence is to develop an instrument capable of assessing this construct in a multidimensional perspective, reuniting the dimensions of perceiving and recognizing emotions, understanding, analysing and expressing emotions, capable of capturing the speciicities of this construct in different cultural contexts.
The Emotional Skills and Competence Questionnaire (ESCQ, Takšić, 2000, 2001; Takšić, Jurin, & Cvenić, 2001) is one possible form of meeting this challenge, and its adaptation to the Portuguese academic context will be presented, with the main aim of developing a measure capable of assessing emotional competence in the Portuguese context.
The aims of this study are to present the results of a group of validation studies of the ESCQ to the Portuguese academic context and to compare them with those of the original Croatian version, presenting for the irst time the results of conirma
tory factor analyses (Faria & Lima Santos, 2006; Faria et al., 2006; Lima Santos & Faria, 2005).
We’ll explore the psychometric qualities of the ESCQ – internal consistency by Cronbach’s alpha, construct validity by exploratory and conirmatory factor analyses, internal validity of the items, and sensibility. Some guidelines will be drawn for the future use of the ESCQ in several contexts.
Method
Sample
The Portuguese sample includes 730 students, 61% females and 39% males (Table 1). As regards age, 28.6% are from 15 to 16 years old, 36.7% are 17 or 18 years old, and 34.2% are older than 18 years.
The subjects are high-school or secondary students (29.7% 10th graders and
22.5% 12th graders), and university students (33.7% in the 1st year and 14.1% in the
2nd year). The latter are undergraduate students in Psychology (29.8%), in Sport and Physical Education (29.2%), in Dental Medicine (26.6%) and in Engineering and
Architecture (14.3%).
Regarding vocational options in secondary level, 71.6% attend or attended Sci
-entiic-Natural studies, 24.0% Humanities, 2.1% Economic-Social and 1.1% Arts. In their majority, they are students who never failed (68.4%) and who appear to have an optimistic expectative with regard to their future school results (58.9%).
In terms of social status, 33.4% are students whose familial group presents a High socio- professional status (SPS), 43.6% a Medium SPS and 22.9% a Low SPS, whereas 24.0% are students who come from families which have a High socio-cul-tural status (SCS), 19.9% a Medium-High SCS, 19.5% a Medium SCS, and 36.2% a Medium-Low SCS.
Globally, the Medium SPS and the Medium-Low SCS are the most repre-sented ones both in the female and in the male samples, and the Medium SPS and the Medium-Low SCS are the most represented ones both in secondary school and in university.
From the 730 students of the sample, 33.8% have professional experience.
Instrument and procedure
Table 1. Sample distribution by sex, socio-professional status (SPS), school grade and level of education
Females Males Total
Level of Education
H SPS
M SPS
L
SPS Total H SPS
M SPS
L
SPS Total H SPS
M SPS
L
SPS Total Secondary 10th grade 39 62 51 152 22 26 17 65 61 88 68 217
12th grade 29 43 29 101 17 31 14 62 46 74 43 163
Total 68 105 80 253 39 57 31 127 107 162 111 380 University 1st grade 49 40 18 107 54 62 23 139 103 102 41 246
2nd grade 27 46 12 85 7 8 3 18 34 54 15 103
Total 76 86 30 192 61 70 26 157 137 156 56 349 Total 10th grade 39 62 51 152 22 26 17 65 61 88 68 217
12th grade 29 43 29 101 17 31 14 62 46 74 43 163
1st grade 49 40 18 107 54 62 23 139 103 102 41 246
2nd grade 27 46 12 85 7 8 3 18 34 54 15 103
Total 144 191 110 445 100 127 57 284 244 318 167 729a
Note. H SPS – High SPS; M SPS – Medium SPS; L SPS – Low SPS.
a1 omission in the SPS variable.
It was collectively administered together with a socio-demographic question-naire, in whole classes, during regular school hours, the instructions being read aloud and conidentiality and anonymity being guaranteed.
The English version of the scale (Takšić, 2001) was translated into Portuguese and back-translated into English, through the collaboration of the Portuguese and Croatian authors (Van de Vjver & Hambleton, 1996).
Results and discussion
Reliability – Internal consistency
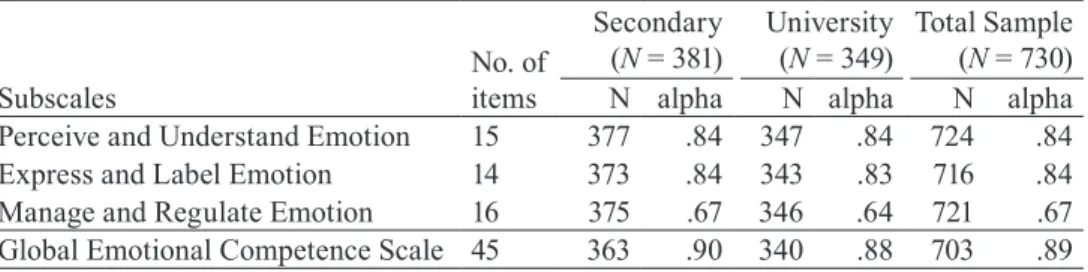
In Table 2 we can observe the alpha values for the dimensions of the ESCQ, according to school grade. The dimensions of Ability to Perceive and Understand
Emotion (15 items) and Ability to Express and Label Emotion (14 items) present the highest alpha values in every sample, and the dimension of Ability to Manage and
Regulate Emotions (16 items) has the lowest alpha value of all, exactly as in Takšić
(2001) studies (Table 3), probably evidencing the diverse nature of the items that involve both positive and negative emotions in interpersonal situations.
The alpha values for theGlobal Emotional CompetenceScale are the highest ones and appear to be slightly superior to those of the Croatian samples.
Table 2. Alpha values for the secondary school, university and total samples
No. of items
Secondary (N = 381)
University (N = 349)
Total Sample (N = 730)
Subscales N alpha N alpha N alpha
Perceive and Understand Emotion 15 377 .84 347 .84 724 .84
Express and Label Emotion 14 373 .84 343 .83 716 .84
Manage and Regulate Emotion 16 375 .67 346 .64 721 .67
Global Emotional Competence Scale 45 363 .90 340 .88 703 .89
Generally, we can afirm that the alpha values obtained suggest that the items are consistent with the dimensions to which they belong, indicating a good internal consistency for the dimensions of Ability to Perceive and Understand Emotion and
0
Table 3. Alpha values found in Takšić (2001) studies
N = 834a N = 193b
Subscales alpha alpha
Perceive and Understand Emotion .87 .88
Express and Label Emotion .79 .79
Manage and Regulate Emotion .74 .71
Global Emotional Competence Scale .89 .88
aRepresentative sample of secondary school students, from 15 to 19 years of age. bSample of university students.
Validity
Principal components factor analysis
The exploratory factor analysis for each subsample – secondary and university – (Tables 4 and 5) extracted three factors by Varimax rotation, which explain almost 30% of the total variance of the results (29.9% for the total sample; 30.7% for the secondary school sample; and 29.9% for the university one).
The factorial structure found for the secondary sample is more similar to that of the total sample than to the one obtained for the university one. Therefore, we’ll present only the factorial structures for the two subsamples.
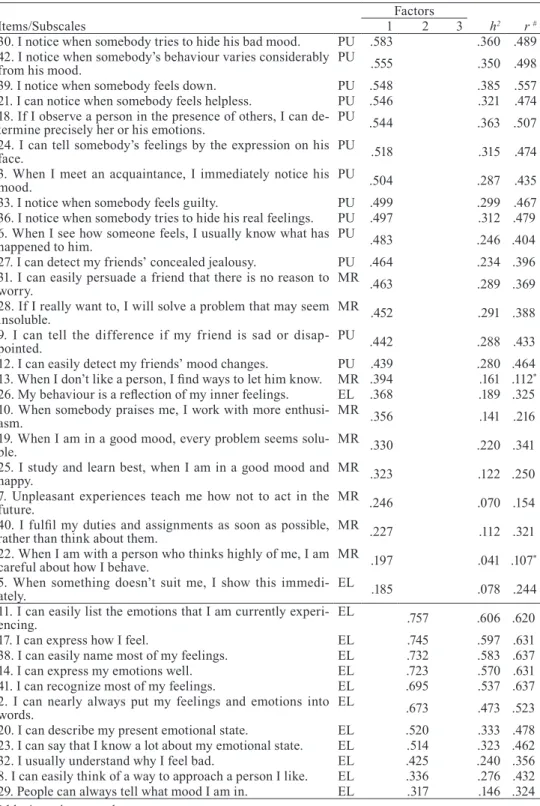
In the factorial structure obtained for the secondary sample (Table 4), Fac-tor 1 gathers 24 items: 13 of the dimension of Ability toPerceive and Understand
Emotion, 9 of the dimension of Ability toManage and Regulate Emotion, and 2 of the dimension of Ability toExpress and Label Emotion; Factor 2 presents 11 items of the dimension of Ability to Express and Label Emotion; Factor 3 mixes seven items of the dimension of Ability toManage and Regulate Emotion, two items of the dimension of Ability toPerceive and Understand Emotion, and one item of the dimension of Ability to Express and Label Emotion. All these factors have alpha values higher than .96.
The factorial structure found for the university sample (Table 5) extracts factors with fewer mixtures, although none of these factors is loaded by items belonging to just one dimension, as it is the case for Factor 2 in the secondary sample. Thus, for Factor 1 there are 12 items of the dimension of Ability toExpress and Label Emotion and 5 items of the dimension of Ability toManage and Regulate Emotion; for Factor 2 we can observe 14 items of the dimension of Ability toPerceive and Understand
Emotion, 2 items of the dimension of Ability toManage and Regulate Emotion, and 1 item of the dimension of Ability toExpress and Label Emotion; and for Factor 3 we can see nine items of the dimension of Ability toManage and Regulate Emotion
and 1 item of each of the dimensions of Ability toExpress and Label and of Ability
to Perceive and Understand Emotion. All these factors have alpha values higher than .97.
As we can see, in both factorial structures we ind mixtures of the three di -mensions. However, the secondary sample seems to mix, on one hand, more aspects related with the perception and understanding of others’ emotions, attributing more importance to these aspects which compose the irst factor, and, on the other hand, seems to differentiate better the aspects related to emotional expression, isolating them in the second factor. In its turn, the university sample appears to associate more aspects related to expressing one’s own emotions, reuniting them in the irst factor, and to differentiate more aspects related with emotional perception and understand-ing, 14 of the 15 items of this dimension being mixed in the second factor.
It is also to be noticed that Factor 3 is very similar in both samples, present-ing 8 common items, which in their majority belong to the dimension of Ability to
Manage and Regulate Emotion, especially in the sense of maintaining a state of optimistic spirit and of “good humor”.
To sum up, we can organize the observations in the following way: (i) the secondary students distinguish more the aspects related to emotional expression and the university students distinguish more the aspects related to emotional perception and understanding; (ii) the various dimensions of emotional competence seem to assume different levels of importance as school grade increases, although the aspects related to “maintaining good humor” (included in the dimension of Ability toManage
and Regulate Emotion) are considered to be the less important for both samples; and (iii) the instrument appears to be sensible to differentiating various dimensions of emotional competence, succeeding in identifying the more and the less important dimensions for students, as a function of the school context they attend (secondary
2
Table 4. Factor analysis in principal components after Varimax rotation and index of item internal validity (secondary sample, N = 381)
Factors
Items/Subscales 1 2 3 h2 r #
30. I notice when somebody tries to hide his bad mood. PU .583 .360 .489 42. I notice when somebody’s behaviour varies considerably
from his mood.
PU .555 .350 .498
39. I notice when somebody feels down. PU .548 .385 .557
21. I can notice when somebody feels helpless. PU .546 .321 .474 18. If I observe a person in the presence of others, I can
de-termine precisely her or his emotions.
PU
.544 .363 .507
24. I can tell somebody’s feelings by the expression on his face.
PU
.518 .315 .474
3. When I meet an acquaintance, I immediately notice his mood.
PU
.504 .287 .435
33. I notice when somebody feels guilty. PU .499 .299 .467
36. I notice when somebody tries to hide his real feelings. PU .497 .312 .479 6. When I see how someone feels, I usually know what has
happened to him.
PU
.483 .246 .404
27. I can detect my friends’ concealed jealousy. PU .464 .234 .396 31. I can easily persuade a friend that there is no reason to
worry.
MR
.463 .289 .369
28. If I really want to, I will solve a problem that may seem insoluble.
MR
.452 .291 .388
9. I can tell the difference if my friend is sad or disap-pointed.
PU
.442 .288 .433
12. I can easily detect my friends’ mood changes. PU .439 .280 .464
13. When I don’t like a person, I ind ways to let him know. MR .394 .161 .112* 26. My behaviour is a relection of my inner feelings. EL .368 .189 .325 10. When somebody praises me, I work with more
enthusi-asm.
MR .356 .141 .216
19. When I am in a good mood, every problem seems solu-ble.
MR .330 .220 .341
25. I study and learn best, when I am in a good mood and happy.
MR
.323 .122 .250
7. Unpleasant experiences teach me how not to act in the future.
MR
.246 .070 .154
40. I fulil my duties and assignments as soon as possible,
rather than think about them.
MR
.227 .112 .321
22. When I am with a person who thinks highly of me, I am careful about how I behave.
MR
.197 .041 .107*
5. When something doesn’t suit me, I show this immedi-ately.
EL .185 .078 .244
11. I can easily list the emotions that I am currently experi-encing.
EL
.757 .606 .620
17. I can express how I feel. EL .745 .597 .631
38. I can easily name most of my feelings. EL .732 .583 .637
14. I can express my emotions well. EL .723 .570 .631
41. I can recognize most of my feelings. EL .695 .537 .637
2. I can nearly always put my feelings and emotions into words.
EL
.673 .473 .523
20. I can describe my present emotional state. EL .520 .333 .478 23. I can say that I know a lot about my emotional state. EL .514 .323 .462
32. I usually understand why I feel bad. EL .425 .240 .356
8. I can easily think of a way to approach a person I like. EL .336 .276 .432 29. People can always tell what mood I am in. EL .317 .146 .324
L. Faria and N. Lima Santos
43. I try to keep up a good mood. MR .751 .567 .422 1. I can maintain a good mood even if something bad
hap-pens.
MR .675 .456 .347
34. I try to contain unpleasant emotions, and reinforce posi-tive ones.
MR .587 .366 .353
44. I know how to pleasantly surprise each of my friends. PU .491 .375 .450
16. When I am in a good mood, it is dificult to bring my
mood down.
MR .480 .251 .342
4. I can maintain a good mood, even when the people around me are in a bad mood.
MR
.471 .222 .274
15. I can easily think of a way to make my friend happy on his birthday.
PU
.442 .400 .466
37. There is nothing wrong with how I usually feel. MR .425 .249 .351 45. As far as I am concerned, it is normal to feel the way I
am feeling now.
MR
.381 .200 .281
35. I have found it easy to display fondness for a person of the opposite sex.
EL
.358 .274 .416
Eigen Values 5.30 4.95 3.55
% Total Variance 11.8 11.0 7.9 ∑ = 30.66
# All the correlation coeficients present a p < .01, except those marked with asterisk, whose p <.05.
Table 5. Factor analysis in principal components after Varimax rotation and index of item internal validity (university sample, N = 349)
Factors
Items/Subscales 1 2 3 h2 r #
11. I can easily list the emotions that I am currently experi-encing.
EL
.760 .590 .646
17. I can express how I feel. EL .744 .577 .643
14. I can express my emotions well. EL .728 .571 .659
38. I can easily name most of my feelings. EL .685 .509 .624 2. I can nearly always put my feelings and emotions into
words.
EL
.667 .461 .557
20. I can describe my present emotional state. EL .645 .462 .567 41. I can recognize most of my feelings. EL .584 .456 .588 23. I can say that I know a lot about my emotional state. EL .485 .351 .476
40. I fulil my duties and assignments as soon as possible,
rather than think about them.
MR
.410 .220 .233
32. I usually understand why I feel bad. EL .410 .270 .380 8. I can easily think of a way to approach a person I like. EL .369 .246 .410 5. When something doesn’t suit me, I show this
immedi-ately.
EL
.323 .105 .220
10. When somebody praises me, I work with more enthusi-asm.
MR
.316 .137 .135*
26. My behaviour is a relection of my inner feelings. EL .275 .092 .247 25. I study and learn best, when I am in a good mood and
happy.
MR
.264 .098 .207
13. When I don’t like a person, I ind ways to let him know. MR .243 .067 .136*
7. Unpleasant experiences teach me how not to act in the future.
MR
.240 .090 .210
39. I notice when somebody feels down. PU .684 .478 .526
21. I can notice when somebody feels helpless. PU .661 .459 .556 12. I can easily detect my friend’s mood changes. PU .622 .438 .558 9. I can tell the difference if my friend is sad or
disap-pointed.
PU
.580 .375 .482
42. I notice when somebody’s behaviour varies considerably from his mood.
PU
.577 .367 .497
3. When I meet an acquaintance, I immediately notice his mood.
PU
.570 .352 .511
24. I can tell somebody’s feelings by the expression on his face.
PU
.566 .348 .508
6. When I see how someone feels, I usually know what has happened to him.
PU
.555 .328 .465
36. I notice when somebody tries to hide his real feelings. PU .544 .334 .494 33. I notice when somebody feels guilty. PU .542 .352 .511 30. I notice when somebody tries to hide his bad mood. PU .529 .343 .454 18. If I observe a person in the presence of others, I can
determine precisely her or his emotions.
PU
.512 .311 .467
31. I can easily persuade a friend that there is no reason to worry.
MR
.409 .240 .222
44. I know how to pleasantly surprise each of my friends. PU .326 .263 .378 15. I can easily think of a way to make my friend happy on
his birthday.
PU
.233 .131 .259
29. People can always tell what mood I am in. EL .175 .077 .236 22. When I am with a person who thinks highly of me, I am
careful about how I behave.
MR
.118 .018 .098
1. I can maintain a good mood even if something bad hap-pens.
MR
.660 .452 .268
43. I try to keep up a good mood. MR .645 .434 .439
34. I try to contain unpleasant emotions, and reinforce posi-tive ones.
MR
.518 .297 .350
4. I can maintain a good mood, even when the people around me are in a bad mood.
MR
.506 .278 .267
37. There is nothing wrong with how I usually feel. MR .472 .258 .305
16. When I am in a good mood, it is dificult to bring my
mood down.
MR
.441 .221 .279
35. I have found it easy to display fondness for a person of the opposite sex.
EL
.376 .263 .364
28. If I really want to, I will solve a problem that may seem insoluble.
MR
.358 .236 .354
45. As far as I am concerned, it is normal to feel the way I am feeling now.
MR
.326 .164 .318
27. I can detect my friends’ concealed jealousy. PU .325 .205 .295 19. When I am in a good mood, every problem seems
soluble.
MR
.293 .141 .346
Eigen Values 5.19 4.96 3.32
% Total Variance 11.5 11.0 7.4 ∑ = 29.92
Note. PU – Perceive and Understand; MR – Manage and Regulate; EL – Express and Label.
Conirmatory Factor Analysis
Conirmatory Factor Analysis (CFA) using EQS 6.1 was undertaken for the total sample, because of the more representative nature of it and considering also the need for a higher contingent of subjects to perform CFA (N = 730), to verify the factor structure of the ESCQ, complementing and clarifying the factorial structure obtained with the exploratory factor analysis.
The best itted model for the total sample has two correlated factors (.55) and integrates only 11 items from the original scale (Table 6, Figures 1 and 2), leaving out the Manage and Regulate Emotion scale and several items originally belonging to the other two dimensions, that evidenced high error variances and low loadings in the expected factors. These 11 items represent only two of the three original dimen-sions: “Ability to Express and Label Emotion” (F2 with seven items), and “Ability to Perceive and Understand Emotion” (F3 with four items). The 7 items of F2 are related with the expression and the description of emotions (e. g., express emotions with words, express well emotions, express the way I feel, describe my emotional state). The four items of F3 are related with the perception of emotions (e. g., to perceive humor changes in my friends, to perceive when someone feels upset).
The original factor of “Ability to Manage and Regulate Emotion” evidenced items with low loadings (< .30) and high error variances, conirming previous re -sults in the domain, and showing that is more dificult to represent this dimensions using self-report items. The alpha values for F2 (.86) and F3 (.72) are acceptable. The reconigured model obtained in this study should be tested in further studies with new samples (Figure 2). The evaluation of the dimension of “Ability to Manage and Regulate Emotion” should be reconsidered in the future, probably using other techniques, rather than self-report items.
Table 6. Adjusted it indexes for the theoretical and the reconigured models of the ESCQ
Models χ2 gl χ2/gl CFI RMR
st RMSEA
Theoretical 2869.8* 940 3 .74 .06 .05
Reconigured 266.8* 42 6 .92 .05 .09
Note. CFI – Comparative Fit Index; RMRst – Root Mean-Squared Residuals (standardized); RMSEA – Root Mean-Squared Error of Approximation.
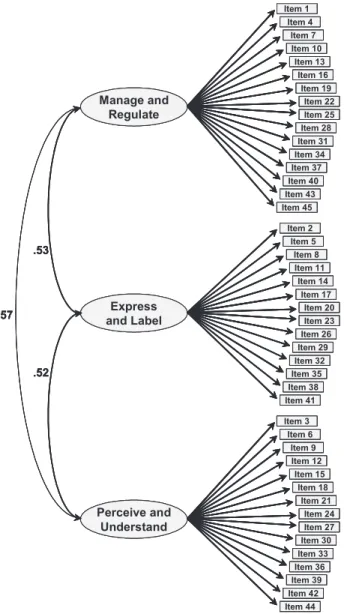
Figure 1. Theoretical model of the ESCQ and correlations among factors.
Internal validity of the items
The indicators of item internal validity (Tables 4 and 5) are, in their majority, superior to .40in the studied samples, indicating a string correlation between the items and the three dimensions ofEmotional Competence. Items 7 (“Unpleasant
experiences teach me what I mustn’t do.”), 10 (“When somebody praises me I work
with more enthusiasm.”), 13 (“When I do not like a person I try to show this to
him/her.”), and 22 (“When I stay with someone who admires me I am careful about
Manage and
Regulate Item 25
Item 22 Item 19 Item 16 Item 13 Item 10 Item 7 Item 4 Item 1 Item 45 Item 43 Item 40 Item 37 Item 34 Item 31 Item 28 Express
and Label Item 23
Item 20 Item 17 Item 14 Item 11 Item 8 Item 5 Item 2 Item 41 Item 38 Item 35 Item 32 Item 29 Item 26 Perceive and
Understand Item 27
Item 24 Item 21 Item 18 Item 15 Item 12 Item 9 Item 6 Item 3 Item 44 Item 42 Item 39 Item 36 Item 33 Item 30 .53 .52 .57 Manage and
Regulate Item 25
Item 22 Item 19 Item 16 Item 13 Item 10 Item 7 Item 4 Item 1 Item 45 Item 43 Item 40 Item 37 Item 34 Item 31 Item 28 Manage and
Regulate Item 25
Item 22 Item 19 Item 16 Item 13 Item 10 Item 7 Item 4 Item 1 Item 45 Item 43 Item 40 Item 37 Item 34 Item 31 Item 28 Item 25 Item 22 Item 19 Item 16 Item 13 Item 10 Item 7 Item 4 Item 1 Item 45 Item 43 Item 40 Item 37 Item 34 Item 31 Item 28 Express
and Label Item 23
Item 20 Item 17 Item 14 Item 11 Item 8 Item 5 Item 2 Item 41 Item 38 Item 35 Item 32 Item 29 Item 26 Express
and Label Item 23
Item 20 Item 17 Item 14 Item 11 Item 8 Item 5 Item 2 Item 41 Item 38 Item 35 Item 32 Item 29 Item 26 Item 23 Item 20 Item 17 Item 14 Item 11 Item 8 Item 5 Item 2 Item 41 Item 38 Item 35 Item 32 Item 29 Item 26 Perceive and
Understand Item 27
Item 24 Item 21 Item 18 Item 15 Item 12 Item 9 Item 6 Item 3 Item 44 Item 42 Item 39 Item 36 Item 33 Item 30 Perceive and
Understand Item 27
Item 24 Item 21 Item 18 Item 15 Item 12 Item 9 Item 6 Item 3 Item 44 Item 42 Item 39 Item 36 Item 33 Item 30 Item 27 Item 24 Item 21 Item 18 Item 15 Item 12 Item 9 Item 6 Item 3 Item 44 Item 42 Item 39 Item 36 Item 33 Item 30 .53 .52 .57 .53 .52 .57
the way I behave.”), all of them belonging to the dimension of Ability toManage
and Regulate Emotion, present the worst indicators of internal validity, suggesting that they worse represent this dimension. As we can see, they are items that refer to aspects related to ways of behaviour, especially in situations that involve either an evaluation of the “other” or being evaluated by the “other”.
The items of the other two dimensions, Ability toPerceive and Understand and Ability to Express and Label Emotion, present satisfactory or good internal validity indicators, reinforcing the good internal consistency already presented by these two dimensions.
Sensibility: Descriptive statistics for the dimensions and discriminative power of
the items
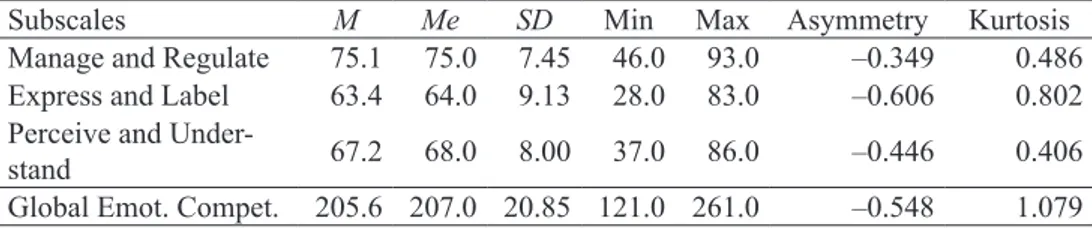
If we observe Tables 7 and 8, we can verify that for the two samples: (i) the values of the mean and of the median are close to each other for all the dimensions of emotional competence; (ii) the minimum and the maximum values are at great distance one from another; and (iii) the coeficients of asymmetry and kurtosis are mostly inferior to the unity.
It is also to be noticed that in the university sample the minimum values are always higher in comparison with those of the secondary sample.
As for the discriminative power of the items we can conclude that: (i) the most chosen answer alternatives are “Frequently” and “Always”, showing that, in general, subjects perceive themselves as competent with regard to perceiving and
Figure 2. Reconigured model of the ESCQ and correlation between the two factors.
.55
Perceive and Understand
Item 42 Item 39 Item 21 Item 12 Express
and Label
Item 41 Item 38
Item 20 Item 17 Item 14 Item 11 Item 2
.55 .55
Perceive and Understand
Item 42 Item 39 Item 21 Item 12
Perceive and Understand
Item 42 Item 39 Item 21 Item 12
Item 42 Item 39 Item 21 Item 12 Express
and Label
Item 41 Item 38
Item 20 Item 17 Item 14 Item 11 Item 2
Express and Label
Item 41 Item 38
Item 20 Item 17 Item 14 Item 11 Item 2
Item 41 Item 38
understanding others’ emotions and expressing and managing their own emotions; (ii) the items 1, 13 and 40 (belonging to the dimension of Ability toManage and
Regulate Emotion), 6, 18, 24, 30, 33 and 36 (belonging to Ability toPerceive and
Understand Emotion), and 11 and 29 (belonging to Ability to Express and Label
Emotion) concentrate greater percentage of responses in central alternatives (“Oc-casionally” and “Usually”), in all samples; (iii) the university sample, when com-pared to the secondary one, reveals low percentages of higher response alternatives (“Frequently” and “Always”,) and greater percentages of central response alternatives (“Occasionally” and “Usually”).
Correlations among the dimensions of the instrument
Analyzing Table 9, we can observe that the dimensions of Emotional Compe
-tence are all signiicantly and positively correlated in the two samples.
In the secondary sample, the highest correlations appear between the dimen-sion of Ability toManage and Regulate Emotion and Ability toPerceive and Un
-derstand Emotion, whereas, in the university sample they appear between Ability
toManage and Regulate Emotion and Ability toExpress and Label Emotion. These results support the evidence already observed in the exploratory factor analysis for the secondary and university samples, indicating that students with a higher level of instruction associate more the capacity of managing and regulating their emotions with the capacity of expressing these emotions, while the other students associate
Table 7. Measures of central tendency, dispersion and distribution (secondary sample – N = 381)
Subscales M Me SD Min Max Asymmetry Kurtosis
Manage and Regulate 75.1 75.0 7.45 46.0 93.0 –0.349 0.486
Express and Label 63.4 64.0 9.13 28.0 83.0 –0.606 0.802
Perceive and
Under-stand 67.2 68.0 8.00 37.0 86.0 –0.446 0.406
Global Emot. Compet. 205.6 207.0 20.85 121.0 261.0 –0.548 1.079
Table 8. Measures of central tendency, dispersion and distribution (university sample – N = 349)
Subscales M Me SD Min Max Asymmetry Kurtosis
Manage and Regulate 72.9 73.0 6.48 56.0 96.0 0.153 0.312
Express and Label 63.0 64.0 7.85 36.0 84.0 –0.263 0.218
Perceive and
Under-stand 65.4 66.0 7.40 39.0 90.0 0.024 0.728
more the managing and regulation of their emotions with the perception and under-standing of them.
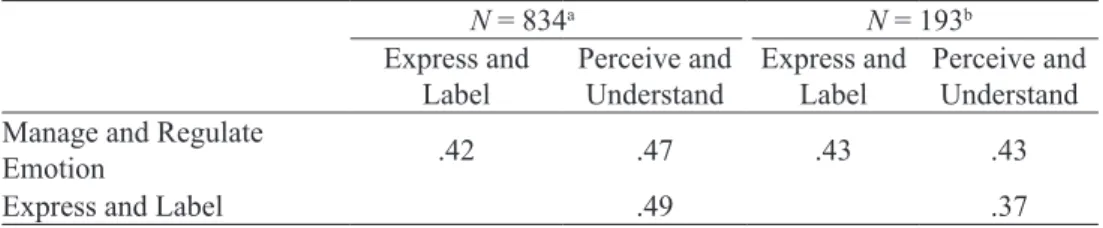
The correlations observed by Takšić (2001), among the various dimensions of emotional competence are, in general, lower than those observed in our study (Table 10) and are similar to one another for the various samples studied by the author.
It is also to be noticed that, in general, the university sample presents lower correlation coeficients. This fact may be related to university students differentiating more the various dimensions of their competence in the emotional domain.
Table 9. Correlations among the subscales – secondary and university (in brackets)
Express and Label
Perceive and Understand
Global Emotional Competence Manage and Regulate .52* (.55*) .63* (.47*) .83* (.81*)
Express and Label .59* (.44*) .85* (.83*)
Perceive and Understand .87* (.79*)
* p < .01.
Table 10. Correlations among the subscales for different samples studied by Takšić (2001)
N = 834a N = 193b
Express and Label
Perceive and Understand
Express and Label
Perceive and Understand Manage and Regulate
Emotion .42 .47 .43 .43
Express and Label .49 .37
a Representative sample of secondary school students from 15 to 19 years of age. b Sample of university students.
Conclusions
Overall, the results of the Portuguese validation studies regarding ESCQ point to good alpha values, similar to those of the original version (>.80), except for the
Ability to Manage and Regulate Emotion that proved to be less satisfactory (.67). As already stated, this fact is probably due to the diversity and interpersonal complex-ity of the items’ contents. We face a dilemma already asserted by Cronbach, either reducing the evaluation of the dimensions to homogeneous situations, guaranteeing the internal consistency and homogeneity of the scales, or opening the spectrum of situations evaluated by the items and facing the reduction of internal consistency. The future use of other complementary techniques to evaluate the Ability to Manage
70
The exploratory factorial structures evidenced three factors, explaining to-gether about 30% of the total variance. Due to the unsatisfactory results of these analyses (lower explained variance and factors with mix dimensions), we undertake CFA whose results, also unsatisfactory (low loadings and high error variances of the items), need further replication in the future, especially to explore the dimension of
Ability to Manage and Regulate Emotion.
The internal validity and the discriminative power of the items proved to be satisfactory. The positive correlations among the three dimensions evidenced higher values than those of the original version.
Overall, the ESCQ evidenced satisfactory results in the Portuguese academic context, but the Ability to Manage and Regulate Emotion subscale needs further improvement in the future. It would be interesting to pursue the validation studies of the ESCQ via conirmatory factor analysis, as well as the analysis of structure invariance according to academic grade, because some differences were observed in the factorial structures of secondary and university subsamples.
Finally, we can conclude that ESCQ is a multidimensional instrument capable of measuring emotional competence in the Portuguese cultural context, and allowing the pursuing of cross-cultural studies in the near future.
References
Faria, L. (2002). Teorias implícitas da inteligência [Implicit theories of intelligence]. Paid-éia, 12, 93-103.
Faria, L., & Lima Santos, N. (2006).Competência emocional: Adaptação e validação in-tercultural do Emotional Skills and Competence Questionnaire (ESCQ). [Emotion-al competence: Adaptation and v[Emotion-alidation of the Emotion[Emotion-al Skills and Competence Questionnaire (ESCQ)]. In C. Machado, L. Almeida, M. A. Guisande, M. Gon-çalves, & V. Ramalho (Eds.), Actas da XI Conferência Internacional de Avaliação Psicológica: Formas e Contextos (pp. 349-356). Braga: Psiquilíbrios Edições.
Faria, L., Lima Santos, N., Takšic, V., Räty, H., Molander, B., Holmström, S., Jansson, J.,
Avsec, A., Extremera, N., Fernández-Barrocal, P., & Toyota, H. (2006). Cross-cul-tural validation of the Emotional Skills and Competence Questionnaire (ESCQ). Psicologia, 20(2), 95-127.
Lima Santos, N., & Faria, L. (2005). Inteligência emocional: Adaptação do “Emotional Skills and Competence Questionnaire” (ESCQ) ao contexto português. [Emotional intelligence: Adaptation of the “Emotional Skills and Competence Questionnaire” (ESCQ) to the Portuguese context]. Revista da Faculdade de Ciências Humanas e Sociais da UFP, 2, 275-289.
Mayer, J. D., & Salovey, P. (1997). What is emotional intelligence? In P. Salovey & D. J.
Sluyter (Eds.), Emotional development and emotional intelligence: Educational implications. New York, NY: BasicBooks.
Salili, F. (1994). Age, sex, and cultural differences in the meaning and dimensions of achievement. Personality and Social Psychology Bulletin, 20, 635-648.
Takšić, V. (2000, May). Convergent and divergent validity of the Emotional Skills and Competence Questionnaire. Paper presented at the 12th Days of Psychology, Za -dar, Croatia.
Takšić, V. (2001, July). Emotional Skills and Competence Questionnaire. Poster presented at the 7th European Congress of Psychology, London, United Kingdom.
Takšić, V., Jurin, Z., & Cvenić, S. (2001). Opercionalizacija i faktorsko-analiticka studija
konstrukta emocionalne inteligencije [Operationalization and factor-analytic study of the emotional intelligence construct]. Psihologijske Teme, 8-9, 95-109.
Van de Vjever, F., & Hambleton, R. K. (1996) Translating tests: Some practical guide-lines. European Psychologist, 1, 89-99.