A Method for Similarity Search of Genomic
Positional Expression Using CAGE
Shigeto Seno1, Yoichi Takenaka1, Chikatoshi Kai2, Jun Kawai2,3, Piero Carninci2,3, Yoshihide Hayashizaki2,3, Hideo Matsuda1*
1Department of Bioinformatic Engineering, Graduate School of Information Science and Technology, Osaka University, Osaka, Japan,2Genome Exploration Research Group (Genome Network Project Core Group), RIKEN Genomic Sciences Center, RIKEN Yokohama Institute, Yokohama, Japan,3Genome Science Laboratory, Discovery Research Institute, RIKEN Wako Institute, Wako, Japan
With the advancement of genome research, it is becoming clear that genes are not distributed on the genome in random order. Clusters of genes distributed at localized genome positions have been reported in several eukaryotes. Various correlations have been observed between the expressions of genes in adjacent or nearby positions along the chromosomes depending on tissue type and developmental stage. Moreover, in several cases, their transcripts, which control epigenetic transcription via processes such as transcriptional interference and genomic imprinting, occur in clusters. It is reasonable that genomic regions that have similar mechanisms show similar expression patterns and that the characteristics of expression in the same genomic regions differ depending on tissue type and developmental stage. In this study, we analyzed gene expression patterns using the cap analysis gene expression (CAGE) method for exploring systematic views of the mouse transcriptome. Counting the number of mapped CAGE tags for fixed-length regions allowed us to determine genomic expression levels. These expression levels were normalized, quantified, and converted into four types of descriptors, allowing the expression patterns along the genome to be represented by character strings. We analyzed them using dynamic programming in the same manner as for sequence analysis. We have developed a novel algorithm that provides a novel view of the genome from the perspective of genomic positional expression. In a similarity search of expression patterns across chromosomes and tissues, we found regions that had clusters of genes that showed expression patterns similar to each other depending on tissue type. Our results suggest the possibility that the regions that have sense–antisense transcription show similar expression patterns between forward and reverse strands.
Citation: Seno S, Takenaka Y, Kai C, Kawai J, Carninci P, et al. (2006) A method for similarity search of genomic positional expression using CAGE. PLoS Genet 2(4): e44. DOI: 10.1371/journal.pgen.0020044
Introduction
Advancements in genomic research have provided evidence that genes are not randomly distributed in the genome. In prokaryotes, clusters of coexpressed genes are mainly due to the presence of operons. Genes distributed within the same operon are transcribed together and are thus coregulated. Positional clustering analysis of genes on the chromosome helps detect functionally coupled genes and takes advantage of the fact that functionally related genes frequently inhabit the same neighborhood of the chromosome.
In general, eukaryotes lack operons. In eukaryotes, except in the case of tandem duplication, genes appear to be transcribed individually and are thought to be scattered throughout the chromosomes without apparent organization according to function or positional expression. However, positional clustering has recently been reported in several eukaryotes, including Saccharomyces cerevisiae [1,2], Drosophila
melanogaster[3,4],Caenorhabditis elegans[5–7],Mus musculus[8– 12], and Homo sapiens [13–16]. Cho et al. [1] first showed clustering of coexpressed yeast genes on a genome-wide scale. Such clustering was also reported by Cohen et al. [2], who computationally analyzed whole-genome gene expression using the same dataset. Using chromosome correlation maps, which display the correlations between the expression patterns of genes on the same chromosome, they found that adjacent or nearby nonadjacent pairs of genes showed similar expression patterns regardless of their orientation in the yeast genome. In addition, they showed that genes with similar functions tend to be adjacent along the chromosomes. Spellman and Rubin [3] found that numerous clusters that span 10–30 physically adjacent genes share strikingly similar
Editors:Judith Blake (The Jackson Laboratory, US), John Hancock (MRC-Harwell, UK), Bill Pavan (NHGRI-NIH, US), and Lisa Stubbs (Lawrence Livermore National Laboratory, US), together with PLoS Genetics EIC Wayne Frankel (The Jackson Laboratory, US).
ReceivedAugust 15, 2005;AcceptedFebruary 8, 2006;PublishedApril 28, 2006
DOI:10.1371/journal.pgen.0020044
Copyright:Ó2006 Seno et al. This is an open-access article distributed under the terms of the Creative Commons Attribution License, which permits unrestricted use, distribution, and reproduction in any medium, provided the original author and source are credited.
Abbreviations:CAGE, cap analysis gene expression; miRNA, micro RNA; ncRNA, noncoding RNA; SADB, Sense and Antisense Database; TU, transcriptional unit
expression profiles inD. melanogaster. These clustered genes accounted for over 20% of the total analyzed genes. Furthermore, by mapping expressed sequence tags back to the Drosophila genome, Boutanaev et al. [4] observed that almost one-third of 1,661 testis-specific genes are clustered. Similarly, positional clustering of coexpressed genes has also been reported in C. elegans. Although operon and tandem duplication are major mechanisms for the observed coex-pression of gene clusters in the worm, there are additional explanations for the presence of gene clusters. Clusters of highly coexpressed genes have also been identified in the human and other mammalian genomes. Through analysis of expressed sequence tags and serial analysis of gene expression tags, positional clustering of several genes has been shown. Moreover, Su et al. [12] designed a custom array that interrogates the expression of the vast majority of protein-coding human and mouse genes. They used this dataset to search for chromosomal regions of correlated transcription, which may indicate higher-order mechanisms of transcrip-tional regulation. These studies suggest that there are clusters of tissue-specific genes, and that gene clustering might be more frequent than initially thought.
In addition, with the sequencing and annotation of genomes and transcriptomes of several eukaryotes, the importance of noncoding RNA (ncRNA)—RNA molecules that are not translated into protein products—has become more evident. Growing evidence indicates that a subclass of ncRNA transcripts participates in the regulation of many cellular functions in eukaryotes such as transcription interference and genomic imprinting. The fact that expres-sion of theSRG1ncRNA is required for repression ofSER3
was reported as an example of transcription interference [17]. MicroRNAs (miRNAs) are a class of ncRNAs that down-regulate the expression of their mRNA targets [18–20]. The miRNAs are encoded as short inverted repeats in the genomes of invertebrates and vertebrates, and they are believed to control translation by binding to the sites of antisense complementarity in 39untranslated regions. These mechanisms of transcriptional control mediated by ncRNAs are hard to predict from genomic sequences alone.
Several transcripts that are known to control the processes of epigenetic transcription occur in a cluster. Also, some genes in adjacent or nearby positions and in forward and reverse strands along the chromosomes influence the transcription of
each other. These facts indicate that genomic regions that have similar mechanisms may have related patterns of expression, while expression is different depending on tissue type and developmental stage within the same genomic region.
Currently, the FANTOM3 project [21] provides one of the largest available resources for the discovery of transcriptional mechanisms in mammals. In addition to having a large collection of novel protein-coding transcripts, the FANTOM3 transcript set contains many ncRNAs, disease genes, antisense transcripts, and the cap analysis gene expression (CAGE) library. CAGE [22] is based on preparation and sequencing of concatamers of DNA tags derived from the initial 20 nucleotides at the 59 ends of mRNAs. CAGE allows high-throughput analysis of gene expression and offers all the advantages of serial analysis of gene expression and expressed sequence tag sequencing, including the detection of rare and novel transcripts. The frequency of CAGE tags correlates well with the results of other expression analyses [23].
Here we describe an approach for exploring transcrip-tional mechanisms using the CAGE database, which allows simultaneous detection of the expression levels of the entire genome without a priori knowledge of gene functions. Mapping the CAGE tags back to the genome and counting the tags for each fixed-length region allowed us to determine genomic expression levels. These expression levels were normalized, quantified, and converted into the descriptors denoted by one of four characters [24,25]. The expression patterns along the genome were then regarded as character strings that could be analyzed using dynamic programming similar to that employed for sequence analysis [26]. We profiled genomic positional expression in the mouse genome and found that regions that show similar expression patterns encode clusters of highly expressed genes depending on tissue type. Furthermore, we showed the possibility that regions that have sense–antisense transcription show similar expression patterns between forward and reverse strands.
Results/Discussion
Comprehensive Similarity Search across Chromosomes and Tissues
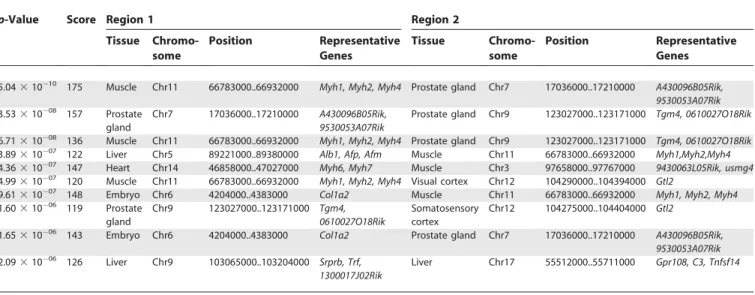
Based on the idea that genomic regions that have similar mechanisms may have related patterns of expression depend-ing on tissue type, we performed a similarity search of expression patterns in mouse across 21 chromosomes and 22 tissues using CAGE libraries. Counting the number of mapped CAGE tags for fixed-length regions allows determi-nation of genomic expression levels. These expression levels were normalized, quantified, and converted into four types of descriptors, allowing the expression patterns along the genome to be represented by character strings. We analyzed these using dynamic programming in the same manner as for sequence analysis (details described in Materials and Meth-ods). The distribution of the expression scores followed the extreme value distribution (Figure 1). Table 1 shows the top ten pairs of regions with high significance (more results are shown in Table S1).
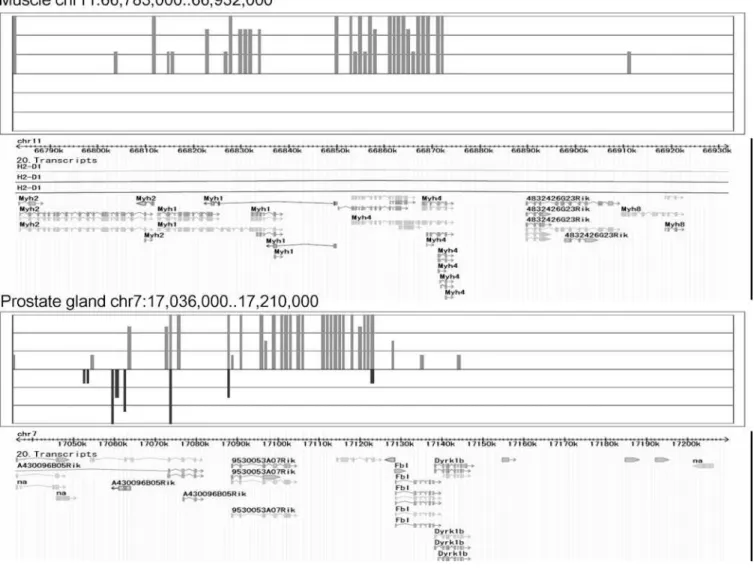
A region on Chromosome 11, bases 66,783,001 to 66,932,000, in the muscle and a region on Chromosome 7, bases 17,036,001 to 17,210,000, in the prostate gland showed the highest similarity in expression (score¼175,p,5.043 1010; Figure 2). The region on Chromosome 11 includesMyh
Synopsis
genes that form a cluster on the genome and encode major structural proteins that participate in the function of skeletal muscles. The region on Chromosome 7 includes
A430096B05Rik and 9530053A07Rik. A430096B05Rik is Fc
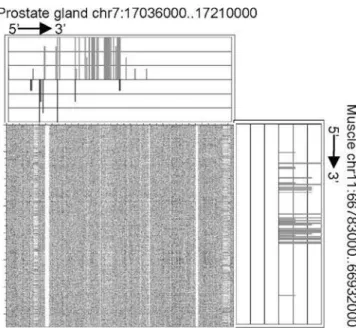
fragment of IgG binding protein, and 9530053A07Rik is a hypothetical protein containing von Willebrand factor type D domain/EGF-like and trypsin inhibitor-like cysteine-rich domains. We used a dot matrix to evaluate the sequence similarity of these regions (Figure 3). The dot matrix provides a graphical method for comparing two sequences. One sequence is written horizontally across the top of the graph and the other is written vertically. Dots are placed within the graph at the intersections where the same nucleotide appears in both sequences. A series of diagonal lines in the graph indicate regions of alignment. The region on Chromosome 11 in the muscle and the region on Chromosome 7 in the prostate gland showed few sequence similarities (Figure 3), but there was high similarity of expression pattern.
A region on Chromosome 5, bases 89,221,001 to 89,380,000, in the liver showed high similarity in expression with a region on Chromosome 11, bases 66,783,001 to 66,932,000, in the muscle (score¼122,p, 3.893107). The tandem arrange-ment of Alb (albumin) and Afp (alpha-fetoprotein) in the same transcriptional orientation has been well documented in mouse, rat, and human. Afm (alpha- albumin/afamin),the most recently identified member of the albumin gene cluster, is located immediately downstream and in the same transcrip-tional orientation as theAfpgene. These genes are expressed predominantly in the liver. We also observed similar expression patterns between the Alb/Afp/Afmcluster in liver and theMyhcluster in muscle (Figure S1). In contrast, these regions showed no apparent sequence similarities, same as in the case described above. Likewise for all of the pairs listed in Table 1, there were very few sequence similarities in spite of high expression similarities.
Moreover, a region on Chromosome 11, bases 66,665,001 to 67,165,000, in the muscle showed high similarity in expression with a region on Chromosome 6, bases 4,101,001 to 4,601,000, in the embryo (score¼148, p , 9.613107). This region includes the Col1a2 gene. The Col1a2 gene, which encodes procollagen, type I, alpha 2, is one of the genes that provide instructions for making components of collagen. This gene is large (nearly 40,000 bases) and highly spliced. According to the Alternative Splicing Database (http://www.ebi.ac.uk/asd) [27], this gene has ten patterns of splicing. Because of its number of splice sites, theCol1a2gene showed an expression pattern similar to a gene cluster (Figure S2).
Similarity Search between Forward Strand and Reverse Strand
We performed an expression similarity search between the forward and reverse strands of all transcriptional units (TUs) (39,593 TUs) in mouse. A TU was defined as the region or set of discontinuous regions in the genome from which all exons of a mature full-length mRNA are derived [28]. We selected
Table 1.Top Ten Pairs of Regions with High Similarity of Expression Patterns
p-Value Score Region 1 Region 2
Tissue Chromo-some
Position Representative Genes
Tissue Chromo-some
Position Representative Genes
5.0431010 175 Muscle Chr11 66783000..66932000
Myh1, Myh2, Myh4 Prostate gland Chr7 17036000..17210000 A430096B05Rik,
9530053A07Rik 3.5331008 157 Prostate
gland
Chr7 17036000..17210000 A430096B05Rik, 9530053A07Rik
Prostate gland Chr9 123027000..123171000 Tgm4, 0610027O18Rik
6.7131008 136 Muscle Chr11 66783000..66932000 Myh1, Myh2, Myh4 Prostate gland Chr9 123027000..123171000 Tgm4, 0610027O18Rik
3.8931007 122 Liver Chr5 89221000..89380000 Alb1, Afp, Afm Muscle Chr11 66783000..66932000 Myh1,Myh2,Myh4 4.3631007 147 Heart Chr14 46858000..47027000 Myh6, Myh7 Muscle Chr3 97658000..97767000 9430063L05Rik, usmg4
4.9931007 120 Muscle Chr11 66783000..66932000
Myh1, Myh2, Myh4 Visual cortex Chr12 104290000..104394000 Gtl2
9.6131007 148 Embryo Chr6 4204000..4383000 Col1a2 Muscle Chr11 66783000..66932000 Myh1, Myh2, Myh4
1.6031006 119 Prostate
gland
Chr9 123027000..123171000 Tgm4, 0610027O18Rik
Somatosensory cortex
Chr12 104275000..104404000 Gtl2
1.6531006 143 Embryo Chr6 4204000..4383000
Col1a2 Prostate gland Chr7 17036000..17210000 A430096B05Rik,
9530053A07Rik 2.0931006 126 Liver Chr9 103065000..103204000 Srprb, Trf,
1300017J02Rik
Liver Chr17 55512000..55711000 Gpr108, C3, Tnfsf14
The column‘‘Score’’indicates the similarity score calculated by our method, and the column‘‘p-Value’’indicates the statistical significance of the score. The column‘‘Representative Genes’’indicates genes included in the regions.
DOI: 10.1371/journal.pgen.0020044.t001
Figure 1.The Distribution of Observed Scores and the Extreme Value Distribution
The bars show the distribution of observed scores, and the line indicates an extreme value distribution. The horizontal axis shows the score, and the vertical axis shows the frequency of the score.
three libraries that included more than 1,000,000 tags at the postnatal development stage: liver (1,420,891 tags), lung (1,129,858 tags), and macrophage (1,217,074 tags).
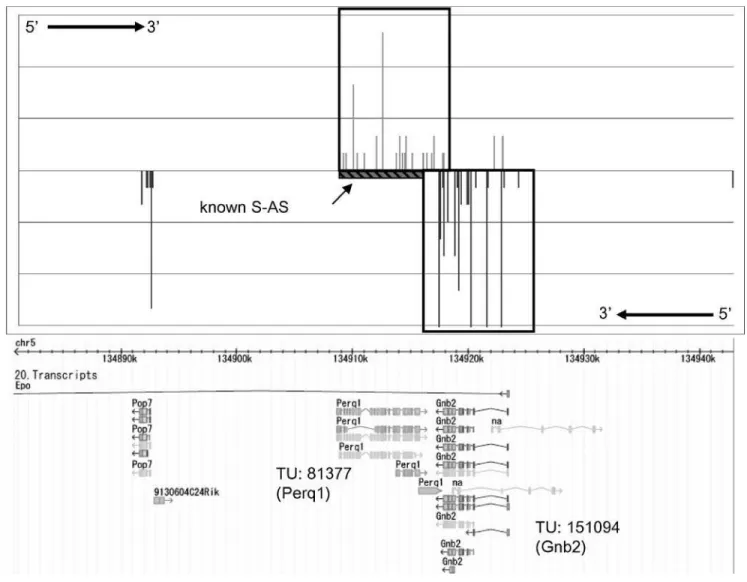
As an example of the results, Figure 4 shows the expression pattern of Chromosome 5, bases 134,880,800 to 134,943,900, which is the region that showed the highest similarity between the expression patterns of the forward and reverse strands in macrophage (p,3.823109). This region included TU 81377 in the forward strand and TU 151094 in the reverse strand. TU 81377 isPerq1(which encodes PERQ amino-acid-rich, with GYF domain 1) and TU 151094 is Gnb2 (which encodes guanine nucleotide binding protein, beta 2). Accord-ing to the Sense and Antisense Database (SADB; http:// fantom31p.gsc.riken.jp/s_as) [29], known sense–antisense transcription exists between TU 81377 and TU 151094. More results for each tissue are provided in Tables S2 (liver), S3 (lung), and S4 (macrophage).
Table 2 shows the numbers of regions that showed high similarity between forward and reverse strands. The numbers of regions with known sense–antisense transcription are also
indicated. This result demonstrates the possibility of infer-ring sense–antisense transcription from expression similarity searches between the forward and reverse strands.
Application for Genomic Positional Expression of miRNAs We proposed a novel approach for providing a novel view of the genome. We searched for similarity of expression patterns across chromosomes and tissues and found regions that had clusters of genes that showed expression patterns similar to each other depending on tissue type. Furthermore, our results suggested that the regions that had sense– antisense transcription showed similar expression patterns between forward and reverse strands.
Our approach delivers valuable information and lends itself to various applications for the analysis of ncRNA expression. As an example of the application of our method, we observed the genomic positional expression of miRNAs. To characterize the expression patterns of regions encoding miRNAs, we collected the regions that had known miRNAs. The informa-tion on miRNAs was obtained from the Rfam database (http:// www.sanger.ac.uk/Software/Rfam) [30]. We applied our
meth-Figure 2.Genomic Expression Patterns for Chromosome 11 in Muscle and Chromosome 7 in Prostate Gland
Expression pattern of Chromosome 11 in muscle, bases 66,783,001 to 66,932,000 (above), and Chromosome 7 in prostate gland, bases 17,036,001 to 17,210,000 (below). The upward and downward bars from N indicate the expression levels of the forward and reverse strands at the block, respectively. The genomic positional expression patterns of the two regions showed high similarity.
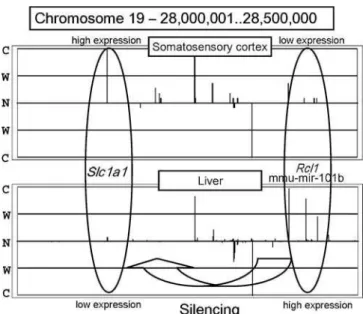
od to 235 regions of 500,000 bases from 22 tissues that included known miRNAs. Those miRNAs that could not be confidently placed on a specific chromosome were excluded. We found that some of the regions exhibited interesting tendencies. Figure 5 shows the expression pattern for Chromosome 19, bases 28,000,001 to 28,500,000, in the somatosensory cortex and in the liver. According to TargetScan (http://genes.mit. edu/targetscan) [31], which combines thermodynamics-based modeling of RNA–RNA duplex interactions and comparative sequence analysis for predicting miRNA targets conserved in multiple genomes,Slc1a1appears to be a target of mmu-mir-101b. The miRNAmmu-mir-101bis embedded in the intron of
Rcl1. Slc1a1 encodes solute carrier family 1, member 1, and
Rcl1encodes RNA terminal phosphate cyclase-like 1. In the somatosensory cortex, Slc1a1 (left oval in Figure 5) was expressed strongly andRcl1(right oval) was expressed weakly. This tendency was observed in cerebellum, visual cortex, and cerebral cortex. In contrast,Slc1a1was expressed weakly and
Rcl1was expressed strongly in the liver, lung, embryo, and adipose tissue. This finding suggests the possibility that the region that includesmmu-mir-101bfolds back upon the mRNA precursor, forming a stem loop so that the matured miRNA can silence theSlc1a1gene as a target.
Additional Factors Affecting the Analysis
In conclusion, our method provided a way of quantifying the patterns of CAGE tag distribution, thus enabling extraction of higher-level gene expression patterns from the genome. It also provided a scoring function based on dynamic programming. In this study, we used a fixed and predefined length as block size. Because the results will vary depending on block size, the block size should be determined taking various factors into account, e.g., the size of the promoter (100–3,000
bases), the mRNA (1,000–20,000 bases), and the regions used to detect similarity (gene, gene cluster, or chromosome). How-ever, the determination of optimal block size remains a difficult problem. A method for determining this parameter for more robustness is still under development.
The values used in the scoring matrix will also affect the results. The results calculated with the matrix used here (Table 3) had a tendency to detect similarities between regions that had a high density of genes with strong expression. To find weaker relationships, the scoring matrix should be modified in the same manner as other biological sequence analyses. With the matrix used here (Table 3), we could find regions that showed strong similarity to each other depending on tissue type. The results provided evidence for a nonrandom gene order and demonstrated the efficiency and potential of our method for further analysis of transcrip-tional mechanisms.
Materials and Methods
Mouse genome sequence and gene expression data.In this study, we regarded the number of CAGE tags mapped to a region as a measure of the expression level for the region. We employed the data in the CAGE database (http://fantom31p.gsc.riken.jp/cage/mm5; M. musculus; Assembly version USCS-May-2004; Chromosomes 1–19, X, and Y) [21]. The dataset contains 6,895,911 CAGE tags uniquely mapped to the mouse genome from 22 tissues (except where the tissue type was undefined). Because the number of tags in each tissue is different (Table S5), it was difficult to directly compare the expression levels. To compare expression patterns across pairs of tissues or chromosomes, we converted the data to a string of descriptors as described below. Genomic expression patterns were quantified and normalized, and similarities between expression patterns were computed using dynamic programming similar to the Smith–Waterman algorithm [26].
Composition of the frequency map. To calculate the similarity between pairs of regions, we first constructed a frequency map for each chromosome and each tissue using the CAGE tags. We counted the number of tags mapped to each fixed-length block on the genome, and regarded the number of tags as the expression level for the block. In the analysis of similarity between chromosomes and tissues, the block size was set to 1,000 bases. We counted the number
of CAGE tags that mapped to chromosomecin tissuetbetween bases
1 and 1,000, between bases 1,001 and 2,000, and so on. We defined the set of expression levels per block expressed in the forward strand on chromosomecin tissuet,Fc(t)¼ fF1,c(t),F2,c(t),. . .FNc;cðtÞg, whereNc
is the number of blocks in chromosomec,andFi,c(t) is the number of
tags expressed inith block of chromosomecin tissuet. Likewise, the
set of expression levels per block expressed in the reverse strand, Rc(t), was defined as follows:Rc(t)¼ fR1,c(t),R2,c(t),. . .RNc;cðtÞg. After
counting all tags, we obtained the sequential expression levels along the chromosome. Figure S3 shows an overall view of expression levels on the mouse genome when the block size was set to 1,000,000 bases and all tissues were mixed. In the case of the similarity search between the forward and reverse strands, the block size was set to 100 bases.
Conversion of data into descriptors. To compare expression between two genomic regions, we converted the sequential
expres-sion levels in Fi,c(t) and Ri,c(t) to strings of descriptors, where a
descriptor refers to how many tags were mapped in each block, and approximately represents the expression level. Binning the values is a good way to handle noise that may be introduced by experimental errors. Moreover, it allows us to focus on the more general tendencies of expression levels. Here, we defined four kinds of descriptors: S, strongly expressed; C, comparatively expressed; W, weakly expressed; and N, not expressed. Our method is an adaptation of the Event Method [24,25], which has been used for time-course expression profiling, e.g., in the mining of microarray data. We adapted the idea of representing expression levels by the use of symbol characters from time-course expression data to genomic positional expression data.
The conversion process involved the following steps. First, we
calculated the standard deviation,r(t), for each tissue per block.E¯c(t)
represents the average ofFc(t) andRc(t).
rðtÞ ¼
ffiffiffiffiffiffiffiffiffiffiffiffiffiffiffiffiffiffiffiffiffiffiffiffiffiffiffiffiffiffiffiffiffiffiffiffiffiffiffiffiffiffiffiffiffiffiffiffiffiffiffiffiffiffiffiffiffiffiffiffiffiffiffiffiffiffiffiffiffiffiffiffiffiffiffiffiffiffiffiffiffiffiffiffiffiffiffiffiffiffiffiffiffi 1
2Nc
XNc
i¼0
fðFi;cðtÞ EcðtÞÞ2þ ðRi;cðtÞ EcðtÞÞ2g
v u u
t ð1Þ
Next, we calculated scores to represent how many tags were expressed in the block compared to the whole.
ZðFi;cðtÞÞ ¼Fi;cðtÞ=rðtÞ ð2Þ
ZðRi;cðtÞÞ ¼Ri;cðtÞ=rðtÞ ð3Þ
Thus, the series of expression levelsFc(t) andRc(t) were transformed
into descriptor sequencesMsuch that
MðFi;jðtÞÞ ¼
S if C if W if N if
2
1
0,
ZðFi;cðtÞÞ
ZðFi;cðtÞÞ
ZðFi;cðtÞÞ
ZðFi;cðtÞÞ ,2
,1
¼0 8
> > <
> > :
ð4Þ
MðRi;jðtÞÞ ¼
S if C if W if N if
2
1
0,
ZðRi;cðtÞÞ
ZðRi;cðtÞÞ
ZðRi;cðtÞÞ
ZðRi;cðtÞÞ ,2
,1
¼0 8
> > <
> > :
ð5Þ
Finally, to calculate similarity, we picked out the sequential blocks along the chromosome. In the analysis of similarity across chromo-somes and tissues, we set this length to more than 100 blocks. With a block size of 1,000 bases, we compared the expression patterns of
regions more than 100,000 bases long. The whole mouse genome has
more than 23109bases. Even if the regions were picked out without
overlap, there was a high computational cost. Therefore, we introduced a cut-off value to pick out regions. If the number of N (not expressed) descriptors included in the region was more than 80%, we regarded the region as less informative and rejected it. Figure S4 shows an example of a discarded region—liver, Chromo-some 2, from block 26248 to block 26747 (bases 26,248,001 to
Figure 4.Genomic Expression Pattern for Chromosome 5, Bases 134,880,800 to 134,943,900, in Macrophage
This region on Chromosome 5 shows similarity of expression pattern between the forward (TU 81377;Perq1) and reverse strands (TU 151094;Gnb2). The region from base 134,908,626 to base 134,893,818 (‘‘known S-AS’’) was reported by SADB as an overlapping region of sense–antisense transcription. DOI: 10.1371/journal.pgen.0020044.g004
Table 2.Results of Similarity Search between Forward and Reverse Strands
p-Value Liver Lung Macrophage
p,1.03106 6 regions 3 regions 3 regions
10 known S-AS 15 known S-AS 4 known S-AS p,1.03105 11 regions 11 regions 17 regions
39 known S-AS 30 known S-AS 41 known S-AS p,1.03104 26 regions 27 regions 44 regions
64 known S-AS 67 known S-AS 99 known S-AS
This table indicates the number of regions that show higher similarity and the number of occurrences of known sense–antisense (S-AS) overlapping in these regions.
26,747,000)—and the descriptor strings of the forward and reverse strands of the region.
In the analysis of similarity between the forward strand and the reverse strand, we changed the length of descriptor sequences according to the size of each TU [27]. The number of TUs is 39,593 in mouse. The shortest TU is 29 bases and largest TU is over 2 million bases.
Calculation of similarity of genomic expression. Once the descriptor strings were obtained, we needed to determine whether the order of the descriptors indicated possible relationships by finding the best match between strings. We used an approach similar to that used in biological sequence alignment. Given the descriptor strings, we can efficiently determine their best alignment according to a suitably defined scoring function using a Smith–Waterman algorithm for local sequence alignment [26].
Hi;jðforwardÞ ¼max
Hi1;j1þscoreðMðFi;cðtÞÞ;MðFj;cðtÞÞÞ
Hi;j1þgap
Hi1;jþgap
0 8 > > < > > :
ð6Þ
Hi;jðreverseÞ ¼max
Hi1;j1þscoreðMðRi;cðtÞÞ;MðRj;cðtÞÞÞ
Hi;j1þgap
Hi1;jþgap
0 8 > > < > > :
ð7Þ
The Smith–Waterman alignment algorithm uses the scoring system to sort the sequence pairs. We set up the scoring matrix according to the idea of the Event Method [24,25]. As shown in Table 3, the matrix is a type of similarity matrix used to evaluate how well two gene expression patterns match. Gap penalties are specified by the last row and the last column. We calculated the similarity of the forward and reverse strands of the two regions individually, and then defined the similarity score between the regions as their sum.
For the similarity analysis between the forward strand and the reverse strand, we used the following mathematical formulation:
Hi;k¼max
Hi1;k1þscoreðMðFi;cðtÞÞ;MðRk;cðtÞÞÞ
Hi;k1þgap
Hi1;kþgap
0
; ðk¼maxðiÞ iÞ
8 > > < > > :
AA8BB
Calculation of the significance of similarity scores.The scores of our method followed the extreme value distribution, same as the scores of random sequence alignment. Figure 1 shows the distribution of scores observed using our method and the extreme value distribution. The equation of the extreme value distribution is
fðxÞ ¼kekðxuÞekðxuÞ ð9Þ
whereu is the mode, highest point, or characteristic value of the
distribution, and k is the decay or scale parameter. There is an
important relationship betweenuandkand the mean and standard
deviation of a set of extreme values. We calculatedu andkfrom
means and standard deviations using the method of moments.
The probability that the scoreSwill be less than valuex, P(S,x), is
obtained by calculating the area under the curve by integration of Equation 9, giving
PðS,xÞ ¼eekðxuÞ
ð10Þ
The probability ofSxis thus
PðSxÞ ¼1eekðxuÞ ð11Þ
We regarded this probability as the statistical significance of the similarity score.
Supporting Information
Figure S1.Genomic Expression Patterns for Chromosome 5 in Liver and Chromosome 11 in Muscle
Expression pattern of Chromosome 5 in liver, bases 89,221,001 to 89,380,000 (above), and Chromosome 11 in muscle, bases 66,783,001 to 66,932,000 (below). The upward and downward bars from N indicate the expression levels of the forward and reverse strands at the block, respectively.
C, comparatively expressed; N, not expressed; S, strongly expressed; W, weakly expressed.
Found at DOI: 10.1371/journal.pgen.0020044.sg001 (605 KB PDF).
Figure S2. Genomic Expression Patterns for Chromosome 6 in
Embryo and Chromosome 11 in Muscle
Expression pattern of Chromosome 6 in embryo, bases 4,204,001 to 4,383,000 (above), and Chromosome 11 in muscle, bases 66,783,001 to 66,932,000 (below). The upward and downward bars from N indicate the expression levels of the forward and reverse strands at the block, respectively.
C, comparatively expressed; N, not expressed; S, strongly expressed; W, weakly expressed.
Found at DOI: 10.1371/journal.pgen.0020044.sg002 (652 KB PDF).
Figure S3.Overall View of Expression Levels for the Mouse Genome per 1,000,000 Bases
The expression levels for each chromosome are indicated with a color code. High expression levels in the forward strand are shown in light red and low expression levels, are shown in dark red. High levels in the reverse strand are shown in light green, and low levels are shown in dark green. The blocks where very few or no tags were mapped are shown in black. The numbers at the left of the figure indicate the chromosome number.
Found at DOI: 10.1371/journal.pgen.0020044.sg003 (756 KB PDF).
Figure 5.Comparison of the Expression Patterns between Somatosen-sory Cortex and Liver
The upper panel shows the expression pattern on Chromosome 19, bases 28,000,001 to 28,500,000, in somatosensory cortex. The lower panel shows the expression pattern of the same region in liver. The two ellipses show the expression patterns of the regions encoding theSlc1a1
gene andmmu-mir-101b miRNA (embedded in the intron ofRcl1). C, comparatively expressed; N, not expressed; S, strongly expressed; W, weakly expressed.
DOI: 10.1371/journal.pgen.0020044.g005
Table 3.Scoring Matrix Used for Dynamic Programming
Gene A Expression
Gene B Expression
S C W N Gap Penalty
S 10 7 4 8 2
C 7 10 4 8 2
W 4 4 4 3 2
N 8 8 3 0 2
Gap penalty 2 2 2 2 —
Figure S4. An Example of Part of the Expression Pattern for Chromosome 2 in the Liver
(A) Genomic expression pattern on Chromosome 2, bases 26,248,001 to 26,747,000, in liver. This figure includes 500 blocks from 26248 to 26747. The upward and downward bars from zero indicate the expression levels of the forward and reverse strands at the block, respectively. S (strongly expressed), C (comparatively expressed), W (weakly expressed), and N (not expressed) indicate the scale with the
standard deviationr(liver). The part of the panel shows information
about the transcripts of this region.
(B) Converted descriptor string of the expression pattern of the forward strand.
(C) Converted descriptor string of the expression pattern of the reverse strand.
Found at DOI: 10.1371/journal.pgen.0020044.sg004 (96 KB PDF).
Table S1.Results of the Comprehensive Similarity Search: Pairs of
Regions with Expression Pattern Similarity Significant atp,0.001
The column‘‘Score’’indicates the similarity score calculated by our
method, and the column‘‘p-value’’indicates the statistical
signifi-cance of the score. Tissue type (‘‘Tissue’’), chromosome number
(‘‘Chr’’), and chromosomal position (‘‘Position’’) are also indicated.
Found at DOI: 10.1371/journal.pgen.0020044.st001 (67 KB XLS).
Table S2.Result of Similarity Search between Forward and Reverse Strands in Liver
This table lists the regions that showed similar expression patterns
between the forward and reverse strands in liver (p , 0.001).
Statistical significances are indicated in the column ‘‘p-value.’’
Chromosomal positions for the forward and reverse strands are indicated. Information from the corresponding SADB entry is shown
on the right. The column‘‘Type’’indicates the type of overlapping: C,
convergent, tail-to-tail overlapping; D, divergent, head-to-head over-lapping; F, full, fully overlapping.
Found at DOI: 10.1371/journal.pgen.0020044.st002 (49 KB XLS).
Table S3.Result of Similarity Search between Forward and Reverse Strands in Lung
This table lists the regions that showed similar expression patterns
between the forward and reverse strands in lung (p , 0.001).
Statistical significances are indicated in the column ‘‘p-value.’’
Chromosomal positions for the forward and reverse strands are
indicated. Information from the corresponding SADB entry is shown on the right.
Found at DOI: 10.1371/journal.pgen.0020044.st003 (53 KB XLS).
Table S4.Result of Similarity Search between Forward and Reverse Strands in Macrophage
This table lists the regions that showed similar expression patterns
between the forward and reverse strands in macrophage (p,0.001).
Statistical significances are indicated in the column ‘‘p-value.’’
Chromosomal positions for the forward and reverse strands are indicated. Information from the corresponding SADB entry is shown on the right.
Found at DOI: 10.1371/journal.pgen.0020044.st004 (60 KB XLS).
Table S5.Number of CAGE Tags Mapped to Each Tissue
The dataset contains 6,895,911 CAGE tags and 22 tissues. Each row indicates the number of tags in the corresponding tissues.
Found at DOI: 10.1371/journal.pgen.0020044.st005 (81 KB PDF).
Accession Numbers
The Entrez Gene (http://www.ncbi.nlm.nih.gov/entrez/query.
fcgi?db¼gene) GeneIDs for the genes discussed in this paper are
0610027O18Rik (66079), 1300017J02Rik (71775), 9430063L05Rik
(229622), 9530053A07Rik (319482), A430096B05Rik (215384), Afm
(280662), Afp(11576),Alb(11657),C3(12266), Col1a2(12843), Gnb2
(14693),Gtl2(17263),Myh2(17882),Myh4(17884),Myh6(17888),Perq1
(57330),Rcl1(59028),Slc1a1(20510),Srprb(20818), andTnfsf14(50930).
Acknowledgments
Author contributions.SS, YT, and HM conceived and designed the experiments. SS performed the experiments and analyzed the data. SS, CK, JK, PC, and YH contributed reagents/materials/analysis tools. SS, YT, and HM wrote the paper.
Funding.This work was supported by the Research Grant for the RIKEN Genome Exploration Research Project from the Ministry of Education, Culture, Sports, Science and Technology of Japan to YH, a grant of the Genome Network Project from the Ministry of Education, Culture, Sports, Science and Technology of Japan to YH, and a grant for the Strategic Programs for R&D of RIKEN to YH. Competing interests.The authors have declared that no competing
interests exist. &
References
1. Cho RJ, Campbell MJ, Winzeler EA, Steinmetz L, Conway A, et al. (1998) A genome-wide transcriptional analysis of the mitotic cell cycle. Mol Cell 2: 65–73. 2. Cohen BA, Mitra RD, Hughes JD, Church GM (2000) A computational analysis of whole-genome expression data reveals chromosomal domains of gene expression. Nat Genet 26: 183–186.
3. Spellman PT, Rubin GM (2002) Evidence for large domains of similarly expressed genes in theDrosophilagenome. J Biol 1: 5.
4. Boutanaev AM, Kalmykova AI, Shevelyov YY, Nurminsky DI (2002) Large clusters of co-expressed genes in theDrosophilagenome. Nature 420: 666–669. 5. Blumenthal T (1995) Trans-splicing and polycistronic transcription in
Caenorhabditis elegans. Trends Genet 11: 132–136.
6. Roy PJ, Stuart JM, Lund J, Kim SK (2002) Chromosomal clustering of muscle-expressed genes inCaenorhadbitis elegans. Nature 418: 975–979. 7. Lercher MJ, Blumenthal T, Hurst LD (2003) Coexpression of neighboring
genes inCaenorhadbitis elegansis mostly due to operons and duplicate genes. Genome Res 13: 238–243.
8. Ko MS, Threat TA, Wang X, Horton JH, Cui Y, et al. (1998) Genome-wide mapping of unselected transcripts from extraembryonic tissue of 7.5-day mouse embryos reveals enrichment in the t-complex and under-represen-tation on the X chromosome. Hum Mol Genet 7: 1967–1978.
9. Megy K, Audic S, Claverie JM (2002) Heart-specific genes revealed by expressed sequence tag (EST) sampling. Genome Biol 3: RESEARCH0074. 10. Divina P, Vlcek C, Strnad P, Paces V, Forejt J (2005) Global transcriptome
analysis of the C57BL/6J mouse testis by SAGE: Evidence for nonrandom gene order. BMC Genomics 6: 29.
11. Li Q, Lee BT, Zhang L (2005) Genome-scale analysis of positional clustering of mouse testis-specific genes. BMC Genomics 6: 7.
12. Su AI, Wiltshire T, Batalov S, Lapp H, Ching KA, et al. (2004) A gene atlas of the mouse and human protein-encoding transcriptomes. Proc Natl Acad Sci U S A 101: 6062–6067.
13. Gabrielsson BL, Carlsson B, Carlsson LM (2000) Partial genome scale analysis of gene expression in human adipose tissue using DNA array. Obes Res 8: 374–384.
14. Caron H, van Schaik B, van der Mee M, Baas F, Riggins G, et al. (2001) The human transcriptome map: Clustering of highly expressed genes in chromosomal domains. Science 291: 1289–1292.
15. Dempsey AA, Pabalan N, Tang HC, Liew CC (2001) Organization of human cardiovascular-expressed genes on chromosomes 21 and 22. Mol Cell Cardiol 33: 587–591.
16. Lercher MJ, Urrutia AO, Hurst LD (2002) Clustering of housekeeping genes provides a unified model of gene order in the human genome. Nat Genet 31: 180–183.
17. Martens JA, Laprade L, Winston F (2004) Intergenic transcription is required to repress theSaccharomyces cerevisiaeSER3 gene. Nature 429: 571–574. 18. Pasquinelli AE, Hunter S, Bracht J (2005) MicroRNAs: A developing story.
Curr Opin Genet Dev 15: 200–205.
19. Yekta S, Shih IH, Bartel DP (2004) MicroRNA-directed cleavage of HOXB8 mRNA. Science 304: 594–596.
20. Lagos-Quintana M, Rauhut R, Meyer J, Borkhardt A, Tuschl T (2003) New microRNAs from mouse and human. RNA 9: 175–179.
21. Carninci P, Kasukawa T, Katayama S, Gough J, Frith MC, et al. (2005) The transcriptional landscape of the mammalian genome. Science 309: 1559– 1563.
22. Shiraki T, Kondo S, Katayama S, Waki K, Kasukawa T, et al. (2003) Cap analysis gene expression for high-throughput analysis of transcriptional starting point and identification of promoter usage. Proc Natl Acad Sci U S A 100: 15776–15781.
23. Kodzius R, Matsumura Y, Kasukawa T, Shimokawa K, Fukuda S, et al. (2004) Absolute expression values for mouse transcripts: Re-annotation of the READ expression database by the use of CAGE and EST sequence tags. FEBS Lett 559: 22–26.
24. Kwon AT, Hoos HH, Ng R (2003) Inference of transcriptional regulation relationships from gene expression data. Bioinformatics 19: 905–912. 25. Ji L, Tan KL (2005) Identifying time-lagged gene clusters using gene
expression data. Bioinformatics 21: 509–516.
27. Thanaraj TA, Stamm S, Clark F, Riethoven JJ, Le Texier V, et al. (2004) ASD: The Alternative Splicing Database. Nucleic Acids Res 32: D64–D69. 28. Kasukawa T, Katayama S, Kawaji H, Suzuki H, Hume DA, et al. (2004)
Construction of representative transcript and protein sets of human, mouse, and rat as a platform for their transcriptome and proteome analysis. Genomics 84: 913–921.
29. Katayama S, Tomaru Y, Kasukawa T, Waki K, Nakanishi M, et al. (2005)
Antisense transcription in the mammalian transcriptome. Science 309: 1564–1566.
30. Griffiths-Jones S, Bateman A, Marshall M, Khanna A, Eddy SR (2003) Rfam: An RNA family database. Nucleic Acids Res 31: 439–441.