Handling Permutation in Sequence
Comparison: Genome-Wide Enhancer
Prediction in Vertebrates by a Novel
Non-Linear Alignment Scoring Principle
Dirk Dolle1,2¤a
*, Juan L. Mateo1*, Michael P. Eichenlaub1,2, Rebecca Sinn1,2, Robert Reinhardt1,2, Burkhard Höckendorf1,2, Daigo Inoue1, Lazaro Centanin1, Laurence Ettwiller1¤b, Joachim Wittbrodt1
*
1Centre for Organismal Studies (COS) Heidelberg, Ruprecht-Karls-University Heidelberg, Heidelberg, Germany,2Hartmut Hoffmann-Berling International Graduate School HBIGS, University of Heidelberg, Heidelberg, Germany
¤a Current address: Wellcome Trust Sanger Institute, Hinxton, United Kingdom
¤b Current address: New England Biolabs Inc. Ipswich, Massachusetts, United States of America
*[email protected](DD);[email protected](JLM); [email protected](JW)
Abstract
Enhancers have been described to evolve by permutation without changing function. This has posed the problem of how to predict enhancer elements that are hidden from align-ment-based approaches due to the loss of co-linearity. Alignment-free algorithms have been proposed as one possible solution. However, this approach is hampered by several problems inherent to its underlying working principle. Here we present a new approach, which combines the power of alignment and alignment-free techniques into one algorithm. It allows the prediction of enhancers based on the query and target sequence only, no matter whether the regulatory logic is co-linear or reshuffled. To test our novel approach, we employ it for the prediction of enhancers across the evolutionary distance of ~450Myr
between human and medaka. We demonstrate its efficacy by subsequentin vivovalidation
resulting in 82% (9/11) of the predicted medaka regions showing reporter activity. These include five candidates with partially co-linear and four with reshuffled motif patterns. Orthol-ogy in flanking genes and conservation of the detected co-linear motifs indicates that those candidates are likely functionally equivalent enhancers. In sum, our results demonstrate that the proposed principle successfully predicts mutated as well as permuted enhancer regions at an encouragingly high rate.
Introduction
To date, two main, more or less diametrically opposed structural models of enhancers exist. The first model describes so-called enhanceosomes, regions of densely clustered transcription OPEN ACCESS
Citation:Dolle D, Mateo JL, Eichenlaub MP, Sinn R, Reinhardt R, Höckendorf B, et al. (2015) Handling Permutation in Sequence Comparison: Genome-Wide Enhancer Prediction in Vertebrates by a Novel Non-Linear Alignment Scoring Principle. PLoS ONE 10(10): e0141487. doi:10.1371/journal.pone.0141487
Editor:Tae-Young Roh, Pohang University of Science and Technology (POSTECH), REPUBLIC OF KOREA
Received:July 13, 2015
Accepted:October 8, 2015
Published:October 27, 2015
Copyright:© 2015 Dolle et al. This is an open access article distributed under the terms of the Creative Commons Attribution License, which permits unrestricted use, distribution, and reproduction in any medium, provided the original author and source are credited.
Data Availability Statement:All relevant data are within the paper and its Supporting Information files.
Funding:This work was supported by a Small Collaborative Project Grant from the 7th Framework Programme of the European Commission (FP7-223210 to JW and LE). The funders had no role in study design, data collection and analysis, decision to publish, or preparation of the manuscript.
factor binding sites (TFBSs) that require a tightly coordinated series of binding events of par-tially interacting transcription factors (TFs) [1]. Due to this rigid structure, such cis-regulatory elements (CREs) tolerate only limited sequence changes without affecting their functionality. Hence, this class of enhancers is likely to be detected by alignment-based sequence comparison methods and further by methods assessing evolutionary constraint. Indeed, methods looking for conserved non-coding sequences (CNS), often defined as regions of>70% sequence con-servation across>100nt [2–5], have been applied for the task of enhancer prediction and in many cases yielded elements capable of driving reporter gene expression in various spatiotem-poral patterns in a variety of organisms. Nobrega et al. for example, scanned the human gene desert around theDACH1gene for regions conserved between human, mouse, frog, and zebra-fish and found several elements recapitulating parts of the knownDACH1expression pattern that are likely to be functional [4]. Pennacchio et al. expanded this approach on a genome-wide scale following two different strategies [2]. They searched for elements which either are con-served (70% identity,>100nt) across>450Myr of independent evolution between human and fugu, or conserved between human, mouse, and rat. Due to the much smaller phylogenetic dis-tance between the species in the latter approach, the authors employed a more stringent crite-rion: 100% sequence identity over at least 200nt in all three species (“ultraconserved elements”
(UCEs)) [6]. Both approaches identified CREs at rates between 29% and 61%, providing fur-ther support for the applicability of alignment-based strategies for enhancer prediction. Although the significance of ultraconservation has been questioned since then [7,8], there is no doubt that sequence conservation and evolutionary constraint are very useful tools for the genome-wide prediction of regulatory elements. To date, thousands or CREs have been identi-fied this way, most of them located next to transcription factor or developmental genes (“ trans-dev genes”[5]).
However, almost 30 years ago [9] the first hints were provided that evolution and diversifi-cation of species might occur by changes on the regulatory rather than on the coding level, and today an increasing body of evidence supports this hypothesis [9–15]. Hence, another class of regulatory elements, with a higher level of sequence divergence, must play an important role in the evolution of expression of these genes. Possible candidates are enhancers following the sec-ond main structural model of CREs: the“billboard model”. These regions consist of flexible arrangements of TFBS that, upon binding of the corresponding TFs, start to aggregate and form the final active enhancer complex [16–18]. Contrary to the rather rigid structure of enhanceosomes, such arrangements are more easily modified without leading to a complete loss of function–a property that would allow regulators of crucial developmental genes to evolve. Indeed, there is strong evidence that billboard enhancers are able to keep most of their activity even in case of large structural rearrangements and strong binding site turnover [19,20], allowing a gradual adaptation to a new/extended role without critically affecting the organism as a whole. However, over time this inherently flexible nature is likely to render them invisible for classical alignment-based approaches and hence prevents their detection. This property can therefore be described as the intrinsic technical challenge of studying enhancer evolution.
them use a combination of TFBS prediction and alignment algorithms to solve this problem. For instance, He et al. developed a method that uses a probabilistic model of TFBS evolution to align two regions in different species based on the predicted positions of corresponding binding sites and applied this technique for the classification of known regulatory regions inDrosophila
melanogaster[25]. In a similar way, Taher et al. aligned putative regulatory regions to a known
enhancer based on predicted TFBS–profiles [26]. This allowed them to detect enhancers in likely orthologous regions across the evolutionary distance between human and zebrafish. While successful, both methods rely on prior knowledge of TFBSs for enhancer prediction and hence cannot be applied in contexts where this information is not available. Sosinsky et al. were able to overcome this necessity by developing a method that infers putative TFBS from multiple sequence alignments of closely related species [27]. Applied on a set of known regula-tory regions inD.melanogaster, they successfully predicted the putative corresponding enhanc-ers in the vicinity of orthologous genes in multiple fly species. Unfortunately, this method depends on the availability of identifiable orthologous regions in multiple closely related spe-cies and therefore cannot be applied for genome-wide enhancer prediction, especially if the tar-get is a single distantly related species.
Another attempt to handle the flexible nature of enhancers employs word profiles. This class of algorithms is usually referred to as“alignment-free”, although TFBS clustering methods in principle could also be summarized under that term. For simplicity, we will restrict the use of this term to methods using the working mechanism described in the following section. The common principle of these techniques is the base-wise dissection of two sequences into words of a defined size k (also called“k-mers”), generating a word profile for each. This profile is then used for sequence comparison. One of the first applications of this methodology on a biological question was the search for similar candidates for a set of given genes in all available bacterial GenBank sequences [28]. Later approaches successfully used the comparison of word profiles for the reconstruction of phylogenetic trees based on protein sequences [29]. For a review of the variety of alignment-free techniques and their use for sequence comparison see [30]. The main difference between individual alignment-free methods is the metric used to compare the generated profiles. While the aforementioned methods used weighted word counts or the angle between two given word vectors for comparison, subsequent methods focused on expected word frequencies for similarity assessment [31–33]. Each of these methods has since then been applied to enhancer prediction in insects and vertebrates and successfully identified known or novel regulatory regions [34,35]. However, in most of these studies [31,32,35] an initial training set of enhancers of similar regulatory activity was necessary to extract the likely key features needed for enhancer prediction. Furthermore, in only one study [35] a true genome-wide scan for regulatory elements was performed, in insects in this case.
Realizing that alignment-free-based enhancer prediction so far has mainly been performed in flies, we wondered what hinders their application on a genome-wide scale in the more com-plex vertebrate genomes. We further sought to understand why most methods so far depend on various types of additional information, especially when trying to predict enhancers across large evolutionary distances, for instance between human and fish. We therefore analysed the alignment-free principle for possible limitations in the concept itself in order to develop com-pensation strategies that do not require additional information.
clear enhancer activity. Interestingly, subsequent analysis of the structural organisation of the validated predictions revealed that co-linear motif configurations as well as permuted arrange-ments are almost equally likely to show enhancer activity.
Results
A composite principle for enhancer prediction
Alignment-free techniques have been suggested and applied for enhancer prediction due to their theoretical ability to deal with permutation [30]. In practice, however, this ability is ham-pered already by the initial generation of the word profile. Extracting k-mers of a fixed size in an overlapping fashion greatly simplifies TFBSs as unambiguous sequences of equal length independent of the TF binding to it. It further allows individual words to change independently although every position in a word is overlapped by a series of others neighbouring it (seeS1 FileandS1 Fig). As previously mentioned, many methods published so far make use of addi-tional information besides the given enhancer sequence in order to compensate the resulting problems [25,26] [27,32]. Here, we present a different approach with the aim of using exclu-sively the sequence of a known enhancer and a target genome. For this, we adapted a seeding and match/mismatch extension step for profile generation that first looks for short, perfect matching k-mers between two given sequences. Applying a mismatch tolerant scoring scheme, similar to those used by many local aligners, these "seeds" are then extended. By doing so, we can handle variable positions within putative TFBSs that otherwise would have led to different k-mers. At the same time, it allows us to reduce the size of the final profile by focusing only on extended seeds above a set threshold score. As regions extracted in this way are likely to be of different size and variable match/mismatch rates like the TFBSs they represent, we will call them“motifs”instead of“words”.
This seed extension approach is supported by previous studies which found that spacer sequences between individual TFBSs in cis-regulatory modules (CRMs) evolve faster than the functional regions they separate, slowing down gradually the closer a specific position is to a functional site [36]. Hence, ancestrally related TFBSs are more likely to allow extension in both directions than random occurrences of the same sites. In another paper, Swanson et al. [18] have shown that whole clusters of TFBSs can rearrange in the same way as individual TFBSs without violating the strict spacing and orientation requirements between the individual sites. As a result, even full clusters might be detectable as a single motif after rearrangement given that the TFBSs involved are close enough to each other and an initial seed can be placed.
Pattern detection
genomic sequences containing the same enhancer. Furthermore, the individual CRMs need to be rather strongly conserved in all those genomes to be detectable.
In the light of these results, we developed a technique adapted from a gap detection mecha-nism initially implemented in the CHAOS aligner [38]. In short, the modified principle works by first defining a search space around a selected match in a given alignment and subsequently scanning the search space for other matches that can be incorporated in a co-linear pattern (for details see“Methods”). While this allows enhancing the similarity score using co-linear arrangements, it does not interfere with the detection of sequence permutation as long as the profile generation step is performed first. In fact we allow two types of predictions, one in which the pattern detection is not considered (“PURE”score) and other in which this tech-nique is included (“COMB”score).
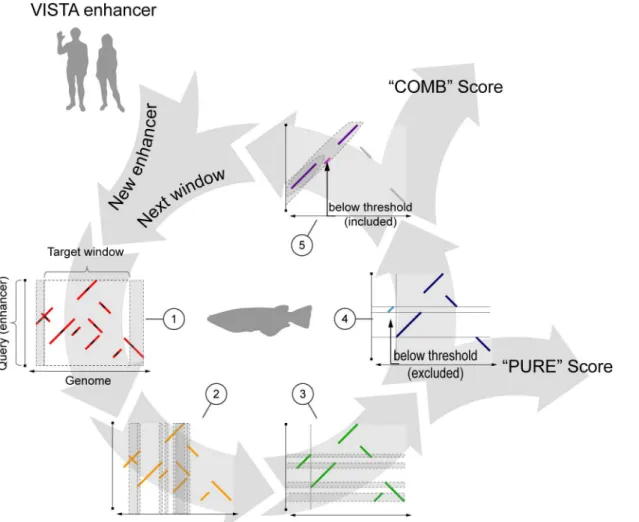
Finally, we combined seed extension and pattern detection into a single composite algo-rithm called NASCAR (“Non-linear Alignment SCoring AlgoRithm”), which can be used for genome-wide sequence similarity searches. Like most alignment-free algorithms, it looks for regions matching a given input sequence by sliding a window across the target genome. For each window defined in this way, a motif profile is generated and used to assess similarity to the input sequence (Fig 1).
NASCARs source code (written in PERL) is available upon request.
Selection of a test set of known enhancers
To further analyse the extent to which the principle described here can be used for the task of enhancer prediction, we applied it to a dataset of known and validated human enhancers. These regions were extracted from the VISTA Enhancer Browser [39] (http://enhancer.lbl.gov/ ), perhaps the biggest collection ofin vivovalidated vertebrate enhancers similar to the RedFly database [40]. For this study, we selected all human enhancers that were reported to have enhancing activity at E11.5 in mouse and removed overlapping regulatory elements (see Meth-ods). This resulted in 629 enhancers that were used for all subsequent analyses.
Most of these enhancers were initially predicted by deep sequence conservation, including sequences from amphibians and partially even fish, and hence likely to align in the majority of sequenced vertebrates. We therefore selected the teleost medaka (Oryzias latipes) as the target species in this study, for which a reliable enhancer assay exists [41,42]. Like all teleosts, the medaka genome shows clear signs of an additional whole genome duplication event (WGD) when compared to tetrapods, which happened shortly after the teleost-tetrapod split ~350Myr ago. The resulting redundancy on both the gene and the regulatory level is thought to have allowed formerly conserved enhancers to evolve, provided at least one functional copy is retained. A subsequent loss of one of the two instances, e.g. due to the chromosomal restructur-ing events that followed the duplication, would re-establish the selective pressure on the remaining enhancer and hence fix it in its current state. In some cases, this could have been the faster evolving copy while the more conserved instance was lost, leaving no trace of a regulatory element in the teleosts that is still conserved in tetrapods. Hence, trying to bridge the ~450Myr of independent evolution of human and medaka represents a challenging task when consider-ing that enhancers might have undergone permutation events to an extent that could render them invisible to alignment algorithms. However, this type of CREs could be uncovered by NASCAR.
LastZ and 303 (~48%) for BlastN. To test whether both algorithms identify similar subsets or actually predict independent parts of the input set we overlapped the prediction results and found overlapping alignment hits for 248 enhancers, meaning that BlastN is missing only four (~2%) of the LastZ hits while making significant predictions for additional 55 enhancers. We therefore decided to use the regions identified by BlastN as the aligning set for further comparisons.
To ensure that this set is indeed a suitable reference we analysed the gene environment of all contained alignment hits and found that for 279 of 303 (~92%) enhancers the hit is located near human-medaka orthologs in medaka (S1 Table). In 160 cases (~53%), these alignments are located in direct flanking position to a gene that is orthologous between human and medaka, and we denoted these predictions as“single flanked”. Further 71 predictions (~23%) are positioned between both orthologous flanking genes, labelled as“double flanked”. The
Fig 1. NASCAR workflow.(1) Seeds perfectly matching between query (i.e. enhancer) and target (e.g. genomic window) sequence (small black segments) are extended up- and downstream (red segments) using a match/mismatch scoring scheme to generate a raw motif profile. Motifs that overlap the predefined window boundaries are also taken into account and virtually extend the window (grey areas). (2) As a next step, overlapping regions of the extracted raw motifs in the target sequence are determined (grey areas) and the smaller motif truncated whenever it overlaps a larger one (2 to 3). Motifs smaller than the initial seed size after truncation are discarded in this step. (3) Same filtering procedure is repeated in the query sequence for the processed profile (3 to 4). (4) Motifs below the noise threshold (bright blue segment) are discarded and the basic similarity (“PURE”) score calculated from the fully filtered motif profile (dark blue). (5) In addition, a pattern detection method searches for co-linear arrangements in the profile (grey area). Panel shows the same motif
composition as (4) but in a co-linear configuration. This time, the motif below the noise threshold (bright pink) is kept as it is contained in a pattern. The score of the full pattern (all pink motifs) is subsequently added to the previously calculated basic score, resulting in the“COMB”score. For a given enhancer, the whole process is repeated window by window until the last window in the target sequence is reached.
remaining 48 hits are near the medaka ortholog to a gene in the human locus (for the computa-tion of orthologous gene sets see“Methods”andS4 Fig). However, even the 24 predictions that seem to be in“deserted”locations (i.e. without any orthologous gene nearby) are partially next to paralogs, which were not included in the analysis. Only a few predictions among those 24 seem to be completely remote. This suggests that the proximity of a pair of highly similar non-coding sequences to genes orthologous between both species can be used as an indication for the orthology of the found sequence match.
NASCAR identifies aligning enhancers
We then tested NASCAR on the aligning data set to assess its sensitivity on a collection of likely true positive regions. For this, we first compared the highest scoring NASCAR predicted regions against the full set of alignments found by BlastN and could recover hits for 275 of 303 enhancers (~91%), including weakly aligning (bit score between 50–80) and gap containing regions. This shows that NASCAR is able to recover regions of overall low sequence similarity (lowest scoring overlapping BlastN hit: 70nt (4% coverage) at 79.4% percentage identity, bit score 51.8). Besides the highest scoring prediction per enhancer, NASCAR outputs additional regions that could also contain CREs. However, in contrast to BlastN, there is so far no signifi-cance threshold that could be used to expand the candidate set beyond the highest ranked region. But as the BlastN results show (BlastN gives 480 regions for 303 independent enhancers when applying a bit score cut-off of>= 50), many human enhancers have more than just one likely corresponding candidate in medaka (e.g. due to the WGD or segmental duplications). We therefore decided to consider the 25 highest NASCAR predictions as putative enhancer candidates for this very first test of the implemented principles. Based on this cut-off, NASCAR identifies BlastN hits for 283 (~93%) human enhancers. Interestingly, the fraction of BlastN alignments reported by NASCAR is already noticeably higher than the one found by LastZ (91% vs 83%) when using only the highest scoring NASCAR hit.
Novel predicted candidates show reporter activity
Next, we applied NASCAR on the non-aligning 52% (326/629) of the VISTA enhancer set and analysed the reported predicted regions to identify putative enhancer candidates. Because of the obvious lack of alignment hits for this set, we developed a different assessment scheme based on the location of the hits relative to their flanking genes
As a first step, the human region of each of the nine predicted enhancer pairs was validated using our reporter assay [41]. Of those, eight showed reporter gene activity in medaka (Table 1, Fig 2,S5A Fig), indicating that the trans environment in our model system is able to activate the regulatory potential encoded in the human sequences. Furthermore, the displayed activity
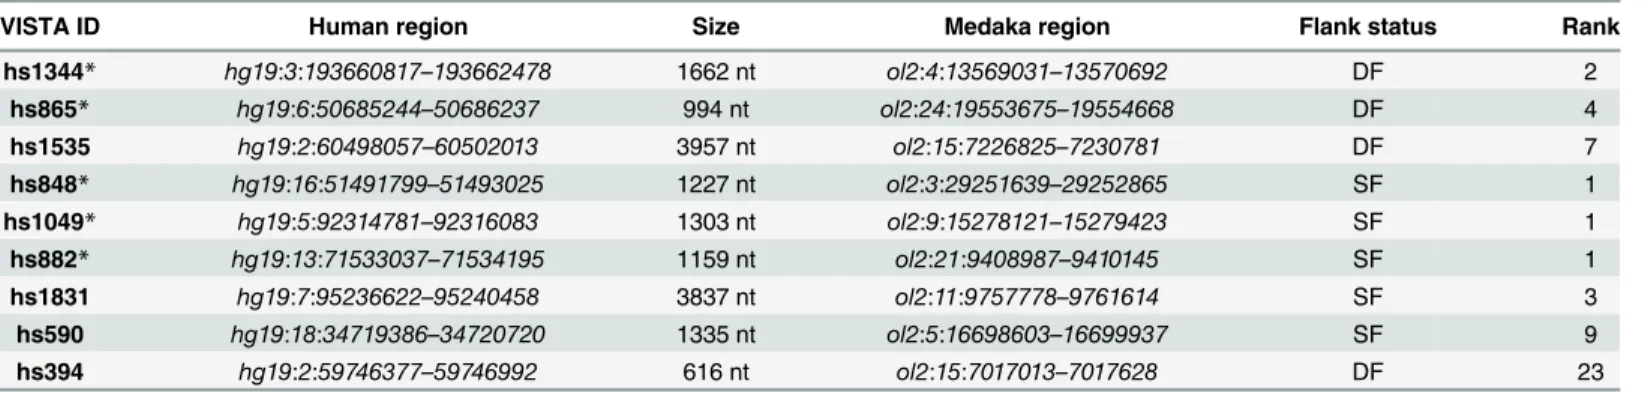
Table 1. Selected NASCAR candidates.
VISTA ID Human region Size Medaka region Flank status Rank
hs1344* hg19:3:193660817–193662478 1662 nt ol2:4:13569031–13570692 DF 2
hs865* hg19:6:50685244–50686237 994 nt ol2:24:19553675–19554668 DF 4
hs1535 hg19:2:60498057–60502013 3957 nt ol2:15:7226825–7230781 DF 7
hs848* hg19:16:51491799–51493025 1227 nt ol2:3:29251639–29252865 SF 1 hs1049* hg19:5:92314781–92316083 1303 nt ol2:9:15278121–15279423 SF 1
hs882* hg19:13:71533037–71534195 1159 nt ol2:21:9408987–9410145 SF 1
hs1831 hg19:7:95236622–95240458 3837 nt ol2:11:9757778–9761614 SF 3
hs590 hg19:18:34719386–34720720 1335 nt ol2:5:16698603–16699937 SF 9 hs394 hg19:2:59746377–59746992 616 nt ol2:15:7017013–7017628 DF 23
Thefirst 8 entries correspond to the candidates that showed expression in medaka.
*= partial motif co-linearity, DF =“doubleflanked”, SF =“singleflanked”
doi:10.1371/journal.pone.0141487.t001
Fig 2. Motif composition and reporter gene activity of selected human VISTA enhancers.For all enhancers seeS5 Fig. (A) Comparison of the known human enhancer sequence and the predicted enhancer in medaka. The coloured boxes represent the motifs identified by NASCAR to assess the similarity of each pair. Upper track always displays the motif positions in the human sequence (colour coded by position), lower track shows the configuration in the medaka region. All Motifs are draw in size relative to the used window size. Motif heights in the lower track represent the motif score, orientation (up/down) indicates the relative orientation (forward/reverse) compared to the query sequence. (B) Expression pattern of the human (hg19) or medaka (ol2-1) enhancers. Lens activity is part of the reporter construct and allows distinguishing between successful and negative injections. All pictures are taken at 10 days post injection (10dpi). In all cases both enhancers show strikingly similar pattern.
pattern of most of the tested elements largely resembles the pattern found in mouse (S5A Fig), suggesting that not only the binding motifs for the factors involved but also the regulatory logic (i.e. the spatiotemporal control of gene expression driven by this set of factors) remained largely unchanged despite the large evolutionary distance between the species. Hence, we sub-sequently tested the medaka regions predicted for those eight active human enhancers and could confirm activity for six (75%) of them (S5A Fig). This rate of observed reporter activity is already very encouraging by itself, especially when compared to what is achieved by randomly selected regions (10%) [45], regions picked by clustering of Transfac motifs (54%) [2], or pre-diction using chromatin feature-based computational genomic segmentation (59%) [42] It is also higher than the 44% achieved by prediction based on deep sequence conservation [2]. More interesting, however, is the observation that the activity pattern driven by corresponding pairs partially overlaps in domains in the fore- and midbrain. This strongly suggests that the approach implemented in NASCAR detected components of the regulatory logic contained in the human enhancer regions and used them for prediction of the validated candidates.
Predicted motifs show higher conservation than random motifs in the
same region
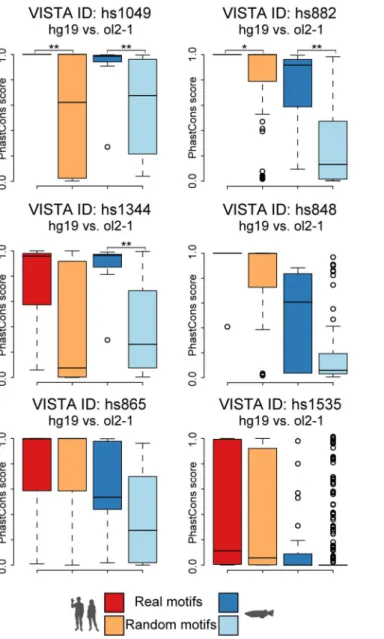
We therefore subsequently analysed the motif profiles (Fig 2andS5B Fig) of active human-medaka pairs, seeking clues for a functional importance of the motifs involved in their predic-tion. We furthermore wanted to find out why these medaka regions are detectable by our method while being missed by the alignment algorithms used. This analysis revealed that almost all active candidates show mainly co-linear motif arrangements in human and medaka with additional rearranged motifs supporting the core signal. Interestingly, some of the motifs provide enough sequence identity and length to result in direct alignment hits between the two species. However, neither of these hits reaches a score level considered significant (i.e. a BlastN bit score above 50) nor is strong enough to rank the corresponding region among the 25 high-est in BlastN. Based on the found motif patterns and given the degree of sequence similarity displayed by the motifs involved, we hypothesize that the identified medaka regions evolved mainly by sequence turnover in the spacers regions resulting in a series of conserved–and puta-tively still functional—motifs. We therefore tested whether the motifs were not only kept con-served between the two species compared but indeed also under specific constraint within their corresponding clades. For this we used clade-specific PhastCons scores [46] for placental mam-mals and teleosts (http://hgdownload.cse.ucsc.edu/goldenPath/hg19/phastCons46way/ placentalMammals/,http://hgdownload.cse.ucsc.edu/goldenPath/oryLat2/phastCons5way/), and calculated the average conservation of the human and medaka motifs. We then compared these scores against randomly selected motif sets extracted from the same genomic region in human or medaka, respectively. This revealed significant differences in conservation for co-lin-ear NASCAR motifs in two human and three medaka regions (p<0.05, Wilcoxon rank sum test) (Fig 3,Table 2). As expected, none of the rearranged motifs shows such specific conserva-tion when compared to randomly selected sets.
Methods based on TFBS-profiles cannot identify the enhancers found by
NASCAR
The previous result indicates that the motifs that NASCAR uses to pinpoint enhancer candi-dates are under selective pressure and this could be because these motifs are functional tran-scription factors binding sites. We then wanted to check if methods based on TFBS-profiles could identify these regions as well. For this comparison we chose EEL (Enhancer Element Locator) [24,47] because the software is still maintained and available and it is suitable for search of candidates in vertebrate-sized genomes. For this analysis we use the collection of TFBS motifs from the CORE Vertebrata database Jaspar version 5 [48].
Fig 3. Predicted candidates do not only differ in their motif configuration but also their conservation levels.Hs1344 shows significant motif specific conservation among teleosts, hs1049 and hs882 also among placental mammals. Together with the co-linear configuration and the orthologous gene(s) in flanking position this indicates that the motifs shared between human and medaka are likely to be orthologous counterparts. The random motifs (light colours) show very diverse conservation levels, which are generally lower within both clades.
We used EEL to scan the 24 chromosomes of the medaka genome and took the 25 regions top scored for each human enhancer as query. In no case is the enhancer identified by NAS-CAR in this top list. More than that, the score assigned by EEL to the validated enhancers is sig-nificantly lower than the average score of the top 25 ranked regions by EEL (Fig 4).
However, the medaka enhancers validated here were selected from the list of prediction based on its position near to an orthologous gene. We checked then if the predictions produced by EEL also contain regions with this property. The result is that for none of the human enhancers the 25 predictions are located near human-medaka orthologous genes. This further shows that a TFBS-profile technique cannot perform at a level comparable to NASCAR.
The identified motifs are functionally relevant for enhancer activity
Conservation of motifs as well as sequence constraint are by themselves neither a prerequisite for function (i.e. regions can diverge without losing function) nor do they necessarily indicateTable 2. P-values for Wilcoxon rank-sum-test of motif conservation in placental mammals and teleosts.
Enhancer-candidate pairs (hg19 vs ol2-1) p-value (Wilcoxon rank-sum test)
Placental mammals Teleost
hs1049 0.006** 0.007**
hs882 0.021* 0.004**
hs1344 0.072 0.002**
hs848 0.136 0.071
hs865 0.815 0.147
hs1535 0.343 0.512
One asterisk (*) denotes p-value0.05 two asterisks (**) means p-value0.01.
doi:10.1371/journal.pone.0141487.t002
Fig 4. TFBS motif profile search (EEL) misses the enhancers found by NASCAR.Bar plot showing the score assigned by EEL to the enhancer identified by NASCAR and the top 25 ranked regions genome wide with respect to each human enhancer. Error bars show standard deviation.
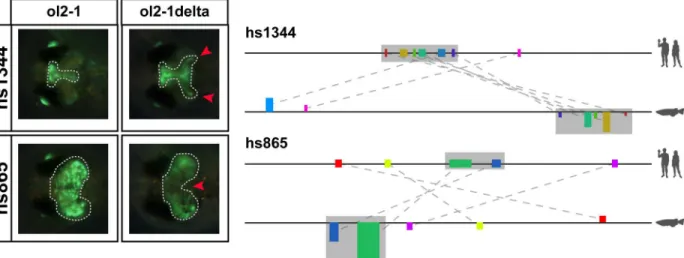
function (i.e. regions might have lost their function although they have been kept largely con-served) [49]. We therefore created deletion constructs lacking some of the identified motifs and tested the effect on the displayed reporter activity. For this we selected two active medaka regions containing motifs only identifiable by NASCAR and removed their conserved co-linear cores (constructs hs1344:ol2-1delta, hs865:ol2-1delta). We subsequently injected these con-structs into medaka one cell-stage eggs and analysed the resulting reporter gene activity during development. For each of the constructs two scenarios were possible: if the deleted block acts as an activator we would expect to lose part of the expression pattern, but if the deleted block con-tains a repressive function its removal should lead to a gain of an expression domain. Interest-ingly, we observe both scenarios (Fig 5). The first construct, hs1344:ol2-1delta, gained an additional domain (highlighted with the two red arrowheads), indicating that the deleted block represses activity in that domain. On the other hand, hs865:ol2-1delta shows a reduced or absent expression in the central part of the optic tectum, pointing to an activator function of the deleted block. These results hence provide further evidence that the motifs identified by our approach are likely of functional relevance for the corresponding enhancer.
Additional candidates with reshuffled motif configuration show reporter
activity complementary to the initial enhancer
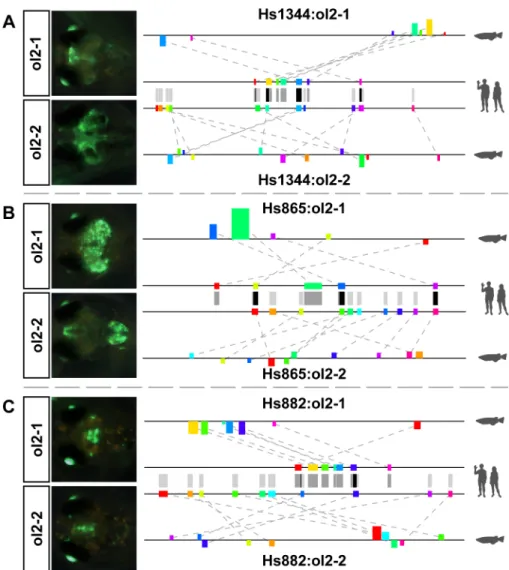
Most of the predicted enhancers tested so far utilize a co-linear motif configuration and hence provide little support for our ability to predict putative CREs based on rearranged motif pat-terns. We therefore searched the top 25 candidates per active enhancer pair for regions that show highest possible motif overlap in the human sequence with those of the initial prediction, this time with a reshuffled motif arrangement in medaka. We identified two additional regions for the enhancers hs1344 and hs865 (hs1344:ol2-2, hs865:ol2-2) that not only contain some of the original motifs in a reshuffled configuration, but are also located far away from any gene orthologous to those in the human locus. Hence, the selected regions are neither related by motif configuration nor by common ancestry but only by the used prediction method and the motifs contained. Nonetheless, both regions show strong activity in neuronal areas in the
Fig 5. Deletion of conserved motifs (grey area) from the predicted fish regions results in change of enhancer activity in both tested constructs. Schematic on the right shows the motif configuration in the human and medaka locus for hs1344 and hs865, respectively. The full grey area is deleted from the medaka enhancer and the remaining sequence tested for reporter expression. Images on the left show the reporter activity of the medaka constructs prior to and after the deletion.Hs1344 1delta gains two symmetrical domains in the midbrain (red arrowheads), while hs865 ol2-1delta shows a loss of expression in the central part of the original domain.
reporter assay (Fig 6A and 6B) like the initially tested candidates for these enhancers. Interest-ingly, in the case of hs865, the composite expression domain of both medaka enhancers over-laps the domain of the human sequence assayed in mouse, indicating a complementary function of both enhancers.
Besides the additional candidates selected for hs1344 and hs865 in the second round, we also found a second region for one of the other enhancers, hs882, in our initial candidate selec-tion phase. Hs882:ol2-2 is just 4kb away from hs882:ol2-1 and hence shares the same associ-ated flanking gene. However, as its score is lower than that of hs822:ol2-1 it was not tested in the first round. Furthermore, apart from the fact that they share the same gene environment, both predictions are very different. Not only do they have almost none of their motifs in
Fig 6. Secondary constructs also show enhancer activity.For each enhancer, the two motif tracks in the middle show the motifs in the human sequence used for prediction of either of the two medaka regions. Grey bars between the tracks are motif projections to the other sequence, black bars indicate motifs shared between both predictions. (A) The secondary construct for hs1344 shows additional expression in more posterior regions of the brain but partially overlaps the domains of the primary construct. (B) The secondary construct for hs865 does not show significant overlap with the primary construct but the combined expression domain of both resembles much better the reported expression domain in mouse (seeS5 Fig). (C) For hs882, one additional candidate was found in close proximity to the initial prediction but sharing almost no motifs. Nonetheless, hs882:ol2-2 shows enhancer activity in the brain like hs882:ol2-1.
common but they also have very different configurations: while the motifs for hs882:ol2-1 are almost strictly co-linear, hs882:ol2-2 uses a highly reshuffled arrangement. But despite those differences, both predicted regions show strong reporter activity in the midbrain (Fig 6C). While looking for an explanation of why two very different regions sharing almost no motif similarity drive reporter gene expression in the same anatomical structure, we found that hs882:ol2-2 is located in a region matching another element in the VISTA enhancer browser (hs431) that was not included in our test set for two reasons: the human sequence for this human-medaka conserved region showed no enhancer activity in the initial mouse screen [39] and it still aligns strongly to the medaka region containing 2. By contrast, hs882:ol2-1 seems to have mutated to an extent that left no significant similarity to hs882. It is interesting that two enhancers located that close to each other and driving overlapping reporter activity seem to be under such different levels of evolutionary constraint in the teleosts while both are under strong constraint from human to chicken. It is further remarkable that almost none of the motifs conserved between hs882 and hs882:ol2-1 are also used in hs882:ol2-2. Hence, hs882:ol2-2 might use a very different logic to generate a very similar outcome. Nonetheless, both medaka regions are not only found by NASCAR but also are included in the 25 highest-scoring predictions (rank 1 for hs882:ol2-1 and 12 for hs882:ol2-2, respectively), despite the fact that two very distinct subsets of sequence from just one human enhancer were used.
Discussion
Since the discovery of the first gene regulatory mechanisms it has been repeatedly suggested that changes in the regulatory landscape, and not genes, might have played–and still play—an important role in phenotypic diversification and perhaps even speciation [9–15]. Unfortu-nately, our understanding of how specific changes in the DNA sequence impinge on gene regu-lation is still rather limited. So far, two main diametrically opposed structural models of enhancers, the enhanceosome and the billboard model, exist, both backed up by thorough anal-ysis and validation [1,16–18]. But while the number of known enhanceosomes will likely increase in the coming years (e.g. due to decreasing costs for high throughput sequencing methods and hence a higher number of fully sequenced, high quality genomes available for multiple sequence alignments), the gain of knowledge about billboard enhancers is uncertain. Unfortunately, this class of enhancers is by far more interesting for the investigation of regula-tory as well as morphological evolution. While enhanceosomes are likely to be identifiable in many species due to their very rigid structure and the little amount of mutations tolerated, they are at the same time unlikely to contribute largely to morphological diversification. Billboard enhancers on the other hand are described as very flexible and only slightly conserved in their sequence and configuration [17] and are therefore more promising to contribute to changes between species. But this inherent flexibility also makes them more difficult to detect by classi-cal means of sequence comparison like pair-wise or multiple alignments.
knowledge about the logic of a given enhancer exists. Even if this knowledge is available, NAS-CAR provides a less biased approach for enhancer prediction, capable of finding additional regions that do not fully fulfil the requirements of ana prioridefined regulatory logic and would be ignored otherwise. The fact that we are able to not only detect enhancer regions missed by alignment algorithms despite the presence of co-linear motif arrangements, but also find additional regions utilizing partially strongly reshuffled motif configurations, clearly shows the usefulness of our approach. The regions found outside of any orthologous context perhaps demonstrate the latter ability best. These regions show strong activity in neuronal structures in the same way as the putative functionally equivalent candidates, clearly indicating that NASCAR is equally able to predict regulatory regions based on motif profiles that do not derive from residual sequence conservation.
Among all successfully validated predictions, hs1344:ol2-1 might be the best example how each of the implemented principles contributes to the prediction process. This region, directly flanked on both sides by genes orthologous to the flanking genes in human, has a strong and a weak rearranged motif supporting a clearly co-linear motif core displaying very significant motif-specific conservation among the teleosts (p<0.01, Wilcoxon rank sum test). Among placental mammals however the conservation is not motif-specific (p = 0.07, Wilcoxon rank sum test). Instead, almost the full central region of the enhancer, including motifs and spacer regions, is conserved. This indicates that a relaxation of the selective pressure in the teleosts allowed the spacer regions to mutate, ultimately splitting the enhancer in a cluster of conserved segments, each on its own too small to be picked up even as an insignificant alignment hit (BlastN bit score<50). Similarly, the combined score of all motifs together is too low to posi-tion the regions high enough among the NASCAR predicposi-tions. However, with support by the implemented pattern detection technique recognizing the co-linear configuration, this enhancer can be ranked high enough to be detected. Hence, all the implemented principles together are necessary to detect this likely functionally equivalent enhancer that is undetectable by standard alignment algorithms.
at least paralog) for a gene in the vicinity of the human enhancer can be found on that chromo-some. In contrast, clusters of orthologs are found on chromosomes 20, 21 and 22. While future improvements of the medaka genome and gene annotation might be able to provide an expla-nation for these findings, it shows that candidate selection by orthologous genes in flanking positions is likely to underestimate the amount of active candidates in our predictions.
Our analysis of two deletion candidates shows that the motifs extracted by NASCAR are indeed of functional relevance for the predicted enhancers. Some of these motifs are also under strong selective pressure that kept them almost identical throughout the ~450Myr of indepen-dent evolution between human and medaka. This motif specific constraint however is over-shadowed by a high rate of sequence turnover in the surrounding regions that makes the enhancers non-alignable and seemingly non-conserved. Given the results presented here it might be necessary to reconsider the criteria used to define whether or not an enhancer is con-served. Five predicted regions with co-linear motif profiles showed activity in our assay, as well as four with reshuffled arrangements. Furthermore, six constructs drive expression in overlap-ping tissues compared to the human counterpart, three of them even result in similar patterns. This is in the range of the 30% reported for putative orthologous enhancers conserved between human and zebrafish [50] and clearly indicates that partially co-linear and/or even fully rear-ranged enhancers might still fulfil the same vital role for organisms in one clade as the fully conserved regions for the species in another. Hence, the current definition of enhancer conser-vation is more a reflection of the detection methods available than of the actual function of the enhancer itself. Future extensions of the principles presented here will hopefully contribute to the development of a new definition and broaden our understanding of enhancer function.
Methods
Fish maintenance
Medaka (Oryzias latipes) stocks were maintained as previously described [51]. In this study only the medaka wild-type Cab line was used. Stock animals were kept in accordance with the German national guidelines (Tierschutzgesetz). Only embryos were treated and always prior to hatching implying that no animal experiments were performed.
VISTA Enhancer sets
We used the VISTA Enhancer browser [39] (state 2010-12-07) to generate a set of validated human enhancers. For this, we applied its internal search routine to extract all human regions (hg19) that show enhancer activity at stage E11.5 in mouse. If enhancers selected this way are closer than 250nt (distance between enhancer boundaries) to one another, these were consid-ered to be“overlapping”and all of them were discarded. The reasoning behind that decision is that the cloning procedure of the enhancer assay used requires ~300nt flanking sequence up-and downstream of each element which would lead to mixed elements of different enhancers that could confound our results. On the other hand, selecting the union of the overlapping regions would result in sequences too long to be cloned. Following these selection and filtering steps we obtained a final set of 629 fully independent human enhancers.
Sequence alignments
We retrieved the repeat-masked sequences of all human enhancers as well as the full medaka genome (ol2) from Ensembl using the Ensembl API (v63) and subsequently aligned them using either LastZ [43] (command-line parameters:—noytrim,—inner = 2000,—masking = 40,
+ Suite v2.2.25) [44] (ftp://ftp.ncbi.nlm.nih.gov/blast/executables/blast+/2.2.25/) (BlastN com-mand-line parameters: -reward 2, -penalty -3, -gapopen 5, -gapextend 2, -word_size 7, -dust "20 64 1", -soft_masking TRUE). As BlastN, in contrast to LastZ, only reports the highest scor-ing alignment hit, we used different E-value filters to produce more extensive hit lists for BlastN. These were subsequently filtered to form sets containing either only significantly align-ing hits (bit score>= 50) or 25 hits with the highest bit score per enhancer. Ties amongst these 25 were resolved by sorting hits first by the length of the hit in decreasing order and sec-ond by chromosomal coordinates in ascending order (alphanumeric sorting for
chromosomes).
Orthologous gene sets
To perform the assignment of orthologous genes to enhancer-candidate pairs we first selected all protein coding genes in the human and medaka genome according to the Ensembl gene build (v63). Based on their transcription start site (TSS), we then assigned all the genes in a window of 1.5Mb up- and down-stream of its boundaries to a given human enhancer. Each of the gene sets generated in this way had to contain at least five genes on each side of its assigned enhancer. In cases where this criterion was not met, we extended the margin on either side to reach the minimum number of genes. Using Ensembl Compara (v63) we then checked for each gene in a given human gene set whether it is orthologous to a gene in the gene set gener-ated for the predicted corresponding medaka region. Paralogs were not considered. Each pre-dicted medaka region was then categorized based on the existence of and the relative position to an orthologous gene. We called a candidate“double flanked”if orthologs of both flanking genes in human also flank the medaka predicted regions,“single flanked”(just one of the flank-ing genes still in flankflank-ing position),“near flank”(an ortholog of a flanking gene in human is still within the set distance and gene cuttoffs in medaka but not directly flanking the predic-tion),“not flanked”(orthologous gene within the cutoff but not flanking in human), and“not orthologous”(not a single orthologous gene near).
Motif filtering
To reduce the amount of“noise”signal generated by small and abundant motifs, we deter-mined the threshold for arbitrary matches by scanning a set of variably sized enhancers against the target genome and assessed the relative occurrence of perfect-matching words for all extracted windows. Our analysis shows that words shorter than 12nt not only occur in more than 50% of all windows but also accumulate per window with increasing enhancer size (S2 Fig). Motifs with a score below that of a 12-mer were hence excluded for similarity assessment.
Profile generation
by their score and then mapped to the target, starting with the highest scoring. The score of each motif is determined by
mScore
i ¼ ðpispþqisqÞ m Length
i ð1Þ
with M = {m1,m2,. . .,mw}, M = all motifs in target window,pi,qi= matching/mismatching
nucleotides inmi;sp,sq= scores for matching/mismatching nucleotides. Overlapping motifs
are truncated to their next matching nucleotide and rescored as long as they still contain a per-fect matching region of at least minimum seed size (k= 8nt by default). The only exceptions are motifs of equal score, which are allowed to overlap. Thisfiltered motif set forms thefinal target profile.
Score calculation
The NASCAR score is calculated for every window sliding along the given target sequence as done for alignment-free algorithms (default: window size = enhancer length, stepping 25%). For this, all motifs in the target profile that are either contained in the window area or overlap its boundaries are selected. The extracted profile is then filtered for word overlap in the query sequence identical to the target filtering procedure, resulting in the fully filtered profile. All words above or equals the minimal score cutoff (default: score of a perfect matching 12-mer) are then used to calculate the final similarity score for the target window (“ScorePURE”,MValid=
all motifs above threshold after filtering):
ScorePURE¼
X
mi2MValid
mScore
i ð2Þ
Pattern detection
In a parallel approach, clusters of co-linear motifs within a certain distance and query-target shift (default:MaxDistance= 200nt,MaxShift= 25nt) are traced in the fully filtered profile. For
this, all motifs above the score threshold are ranked again in decreasing order. Then, starting at the strongest motif, two elliptical motif-spaces along the current motif diagonal and overlap-ping in one focus are computed, with the motif placed in the overlapoverlap-ping focus (S3 Fig). The distance between the two foci in query or target corresponds thereby to the enhancer length. This allows detection of patterns spanning the full window size. All motifs located with their centre within these motif spaces and an inter-motif distance (i.e. distance between end of one motif and start of the subsequent one) smaller or equalsMaxDistanceare combined into a motif
pattern. Once a motif is assigned to a pattern it is removed from the motif list and cannot be used for any other pattern. All patterns of three or more motifs containing at least two words scoring at or above the threshold level are valid. This allows inclusion of motifs even below threshold as long as the previous requirement is met. For each motif pattern consisting of m motifs the mean motif distance and the pattern shift (i.e. the weighted midline of the pattern) are calculated:
MeanDistance¼
X jMpj 1
i¼1 ðmStart
iþ1 m
End i Þ
jMpj 1
ð4Þ
PatternShift¼
X
mi2Mp
ðmLengthi m Shift i Þ
X
mi2Mp
mLengthi
ð5Þ
Then, two correction factors are calculated and used to assign a weight to each motif in the pattern:
FactorDistance¼1
MeanDistance
MaxDistance
ð6Þ
Factori
Shift ¼1
jmShifti PatternShiftj
2MaxShift
ð7Þ
mWeighti ¼meanðFactorDistance;Factor i
ShiftÞ ð8Þ
The final pattern score, i.e. the weighted sum of all contained motifs, is then added to the previously computed“ScorePURE”to form the final score (“ScoreCOMB”):
PatternScore¼X
jMpj
i¼1 mScore
i m
Weight
i ð9Þ
ScoreCOMB¼ScorePUREþPatternScore ð10Þ
Definition of predicted regions
All regions that have a NASCAR score above a set threshold were considered as predictions. These regions are continuous intervals in the target sequence starting at the first window scor-ing above the threshold and endscor-ing as soon as the score drops below this limit. Default thresh-old is three times the median absolute deviation (MAD) above the median NASCAR score for all windows assessed for the corresponding enhancer. Regions were called individually for the basic (“PURE”) score and the score including patterns (“COMB”).
Random motif sets
Evolutionary conservation
We analysed the conservation of NASCAR motifs by averaging across the compiled conserva-tion informaconserva-tion of all nucleotides forming a motif. The conservaconserva-tion data (PhastCons scores) for placental mammals (mammal sub set of the 46-way MultiZ vertebrate alignment) and tele-osts (5-way MultiZ alignment) was obtained from the UCSC Genome Browser (http:// hgdownload.cse.ucsc.edu/goldenPath/hg19/phastCons46way/placentalMammals/,http:// hgdownload.cse.ucsc.edu/goldenPath/oryLat2/phastCons5way/).
Prediction of enhancers with EEL
We downloaded EEL (Enhancer Element Locator) from its GitHub repository (https://github. com/kpalin/EEL) as of 27thof January 2015. As TFBS motifs we used the CORE Vertebrata database from Jaspar version 5. We used EEL in its command line mode with the following command structure:
eel -as <humanSeq> -as <medakaSeq> -am <MotifsFolder> -getTFBS -align -sa -no-gui -savealign <outputFile>
In all cases the input sequences are repeat-masked and obtained as mentioned above. We run EEL independently for each medaka chromosome and included the parameter–more 10to allow more predictions per run. Then, for each query human enhancer we sorted all the reported predictions and selected the top 25 with highest score.
Cloning
We used an Hsp70 basal promoter driving eGFP in a cassette flanked by ISceI restriction sites for efficient integration into the genome at early stages of embryonic development[41]. We amplified all fragments from human or medaka genomic DNA by PCR using Phusion DNA Polymerase and the primers specified inS2 Table. For detection of their putative enhancer activity we ligated the fragments containing putative regulatory elements (or control sequences) upstream of the HSP70 promoter. Resulting constructs were tested by restriction digest and injection grade DNA was prepared following the MidiPrep protocol of the QIAGEN Plasmid Purification kit.
Microinjection
Injections were performed following the meganuclease approach as described previously [52,53]. The efficiency of the meganuclease mediated transgenesis in medaka results in uniform expression patterns and a low degree of mosaicism already in the injected generation. This facilitates the effective detection of enhancer activity even if active only in few cells. In brief, medaka embryos were microinjected into the cytoplasm at the one cell stage. The concentra-tion of the reporter construct was at 10 ng/μl. DNA was diluted in 1x ISceI buffer, containing ISceI enzyme (NEB) at a concentration of 1U/μl. The DNA/enzyme mix was kept on ice prior to microinjection. For each construct at least 50 surviving embryos were scored.
Deletion constructs
We generated deletion constructs by following the procedure described in [54]. In short, we used additional primers directed away from the deletion site together with the original primers for the constructs. Each of the deletion primers thereby also contains a 13-15nt fragment 5’of its start position in the construct, which is complementary to the sequence on the other flank of the deletion site. Using always one standard and one deletion primer led to amplification of just the flanking regions in the construct. After purification of the fragments, both were used in one reaction together with the standard primers leading to a fusion construct lacking the tar-geted deletion site.
Ethics Statement
All fish are maintained in closed stocks at Heidelberg University. In this study only the medaka
(Oryzias latipes) wild-type Cab line was used. Stock animals are kept according to local animal
welfare standards (Tierschutzgesetz §11, Abs. 1, Nr. 1, husbandry permit number 35–9185.64/ BH Wittbrodt) and in accordance with European Union animal welfare guidelines. Only embryos were treated and always prior to hatching implying that no animal experiments were performed. The fish facility is under the supervision of the Interfacultary Biomedical Faculty (IBF) of the University of Heidelberg.
Supporting Information
S1 Fig. Illustration of problems of motif-based sequence comparison.Best case-scenario of an enhancer consisting only of directly adjacent functional motifs (uni-coloured boxes). Motifs are extracted independently from query and target sequence in an overlapping fashion with each motif being shifted by one nucleotide compared to the previous. (A) In case both sequences are identical, the resulting profiles are maximally overlapping as each motif in one sequence has a corresponding match in the other. (B) Single nucleotide changes in one of the two sequences (positions marked by white“x”on black background) however remove all motifs overlapping this event from the matching profile (empty boxes). Each point mutation can thereby delete up to k (k = motif size) motifs (B, upper panel). Scattered mutations across the entire sequence can hence lead to a strong reduction of matching motifs and thereby hide all existing similarity. This is clearly different to alignment algorithms, which remain mostly unaffected as long as at least one continuous matching region (“seed”) exists that allows exten-sion across the contained mutations (B, lower panel). (C) Permutation of individual motifs can have a very similar effect on the matching profile, as all motifs overlapping the boundary will not exist anymore after the position change. The strength of a permutation event thereby depends on the context (C, upper vs. lower panel). The main problem however is that the majority of motifs are context dependent (A to C, mixed coloured motifs). By that, the maxi-mum signal intensity can be only reached if co-linearity is kept which is contrary to the idea of using alignment-free methods for the detection of rearranged regions. (D) Furthermore, the alignment-free principle by itself cannot discriminate between important and unimportant motifs. As a result, an arbitrary sequence can generate as many matching motifs as a permuted one that has kept its functionality (D, upper vs. lower panel). But as more context dependent than functional motifs exist within billboard enhancers, permuted arrangements of non-func-tional motifs are much more likely to happen.
(TIF)
on the size. (A) Perfect matching motifs smaller or equals 11nt (vertical blue line) occur in more than 50% of all windows in the medaka genome (horizontal red line). (B) Additionally, matching motifs up to that size accumulate per window with increasing window size, indicat-ing that they are likely arbitrary matches between both sequences.
(TIF)
S3 Fig. Pattern detection.For each motif above threshold (grey bars) two elliptic spaces (upstream ellipse drawn only dotted; a,b,e are standard values of ellipses) are computed with the motif being located in the overlapping focus point (FC). All motifs within those spaces that are also within the set inter-motif distance form a pattern even if they are below the score threshold (orange bar). At least three motifs have to be combined in that way, two of them above score threshold.
(TIF)
S4 Fig. Definition of the gene environment per enhancer/prediction.For each enhancer/ prediction (filled triangles) a region 1.5Mb up- and downstream was selected (correspondingly coloured arcs). In case the up- or downstream region contained less than five genes (upper sequence, left side), additional genes in the same direction were included to reach a minimum of five. Genes orthologous between the human and medaka set (black rectangles, flanking genes in purple) are connected with dashed lines (non-orthologous genes in grey) Following the colour gradient from dark blue to light blue, predictions are:“double flanked”,“single flanked”,“near the ortholog of a former flanking gene”,“near an orthologous (formerly not flanking) gene”.
(TIF)
S5 Fig. Selected enhancer elements.Eight selected human VISTA enhancers show activity in the medaka reporter assay (column“Human in Medaka”in A), indicating that the“trans” envi-ronment is still capable of activating these enhancers despite the ~450Myr of independent evo-lution. Six of eight predicted medaka regions also show enhancer activity (column“Medaka in Medaka”in A). Activity is visible in most cases in the brain and other neuronal structures. Interestingly, in most of the cases the reported expression pattern of the human enhancer in mouse (column“Human in Mouse”in A) resembles the expression pattern of the human or medaka sequences in medaka. Lens activity is part of the reporter construct and allows to dis-tinguish between successful and negative injections. All pictures are taken at 10 days post injec-tion (10dpi). Mouse pictures were downloaded fromhttp://enhancer.lbl.gov/. (B) Comparison of the known human enhancer sequence and the predicted enhancer in medaka. The coloured boxes represent the motifs identified by NASCAR to assess the similarity of each pair. Upper track always displays the motif positions in the human sequence (colour coded by position), lower track shows the configuration in the medaka region. All Motifs are draw in size relative to the used window size. Motif heights in the lower track represent the motif score, orientation (up/down) indicates the relative orientation (forward/reverse) compared to the query
sequence. (TIF)
S1 Table. Alignment hits.BlastN alignment hit for the human enhancer on the medaka genome. DF =“double flanked”, SF =“single flanked”, NF =“no flanked”.
(XLSX)
S3 Table. Summary of the injection experiments. (XLSX)
S1 File. Supplementary methods. (DOCX)
Acknowledgments
We want to thank Tanja Kellner, Beate Wittbrodt, and Lea Schertel for helping with prepara-tions for injecprepara-tions and animal handling. We also thank all members of the Wittbrodt lab for continuous support and critical comments to the manuscript.
Author Contributions
Conceived and designed the experiments: DD LE JW. Performed the experiments: DD ME RS RR BH DI LC. Analyzed the data: DD JLM. Wrote the paper: DD JLM JW. Computational design: DD JLM.
References
1. Panne D, Maniatis T, Harrison SC (2007) An atomic model of the interferon-beta enhanceosome. Cell 129: 1111–1123. PMID:17574024
2. Pennacchio LA, Ahituv N, Moses AM, Prabhakar S, Nobrega MA, Shoukry M, et al. (2006) In vivo enhancer analysis of human conserved non-coding sequences. Nature 444: 499–502. PMID: 17086198
3. Pennacchio LA, Rubin EM (2001) Genomic strategies to identify mammalian regulatory sequences. Nat Rev Genet 2: 100–109. PMID:11253049
4. Nobrega MA, Ovcharenko I, Afzal V, Rubin EM (2003) Scanning human gene deserts for long-range enhancers. Science 302: 413. PMID:14563999
5. Visel A, Bristow J, Pennacchio LA (2007) Enhancer identification through comparative genomics. Semin Cell Dev Biol 18: 140–152. PMID:17276707
6. Bejerano G, Pheasant M, Makunin I, Stephen S, Kent WJ, Mattick JS, et al. (2004) Ultraconserved ele-ments in the human genome. Science 304: 1321–1325. PMID:15131266
7. Visel A, Prabhakar S, Akiyama JA, Shoukry M, Lewis KD, Holt A, et al. (2008) Ultraconservation identi-fies a small subset of extremely constrained developmental enhancers. Nat Genet 40: 158–160. doi: 10.1038/ng.2007.55PMID:18176564
8. Ovcharenko I (2008) Widespread ultraconservation divergence in primates. Mol Biol Evol 25: 1668–
1676. doi:10.1093/molbev/msn116PMID:18492662
9. King MC, Wilson AC (1975) Evolution at two levels in humans and chimpanzees. Science 188: 107–
116. PMID:1090005
10. Jacob F (1977) Evolution and tinkering. Science (80-) 196: 1161–1166. PMID:860134
11. Prud’homme B, Gompel N, Rokas A, Kassner VA, Williams TM, Yeh S-D, et al. (2006) Repeated mor-phological evolution through cis-regulatory changes in a pleiotropic gene. Nature 440: 1050–1053. PMID:16625197
12. Marcellini S, Simpson P (2006) Two or four bristles: functional evolution of an enhancer of scute in Dro-sophilidae. PLoS Biol 4: e386. PMID:17105353
13. Chan YF, Marks ME, Jones FC, Villarreal G, Shapiro MD, Brady SD, et al. (2010) Adaptive evolution of pelvic reduction in sticklebacks by recurrent deletion of a Pitx1 enhancer. Science 327: 302–305. doi: 10.1126/science.1182213PMID:20007865
14. Jones FC, Grabherr MG, Chan YF, Russell P, Mauceli E, Johnson J, et al. (2012) The genomic basis of adaptive evolution in threespine sticklebacks. Nature 484: 55–61. doi:10.1038/nature10944PMID: 22481358
15. Tung J, Primus A, Bouley AJ, Severson TF, Alberts SC, Wray GA (2009) Evolution of a malaria resis-tance gene in wild primates. Nature 460: 388–391. doi:10.1038/nature08149PMID:19553936 16. Romano LA, Wray GA (2003) Conservation of Endo16 expression in sea urchins despite evolutionary
17. Brown CD, Johnson DS, Sidow A (2007) Functional architecture and evolution of transcriptional ele-ments that drive gene coexpression. Science 317: 1557–1560. PMID:17872446
18. Swanson CI, Evans NC, Barolo S (2010) Structural rules and complex regulatory circuitry constrain expression of a Notch- and EGFR-regulated eye enhancer. Dev Cell 18: 359–370. doi:10.1016/j. devcel.2009.12.026PMID:20230745
19. Ludwig MZ, Bergman C, Patel NH, Kreitman M (2000) Evidence for stabilizing selection in a eukaryotic enhancer element. Nature 403: 564–567. PMID:10676967
20. Hare EE, Peterson BK, Iyer VN, Meier R, Eisen MB (2008) Sepsid even-skipped enhancers are func-tionally conserved in Drosophila despite lack of sequence conservation. PLoS Genet 4: e1000106. doi: 10.1371/journal.pgen.1000106PMID:18584029
21. Howard ML, Davidson EH (2004) cis-Regulatory control circuits in development. Dev Biol 271: 109–
118. PMID:15196954
22. Philippakis AA, He FS, Bulyk ML (2005) Modulefinder: a tool for computational discovery of cis regula-tory modules. Pac Symp Biocomput: 519–530. PMID:15759656
23. Blanchette M, Bataille AR, Chen X, Poitras C, Laganière J, Lefèbvre C, et al. (2006) Genome-wide computational prediction of transcriptional regulatory modules reveals new insights into human gene expression. Genome Res 16: 656–668. PMID:16606704
24. Hallikas O, Palin K, Sinjushina N, Rautiainen R, Partanen J, Ukkonen E, et al. (2006) Genome-wide prediction of mammalian enhancers based on analysis of transcription-factor binding affinity. Cell 124: 47–59. PMID:16413481
25. He X, Ling X, Sinha S (2009) Alignment and prediction of cis-regulatory modules based on a probabilis-tic model of evolution. PLoS Comput Biol 5: e1000299. doi:10.1371/journal.pcbi.1000299PMID: 19293946
26. Taher L, McGaughey DM, Maragh S, Aneas I, Bessling SL, Miller W, et al. (2011) Genome-wide identifi-cation of conserved regulatory function in diverged sequences. Genome Res 21: 1139–1149. doi:10. 1101/gr.119016.110PMID:21628450
27. Sosinsky A, Honig B, Mann RS, Califano A (2007) Discovering transcriptional regulatory regions in Dro-sophila by a nonalignment method for phylogenetic footprinting. Proc Natl Acad Sci U S A 104: 6305–
6310. PMID:17395715
28. Hide W, Burke J, Davison DB (1994) Biological evaluation of d2, an algorithm for high-performance sequence comparison. J Comput Biol 1: 199–215. PMID:8790465
29. Stuart G, Moffett K, Baker S (2002) Integrated gene and species phylogenies from unaligned whole genome protein sequences. Bioinformatics 18: 100–108. PMID:11836217
30. Vinga S, Almeida J (2003) Alignment-free sequence comparison-a review. Bioinformatics 19: 513–
523. PMID:12611807
31. Van Helden J (2004) Metrics for comparing regulatory sequences on the basis of pattern counts. Bioin-formatics 20: 399–406. PMID:14764560
32. Chan BY, Kibler D (2005) Using hexamers to predict cis-regulatory motifs in Drosophila. BMC Bioinfor-matics 6: 262. PMID:16253142
33. Kantorovitz MR, Robinson GE, Sinha S (2007) A statistical method for alignment-free comparison of regulatory sequences. Bioinformatics 23: i249–i255. PMID:17646303
34. Arunachalam M, Jayasurya K, Tomancak P, Ohler U (2010) An alignment-free method to identify candi-date orthologous enhancers in multiple Drosophila genomes. Bioinformatics 26: 2109–2115. doi:10. 1093/bioinformatics/btq358PMID:20624780
35. Kantorovitz MR, Kazemian M, Kinston S, Miranda-Saavedra D, Zhu Q, Robinson GE, et al. (2009) Motif-blind, genome-wide discovery of cis-regulatory modules in Drosophila and mouse. Dev Cell 17: 568–579. doi:10.1016/j.devcel.2009.09.002PMID:19853570
36. Swanson CI, Schwimmer DB, Barolo S (2011) Rapid evolutionary rewiring of a structurally constrained eye enhancer. Curr Biol 21: 1186–1196. doi:10.1016/j.cub.2011.05.056PMID:21737276
37. Blanchette M, Kent WJ, Riemer C, Elnitski L, Smit AFA, Roskin KM, et al. (2004) Aligning multiple geno-mic sequences with the threaded blockset aligner. Genome Res 14: 708–715. PMID:15060014 38. Brudno M, Morgenstern B (2002) Fast and sensitive alignment of large genomic sequences. Proc IEEE
Comput Soc Bioinform Conf 1: 138–147. PMID:15838131
39. Visel A, Minovitsky S, Dubchak I, Pennacchio LA (2007) VISTA Enhancer Browser—a database of tis-sue-specific human enhancers. Nucleic Acids Res 35: D88–D92. PMID:17130149
41. Mongin E, Auer TO, Bourrat F, Gruhl F, Dewar K, Blanchette M, et al. (2011) Combining computational prediction of cis-regulatory elements with a new enhancer assay to efficiently label neuronal structures in the medaka fish. PLoS One 6: e19747. doi:10.1371/journal.pone.0019747PMID:21637758 42. Dunham I, Kundaje A, Aldred SF, Collins PJ, Davis CA, Doyle F, et al. (2012) An integrated
encyclope-dia of DNA elements in the human genome. Nature 489: 57–74. doi:10.1038/nature11247PMID: 22955616
43. Harris RS (2007) Improved pairwise alignment of genomic DNA. Pennsylvania State University. 44. Camacho C, Coulouris G, Avagyan V, Ma N, Papadopoulos J, Bealer K, et al. (2009) BLAST+:
architec-ture and applications. BMC Bioinformatics 10: 421. doi:10.1186/1471-2105-10-421PMID:20003500 45. Yip KY, Cheng C, Bhardwaj N, Brown JB, Leng J, Kundaje A, et al. (2012) Classification of human
genomic regions based on experimentally determined binding sites of more than 100 transcription-related factors. Genome Biol 13: R48. doi:10.1186/gb-2012-13-9-r48PMID:22950945
46. Siepel A, Bejerano G, Pedersen JS, Hinrichs AS, Hou M, Rosenbloom K, et al. (2005) Evolutionarily conserved elements in vertebrate, insect, worm, and yeast genomes. Genome Res 15: 1034–1050. PMID:16024819
47. Palin K, Taipale J, Ukkonen E (2006) Locating potential enhancer elements by comparative genomics using the EEL software. Nat Protoc 1: 368–374. PMID:17406258
48. Mathelier A, Zhao X, Zhang AW, Parcy F, Worsley-Hunt R, Arenillas DJ, et al. (2014) JASPAR 2014: an extensively expanded and updated open-access database of transcription factor binding profiles. Nucleic Acids Res 42: D142–D147. doi:10.1093/nar/gkt997PMID:24194598
49. Odom DT, Dowell RD, Jacobsen ES, Gordon W, Danford TW, MacIsaac KD, et al. (2007) Tissue-spe-cific transcriptional regulation has diverged significantly between human and mouse. Nat Genet 39: 730–732. PMID:17529977
50. Ritter DI, Li Q, Kostka D, Pollard KS, Guo S, Chuang JH (2010) The importance of being cis: evolution of orthologous fish and mammalian enhancer activity. Mol Biol Evol 27: 2322–2332. doi:10.1093/ molbev/msq128PMID:20494938
51. Koster R, Stick R, Loosli F, Wittbrodt J (1997) Medaka spalt acts as a target gene of hedgehog signal-ing. Development 124: 3147–3156. PMID:9272955
52. Thermes V, Grabher C, Ristoratore F, Bourrat F, Choulika A, Wittbrodt J, et al. (2002) I-SceI meganu-clease mediates highly efficient transgenesis in fish. Mech Dev 118: 91–98. PMID:12351173 53. Rembold M, Lahiri K, Foulkes NS, Wittbrodt J (2006) Transgenesis in fish: efficient selection of
trans-genic fish by co-injection with a fluorescent reporter construct. Nat Protoc 1: 1133–1139. PMID: 17406394