Vol. 7, No. 12, 2016
Measuring the Data Openness for the Open Data in
Saudi Arabia e-Government
–
A Case Study
Marwah W. AlRushaid and Abdul Khader Jilani Saudagar
Information Systems Department, College of Computer and Information Sciences Al Imam Mohammad Ibn Saud Islamic University (IMSIU)
Riyadh, Saudi Arabia
Abstract—Conceptually, data can be found at the lowest level of abstraction from where information and knowledge are being extracted. Furthermore, data itself has no meaning, unless it’s being interpreted and transferred into information and knowledge. Thus, all governments have come to appreciate the relevance between releasing data and obtaining information and knowledge in return. However, the abstract nature of data with the undefined benefits to everyday life has slowed down the awareness of public to open data and its relevance. Thus, the increasing efforts by governments in embracing open data agendas may not be clear and shared among people. Most of the open government data initiatives focus on the technology needed to support the usability and accessibility of data. However, this focus has not been proven to increase citizens’ awareness. Citizens’ awareness of open data practices must be carefully measured as without citizen engagement, open government data is useless.
The purpose of this research is to measure data openness level of Saudi Arabia e-Government Data Portal. Moreover, a proposed model by the researcher, which is based on a scoring model by Global Open data index, is used to measure data openness level of Saudi Arabia e-Government Data Portal.
Keywords—abstraction; accessibility; awareness; benchmarking; e-Government; knowledge; information; openness
I. INTRODUCTION
Governments across the world are now releasing vast amounts of data in an accelerated fashion. Yet while some of the released data is easily reachable, some are still trapped in paper. Thus, there is a degree to how ―open‖ data is, and then, how much value data can create as a result. Through all levels of government, millions of data records are collected and stored ranging from unemployment rate to energy use. Much of this data can be readily shared to the public, enabling third parties to create innovative services and products1. Thus, by making government data available, public services can be better analyzed by organizations and citizens. Therefore, it can help to identify the subsequent improvement and even inefficiencies. This innovative use of open government data by entrepreneurs and volunteers can greatly stimulate economic growth. In specific, the value that the data can create depends on how open is the data. This imposes a need for an evaluation assessment of Open Government data in
1
http://beyondtransparency.org/chapters/part-3/generating-economic-value-through-open-data/
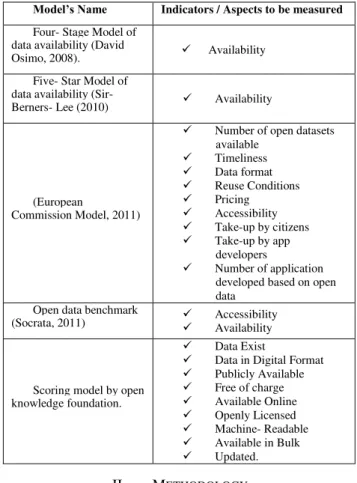
term of data openness2. The evaluation of data openness level attracts academic‘s attention to be one of the extensively covered topics over the past several years. Some of the approaches include evaluating a set of chosen open data characteristics to determine specific aspect such as (data quality), whereas others are oriented toward evaluating data openness in general. For example, a five-stage model [1] is proposed to evaluate the availability feature of open data. If data are not available, the availability is considered stage 0. If data are obtainable, availability reaches stage 1. When data are available in a non- machine- readable format, the availability is in stage 2. If data are in a machine-readable format, the availability reaches stage 3. Finally, when all requirements are fulfilled and data become visualizable, the availability reaches stage 4.
Sir- Berners- Lee proposed a star rating system model for evaluating the extent of public data availability3. According to the model, data receive one star if they are available on the web and license- free. If data are published in a machine- readable format, two stars will be appointed. Three stars are given if data are published in a nonproprietary format. When data comply with all previous conditions and additionally use semantic web standards related to identifying things, data receives four stars. If all mentioned rules are met and data are provided with context, data receives five stars.
The first three stages of the star-rating model match the three stages from Osimo‘s models, whereas the latter two of the star- rating models focus on the linked feature of data. Thus, a higher value is given to data, which can be reused and whose context is defined through linked information. The star-rating model promotes a need to focus on data structuring and formatting rather than publishing it on a simple format such as PDF Files. Both Osimo‘s model and star- rating model focus only in one feature of open data: data availability. Although data availability is one of the major features that defines open data; it‘s not the only one. Thus, none of the mentioned models can be used solely to measure the level of data openness.
The European commission4 has performed a study on open data portals through a web-survey and in-depth interviews
2
http://www.opendataimpacts.net/2011/11/evaluating-open-government-data-initiatives-can-a-5-star-framework-work/
3 https://www.w3.org/DesignIssues/LinkedData.html
4
with government representatives. The survey was made on selected data portals worldwide. The European commission has used a star rating system model by Sir- Berners- Lee to measure data availability. However, more detailed sub-indicators were defined to clearly measure the result. Unfortunately, the study didn‘t go any further rather than listing the obtained results. They didn‘t create a path nor provided a calculation for measuring data portals openness [2]. Therefore, this study can be considered as a great resource for benchmarking methodology, but it lacks processing methods, which are crucial in measuring, classifying and comparing different open government data portals.
Socrata Company5 has also shown an interest in assessing open government data. The company performed a study of open government data through three surveys targeting: government, citizens, and developers. The survey was published in a form of questionnaires with the goal of assessing open government data from the perspective of government, data consumers and data contributors. Later, the results of the survey were categorized into five groups: attitudes and motivation, current states of open data, current states of data availability, high value data, engagement and participation.
The open knowledge foundation group has defined a scoring model, which contains a set of nine principles of open government data. These are: Data Exist, Data in Digital Format, Publicly Available, Free of charge, Available Online, Openly Licensed, Machine- Readable, Available in Bulk, Updated. Those principles are based on the eight principles of open government data established by the open data working group6. Thus, unlike other models, the scoring model contains well-defined Open Government data principles; it provides a practical determination of the extent of fulfillment of open government's primary goals. Other initiative focus on one feature of open government data and can‘t be used solely to measure the level of data openness. The model now is globally accepted as guidelines for open governmental data. Moreover, the recognized indicators in other benchmarks models can be mapped onto these nine principles/indicators of scoring model. For example, The European commission model provides many indicators, which are similar to the scoring model by open knowledge foundation such as: timeliness, machine- readable, license-free). However, the European commission went beyond the scope of open government data by defining additional indicators such as pricing.
A. Open Government Data in Saudi Arabia (2012- 2016) As the concept of open government data gained momentum all over the world, Saudi Arabia was not left behind. Although the tech-based modernization in Saudi Arabia has started decades ago, its official e-government program started only a few years ago with the launch of ―Yesser‖ in 2005 [3]. The primary aim of YESSER, an e-government initiative was to create and encourage the use of digital programs by the government. The implementation of the program was in two stages. The first phase was from the year 2006 to 2010, and the second phase is from 2012 to 2016
5 https://socrata.com/
6 http://www.opengovpartnership.org/groups/opendata
(―The National Strategy and The e-Government Action Plan, 2016‖). As a start, the aim of the program was to assist the government in offering better services to the citizens. Later, a new era of e-government has started in Saudi Arabia by launching Open Government Data Initiatives7 in 2011. Delivering data through the national portal as well as through the website of the ministry of the economy was the approach that Saudi Arabia followed in term of launching its Open Government Data [4]. The government aim was to enable transparency, promote citizens participation and inspire innovation. Therefore, open government data was implemented in all the ministries. However, the implementation and adoption of open government data in Saudi Arabia had faced many challenges and criticism, and it explains why the data dissemination scored low in the international threshold8. An overview of the different models for measuring open government data is as shown in Table 1.
TABLE I. OVERVIEW OF THE DIFFERENT MODELS FOR MEASURING
OPEN GOVERNMENT DATA
II. METHODOLOGY
A. Measuring Data Openness Level
The purpose of the research presented in this section is to suggest and apply a model for measuring data openness, which relies on global data index‘ scoring model established by Open Knowledge Foundation. The literature review has entailed that unlike other models, the scoring model contains
7 https://dohanews.co/opinions-sought-new-policy-open-govt-data-public/ 8
https://www.capgemini.com/resources/the-open-data-economy-unlocking-economic-value-by-opening-government-and-public-data
Model’s Name Indicators / Aspects to be measured
Four- Stage Model of data availability (David
Osimo, 2008). Availability Five- Star Model of
data availability (Sir-
Berners- Lee (2010) Availability
(European
Commission Model, 2011)
Number of open datasets available
Timeliness
Data format
Reuse Conditions
Pricing
Accessibility
Take-up by citizens
Take-up by app developers
Number of application developed based on open data
Open data benchmark
(Socrata, 2011) Accessibility Availability
Scoring model by open knowledge foundation.
Data Exist
Data in Digital Format
Publicly Available
Free of charge
Available Online
Openly Licensed
Machine- Readable
Available in Bulk
Vol. 7, No. 12, 2016 well-defined Open Government data principles. Moreover, it
provides a practical determination of the extent of fulfillment of open government's primary goals plus neither of the other existing models can be used alone to measure data openness level. In specific, the exclusivity and non-overlapping nature of the model‘s factors enable the model to be used for evaluation purposes. In fact, the scoring model was used by the organization to measure the openness level of 122 governments‘ data portals around the world (including Saudi Arabia). The evaluation was accomplished with the assistance of volunteers and organization members based on the information made available via governments‘ datasets on its online data portals. This enables government progress by giving them a baseline and measurement tool for enhancement of the open government data ecosystem in their country. Like any other evaluation tool, the scoring model by Global Data Index tries to answer a question: ―What‘s the status of open data around the world?‖ and then other questions emerge: ―Which is the most/least open country?,‖ ―Which is the most/least open datasets within each evaluated country?‖.
Since each country has a different governance structure as well as different policies in regard to open data, key assumptions were developed by the organization to be taken into consideration when assessing and collecting the data.
Assumption 1: Unified definition of Open Government Data Global Open Data Index has defined open data in accordance with ‗Open Definition‘9
. The Open definition is a simple and easy to operationalize a set of principles which define data openness in relation to content and data.
Assumption 2: The role of government is to publish data there have been questions about the role of the government when some of the government data are privatized (produced and owned by a third- party).
Assumption 3: National government is accountable to publish data for all its sub- governments each country has a different governance structure and varies in the centralization of its services. Some have a major government with municipalities; others have sub-governments with much more complicated structures. Open data index assumptions is that national government must be the aggregator of all sub- governments data.
B. Datasets Assessment
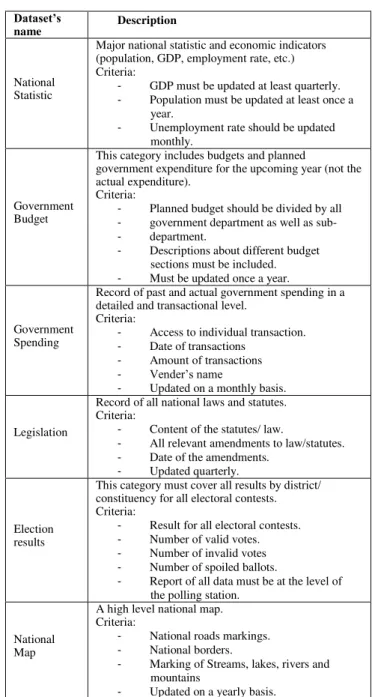
Since the evaluation is based on the information made available via governments‘ datasets on its online data portals, it‘s crucial to set guidelines for each dataset to ensure it‘s comparable across countries and to enable accurate assessment. This year, open data index have refined the guidelines for the datasets10.
1) Each dataset must have at least 3 key data criteria: open data index has set at least 3 key data characteristic for each dataset.
9 http://opendefinition.org/
10 http://index.okfn.org/
2) Datasets need to be updated but how often each dataset need to be updated varies: a timeframe was assigned for each dataset since they have different times in which they need to be updated. Thus, the question ―is data updated?‖ can be easily answered.
3) There must be a list of unified datasets for evaluation: Table 2 below shows the full list of the selected datasets for evaluation.
TABLE II. LIST OF THE SELECTED DATASETS FOR EVALUATION
Dataset’s
name Description
National Statistic
Major national statistic and economic indicators (population, GDP, employment rate, etc.) Criteria:
- GDP must be updated at least quarterly.
- Population must be updated at least once a year.
- Unemployment rate should be updated monthly.
Government Budget
This category includes budgets and planned
government expenditure for the upcoming year (not the actual expenditure).
Criteria:
- Planned budget should be divided by all
- government department as well as sub-
- department.
- Descriptions about different budget sections must be included.
- Must be updated once a year.
Government Spending
Record of past and actual government spending in a detailed and transactional level.
Criteria:
- Access to individual transaction.
- Date of transactions
- Amount of transactions
- Vender‘s name
- Updated on a monthly basis. Legislation
Record of all national laws and statutes. Criteria:
- Content of the statutes/ law.
- All relevant amendments to law/statutes.
- Date of the amendments.
- Updated quarterly.
Election results
This category must cover all results by district/ constituency for all electoral contests. Criteria:
- Result for all electoral contests.
- Number of valid votes.
- Number of invalid votes
- Number of spoiled ballots.
- Report of all data must be at the level of the polling station.
National Map
A high level national map. Criteria:
- National roads markings.
- National borders.
- Marking of Streams, lakes, rivers and mountains
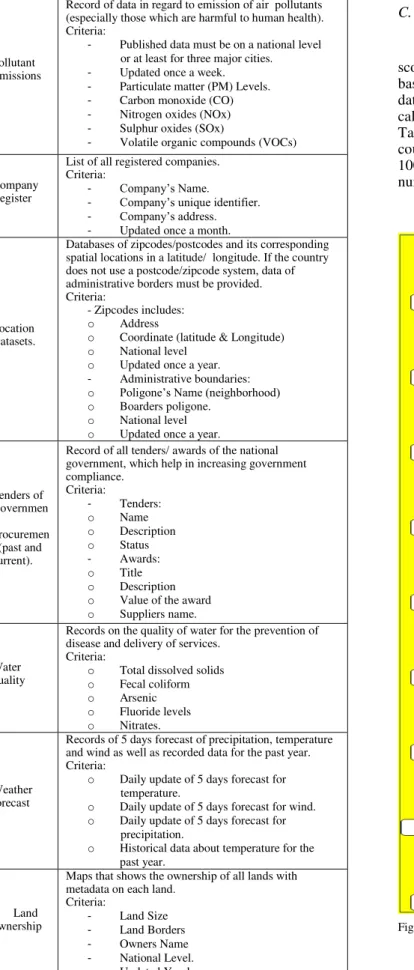
C. Measuring Each Datasets by using Open Data Index Scoring Model
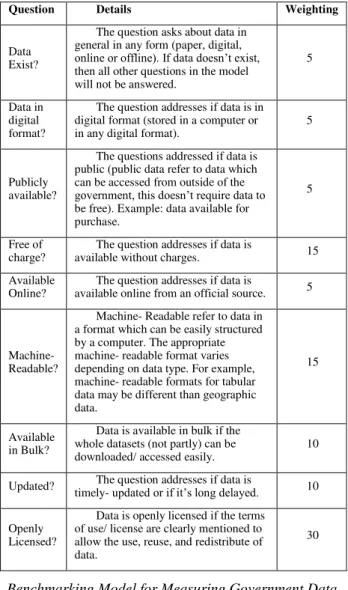
Each dataset is evaluated by using open data index‘s scoring model. The model uses nine questions/indicators based on the open definition to examine the openness of each dataset. After reviewing each dataset, final percentages are calculated by adding the scores of all datasets as shown in Table 3 and divide them by 1300 (a maximum score which a country can get, assuming that all 13th datasets have scored 100). Later, numbers are rounded to the nearest whole number.
(1)
Fig. 1. Flow Chart of the Scoring Model
Fig. 1 and Table 3 describe the models‘ questions and their scoring weights:
Pollutant Emissions
Record of data in regard to emission of air pollutants (especially those which are harmful to human health). Criteria:
- Published data must be on a national level or at least for three major cities.
- Updated once a week.
- Particulate matter (PM) Levels.
- Carbon monoxide (CO)
- Nitrogen oxides (NOx)
- Sulphur oxides (SOx)
- Volatile organic compounds (VOCs) Company
Register
List of all registered companies. Criteria:
- Company‘s Name.
- Company‘s unique identifier. - Company‘s address. - Updated once a month.
Location Datasets.
Databases of zipcodes/postcodes and its corresponding spatial locations in a latitude/ longitude. If the country does not use a postcode/zipcode system, data of administrative borders must be provided. Criteria:
- Zipcodes includes:
o Address
o Coordinate (latitude & Longitude)
o National level
o Updated once a year.
- Administrative boundaries:
o Poligone‘s Name (neighborhood) o Boarders poligone.
o National level
o Updated once a year.
Tenders of Governmen t
Procuremen t (past and current).
Record of all tenders/ awards of the national government, which help in increasing government compliance.
Criteria:
- Tenders:
o Name
o Description
o Status
- Awards:
o Title o Description
o Value of the award
o Suppliers name.
Water quality
Records on the quality of water for the prevention of disease and delivery of services.
Criteria:
o Total dissolved solids
o Fecal coliform
o Arsenic
o Fluoride levels o Nitrates.
Weather forecast
Records of 5 days forecast of precipitation, temperature and wind as well as recorded data for the past year. Criteria:
o Daily update of 5 days forecast for temperature.
o Daily update of 5 days forecast for wind.
o Daily update of 5 days forecast for precipitation.
o Historical data about temperature for the past year.
Land ownership
Maps that shows the ownership of all lands with metadata on each land.
Criteria:
- Land Size
- Land Borders
- Owners Name
- National Level.
Vol. 7, No. 12, 2016
TABLE III. LIST OF THE SELECTED DATASETS FOR EVALUATION Question Details Weighting
Data Exist?
The question asks about data in general in any form (paper, digital,
online or offline). If data doesn‘t exist,
then all other questions in the model will not be answered.
5
Data in digital format?
The question addresses if data is in digital format (stored in a computer or in any digital format).
5
Publicly available?
The questions addressed if data is public (public data refer to data which can be accessed from outside of the
government, this doesn‘t require data to
be free). Example: data available for purchase.
5
Free of charge?
The question addresses if data is
available without charges. 15 Available
Online?
The question addresses if data is
available online from an official source. 5
Machine- Readable?
Machine- Readable refer to data in a format which can be easily structured by a computer. The appropriate machine- readable format varies depending on data type. For example, machine- readable formats for tabular data may be different than geographic data.
15
Available in Bulk?
Data is available in bulk if the whole datasets (not partly) can be downloaded/ accessed easily.
10 Updated? The question addresses if data is
timely- updated or if it‘s long delayed. 10 Openly
Licensed?
Data is openly licensed if the terms of use/ license are clearly mentioned to allow the use, reuse, and redistribute of data.
30
D. Benchmarking Model for Measuring Government Data Openness
Research regarding open government data assessment has led to a benchmark model for measuring government data openness in accordance with well-defined openness principles. The purpose of this section is to suggest and apply an enhanced model for measuring government data openness, which relies on global data index‘ scoring model. The model represents a new tactic to evaluate the openness of government data and is fully described in this section. A debate will also be provided about the reason behind the researcher‘s choice to develop an enhanced data openness assessment model rather than using the existing ones. To proof the model‘s capabilities, the model will be applied to measure the openness level of Saudi Open e-Government Data portal along with other five data portals with comparisons, analysis of results followed by conclusion.
Open government revolved around data openness and citizen engagement. According to [5], the open government is defined as ―transparent, accessible and responsive governance system, where information moves freely both to and from the government, through a multitude of channels‖. It is obligatory
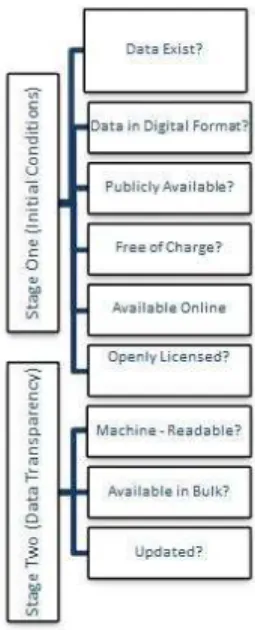
to define the term of Open Government Data as two elements: a) open data are ―data that can be freely used, re-used and distributed by anyone only subject to (at the most) the requirement that users attribute the data and that they make their work available to be shared as well‖: b) Government data is ―any data and information produced or commissioned by government‖. In the era of open government data, citizens become partners and take an active role where information and services are co-producing by both government and citizens. To further foster openness, on January 21, 2009, president Obama issued the Open Government Directive to which government institutions should take actions to implement the three cornerstones of Open Government data principles: Transparency, Participation, and Collaboration. Later, on May 2010, The Digital Agenda for Europe was launched to support the open government approach in fostering citizen participation and engagement. According to the digital agenda, government transformation should be triggered by web 2.0, ubiquitous mobile connectivity and social media to allow mass dissemination of data and promotes the collaboration between government and citizens. In the literature, models that have been developed to measure open government data openness were presented in details along with their perspectives and properties. Although it was concluded that the scoring model as shown in Fig. 3, is the most comprehensive model in term of measuring data openness level, there is still room for improvement. Lee and Kwak [6] argued that existing models are not 100% designed to fulfill the main principles of open government data (participation, collaboration, and transparency), which are empowered by emerging technologies such as social media, and ubiquitous mobile technology. According to Open Government Maturity Model as shown in Fig. 2, there are five levels of maturity in regard to Open Government Data 1. Initial conditions, 2. Data transparency, 3. Open Participation, 4. Open Collaboration, 5. Ubiquitous Engagement. Thus, higher maturity levels suggest increased public engagement and public value.
Fig. 2. Lee & Kwak Five Level of Maturity Model
Stage 1- Initial condition: this stage implies that government agencies are aggregating, gathering and publishing data in one- way communication where citizens can access in a wide range. However, the published data may be difficult to reuse (outdated, duplicated, and inaccurate).
accessible and easily reusable which increases the transparency and public awareness of government work.
Stage 3- Open Participation: the focus at this stage is on the open participation; the government here is open to public knowledge and ideas. Thus, government data are enriched with none- government and informal data such as public‘ feedback, comments, ideas, knowledge and experiences that are collected from expressive social media.
Stage 4- Open Collaboration: this stage implies that government is engaging citizens in complex government tasks and projects by providing relative solutions for increasing citizens‘ value- added products and services.
Stage 5- Ubiquitous Engagement:at this stage, the benefits of open government data are totally realized and a high level of maturity is achieved. Public engagement becomes ubiquitous with mobile Government (M- Government). Furthermore, governments‘ are promoting their data and services via mobile applications where citizens can easily access through their mobile devices.
Fig. 3. Scoring Model and Five Level of Maturity Model
It‘s been evident after reviewing Open Government Maturity Model that Open Government Data has shifted the focus of government from traditional practices into citizens‘ empowerment, information sharing, and collaboration. However, the new principles of government may not be fully attained unless governments‘ progress is being measured accordingly. In specific, governments will not achieve a highest level of Open Government Maturity Model unless they are aware of being measured with relative parameters. For example, every year, governments around the world are waiting impatiently for the results of open data index report to know exactly where they are standing, and what improvements they can make on their government‘s data portal. However, the scoring model used by open data index to measure each government‘s data portal only satisfies the first two stages of Open Government Maturity Model. Thus,
government efforts to enhance their portals will be limited to the model‘s parameters, which only satisfy the first two stages of Open Government Maturity Model (initial conditions and data transparency).
Initial conditions Stage: the first 5 questions of the scoring models only satisfy the first stage of Open Government Maturity Model where Government agencies are aggregating, gathering and publishing data for citizens to access in a one- way communication.
Data Transparency: the last three questions of the scoring models satisfy the second stage of Open Government Maturity Model where governments‘ agencies are focusing on the quality of data (updated, Machine- readable, available in bulk).
E. Proposed Enhanced Model
Since the scoring model only satisfies the first two stages of Open Government Data maturity model, more questions/ indicators must be added to satisfy each stage until reaching an optimal level of maturity (stage 5). To do so, the researcher proposes enhancing the model as shown in Fig. 4 by adding three questions/indicators derived from each unsatisfied stage of Open Government Data.
Vol. 7, No. 12, 2016
1) Do Governments‘ portals use Social Media tools? This question is proposed to satisfy stage Three of Open Government Data Maturity Level (Open Participation) since open participation is mainly concerned about social media.
2) Is API- Enabled in Governments‘ Data? This question is proposed to satisfy stage four of Open Government Data Maturity Level (Open Collaboration) where governments are providing relative solutions for increasing citizens‘ value- added products and services. In specific, an Application Programming Interface (API) increase the effective collaboration between government organizations and citizens by making data more usable which leads to more value- added apps, product, and services ("Apis Should Be The Default For Publishing Open Data - Socrata, Inc.").
Do Governments‘ portals have mobile applications? This question is proposed to satisfy stage five of Open Government Data Maturity Level (Ubiquitous Engagement) since this stage is mainly concerned about citizen accessibility to governments‘ data through mobile applications.
The enhanced/proposed scoring model perceives the openness of governments‘ data portals through the following indicators: Data Exist, Data in Digital Format, Publicly Available, Free of charge, Available Online, Openly Licensed, Machine- Readable, Available in Bulk, Updated, Use Social Media tools, API- Enabled and Have Mobile Applications. These indicators match both open government data principles and Open Government Data Maturity model.
F. Measurement of the Proposed Model’s Indicators
Since a special weight/ score was assigned to each indicator in the original model by open data index to allow measuring the openness of governments‘ data portals. Enhancing the model by adding more indicators demanded the recalculation of each indicator plus assigning a score/weight to each new proposed indicator. The challenge here was to know the main methodology followed by Open Data Index to score each indicator in the original model. Unfortunately, secondary data was not helpful in this regard. To overcome this difficulty, email ‗interview‘ was conducted with high-end team at Global Open Data Index (responsible for methodology and crowdsourcing data).
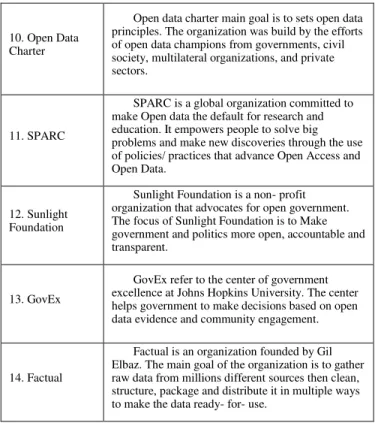
The obtained information from the interview has contributed building a methodology for scoring the new model. To do so, the researcher‘s conducted an online survey to seek the opinions of experts in 14 different open data institutions as shown in Table 4. The institutions were carefully selected because of their value- added projects and research in promoting open data. For this study, the researcher‘s sought to identify at least one open data expert in each institution by examining the institution‘s website looking for contact details. Some institutions were contacted directly to request the email of the relevant person. In the initial contact, the researcher ensured that the interlocutor indeed has a relevant experience/knowledge. Then, a general explanation of the survey‘s purpose was clarified followed by guidance on
how to fill the survey and a corresponding link. A total of 9 experts from 9 institutions responded to the survey (64.28%) from the list as shown in Table 4. The study was carried out by means of a questionnaire and the focus of the study was to get feedback on the proposed model and to assign a weight for each indicator.
TABLE IV. LIST OF SURVEYED INSTITUTIONS Institution Name Brief Description
1. Open Data Institute
Established by Sirs Tim Berners-Lee and Nigel Shadbolt. Open Data Institute is an independent, non-profit organization that nurture, train and collaborate with individuals around the world to promote the innovation through open data.
2. Open Data Working Group
Open Data Working group act as a central point of reference for individuals around the world who are interested in Open Government Data. The organization develop documents, principles and catalogues to make official information open in different countries 3. The Open Data
Foundation
Non- profit organization dedicated to the
development of open-source solutions to promote the use of statistical data in Open Government. The focus of the organization is to improve data and overall quality in support of research and policy making.
4. Open Data Nation
The Open Data Nation host events to spark the engagement and increase the visibility of open data to stakeholders
Such as entrepreneurs, advocates, and investors. In particular, the organization helps stakeholders to make data-driven decisions, and operate more efficiently. 5. Global Open
Data Initiative
The Global Open Data Initiative (GODI) is an enterprise led by civil society organizations for the purpose of sharing principles, resources for governments and societies on how to best employ the opportunities created by opening government data.
6. Open State Foundation
Open State Foundation is an organization based in Amsterdam, which promotes revealing/unlocking open government data and stimulates its re-use.
7. Engage Data
Engage data is a project funded by European Commission Program. The main goal of Engage is to empower the deployment of open governmental data towards citizens. By using Engage platform, researchers/ citizens can submit, search and visualize data from all the countries of the European Union.
8. Open Data Soft
Open Data Soft is an organization based on Paris- France, which provides a platform for easy publishing, reuse and sharing of all types of data. The main goal of the organization is to promote the transformation of data into innovative services and products.
9. Socrata
Socrata is a privately held software company headquartered in Seattle, Washington, D.C. and London.
10. Open Data Charter
Open data charter main goal is to sets open data principles. The organization was build by the efforts of open data champions from governments, civil society, multilateral organizations, and private sectors.
11. SPARC
SPARC is a global organization committed to make Open data the default for research and education. It empowers people to solve big problems and make new discoveries through the use of policies/ practices that advance Open Access and Open Data.
12. Sunlight Foundation
Sunlight Foundation is a non- profit organization that advocates for open government. The focus of Sunlight Foundation is to Make government and politics more open, accountable and transparent.
13. GovEx
GovEx refer to the center of government excellence at Johns Hopkins University. The center helps government to make decisions based on open data evidence and community engagement.
14. Factual
Factual is an organization founded by Gil Elbaz. The main goal of the organization is to gather raw data from millions different sources then clean, structure, package and distribute it in multiple ways to make the data ready- for- use.
As stated above, respondents were asked to score each indicator of the enhanced model based on its priority/importance and relevance in measuring data Openness level with the condition that the sum of all indicators must be one hundred. After calculating the total average of the responses, a weight was assigned to each indicator as shown in Fig. 5. Thus, the enhanced model became ready to be used as a measurement tool.
Fig. 5. Score of each indicator in the Enhanced Model
III. RESULTS
To proof the model‘s capabilities, the model will be applied to measure the openness level of Saudi Open Government Data portal along with other five data portals with comparisons, analyses, and conclusion about the results.
For the results to be comparable, the datasets selected for evaluation for each data portals are the same datasets
selected/evaluated by Open Data Index. The goal here is to compare the results of using the original model versus the enhanced model.
The researcher has performed an evaluation of data openness for the following data portals: Saudi Arabia, Taiwan, United Kingdom, Denmark Colombia, and Finland. The researcher has chosen Saudi Arabia data portal because it‘s the main focus of this research. Further, the other five data portals were chosen because of their top and sequence ranking among others. For example, Taiwan has achieved the highest ranking of data openness (87%) among 122 countries and areas in the 2015 Global Open Data Index followed by United Kingdom (76%), Denmark (70%), Colombia (68%) and Finland (67%). Since the chosen data portals have a sequence ranking, it was interesting to see how applying the enhanced model has affected their ranking.
The UK represents the oldest portals, launched in 2009 respectively11, and the first initiator of ―Open Data‖ movement along with United States. By contrast, Colombia is the youngest, officially published in 2013 [7]. Taiwan and Saudi Arabia in the middle12, having been published in 2011, followed by Denmark and Finland 2012 [8]. It was interested to compare between these portals and see whether their attained maturity and age has any influence on their final score.
For each portal, the evaluation was accomplished by applying the enhanced model on a 13th dataset. The model uses eleventh questions/indicators where each question has a determined score as explained earlier in the previous chapter to examine the openness of each dataset. After reviewing each dataset, final percentages of each data portal are calculated by adding the scores of all datasets and divide them by 1300 (a maximum score which a country can get).
Fig. 6. Data openness percentage for analyzed portal
The Fig. 6 shows the result of applying the enhanced model on each data portals. As illustrated, the highest score was achieved by the UK data portals 69.62%, which indicated 69.62% openness, followed by Taiwan 62.62%, Denmark 61.46%, Finland 60.54%, Colombia 60.23 % and Saudi Arabia 32.23%. A closer look at the results provides insights
11 http://ckan.org/
Vol. 7, No. 12, 2016 about the successful, less successful and areas of improvement
for each analyzed data portal.
Saudi Arabia‘ final score (32.23%) points to the necessity for further improvements. From Saudi Arabia‘s detailed information per datasets Fig. 7, it was found that four out of 13th mandatory datasets are empty. Other datasets are ranging from 8% openness to 75%. Therefore, to improve the final score, Saudi Arabia should focus on launching data to the missing datasets as well as improving the existing ones. As the chart indicates, the overall highest scoring dataset was achieved by location datasets (75%) whereas the worst graded datasets, if the researchers exclude those with a score of zero, were Pollutant Emissions (8%), and Land Ownership (8%). For example, by analyzing in details the results of the highest scoring dataset ―location datasets‖, researchers can conclude that the critical indicators were Data in Bulk, Openly Licensed and open data promoted through social media. Achieving zero in those indicators indicates a complete lack of openly licensed and bulk data as well as a complete absence of this dataset in social media. Consequently, improving those indicators would inevitably lead to an improved overall score for the location dataset in Saudi Open Government Data Portal.
Fig. 7. Saudi Arabia score per dataset
Saudi Open Government data portal has achieved a score of 15% in the 2015 Global Open Data Index. However, when the portal was evaluated by using the enhanced model where three more measurement indicators were added (API enabled, Data promote through social media and Data promoted through mobile applications), a score of 32.23% was obtained. The gap between the results of the two assessments relies on two things.
First, Saudi Arabia has enabled API data and launched mobile applications for two of its datasets (National map, location datasets) as shown in Fig. 8. This has contributed slightly to increase its final score. Moreover, the score was further enhanced after finding that Saudi Arabia is using Social Media platforms (Twitter, Facebook, LinkedIn, YouTube) to promote the open data of five datasets (Procurement tenders, National Statistics, National Map, Election Results, and Weather Forecast).
Fig. 8. Saudi Arabia: enhanced model results versus open data index results
Second, by double- checking the results of Open Data Index 2015 in regard to Saudi Arabia, the researcher has found that three out of six datasets, which were scored mistakenly zero by the organization actually exists. Those datasets are: Location datasets13, election results14 and National Map15. The existence of the three datasets had contributed rapidly to increase Saudi Arabia‘s final score. In this regard, the researcher had contacted Open Data Index to inform them about the existence of the three datasets and the necessity for modifying Saudi Arabia‘s final score. However, since the assigned time for reviewing the results of 2015 had been closed by the organization, Open Data Index replied with a confirmation that the researcher‘s feedback will be considered in 2016 report.
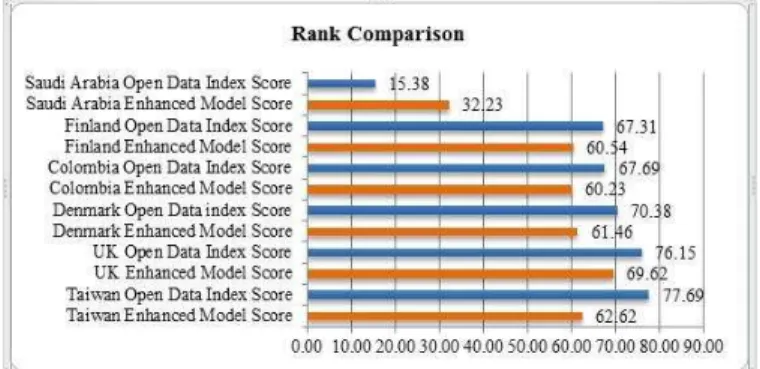
Fig. 9. Comparison of the analyzed data portals among countries by using open data index model versus the enhanced model
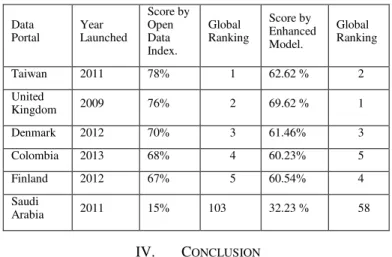
Fig. 9 above provides a comparison of the analyzed data portals among countries by using Open Data Index model versus the enhanced model. It is observed that after applying the enhanced model, the overall score and global ranking of data portals have been changed as shown in Table 5.
After applying the enhanced model, two phenomena were noticed. First, all data portals‘ scores have been decreased respectively except Saudi Arabia for the reasons explained earlier. Second, UK Data Portal has taken Taiwan place by achieving the highest ranking of data openness while Finland
13 https://address.gov.sa/en/default.aspx
has taken Colombia‘s place by achieving a global ranking of number 4. Since the enhanced model uses three additional indicators: API-enabled data, the use of social media and mobile applications in each dataset, The gap between the results of the two assessments rely basically on each data portal‘s efforts in achieving those additional indicators.
TABLE V. OVERALL SCORE AND GLOBAL RANKING OF DATA PORTALS
Data Portal
Year Launched
Score by Open Data Index.
Global Ranking
Score by Enhanced Model.
Global Ranking Taiwan 2011 78% 1 62.62 % 2 United
Kingdom 2009 76% 2 69.62 % 1 Denmark 2012 70% 3 61.46% 3 Colombia 2013 68% 4 60.23% 5 Finland 2012 67% 5 60.54% 4 Saudi
Arabia 2011 15% 103 32.23 % 58
IV. CONCLUSION
Saudi Arabia is making major milestones in implementing Open Government Data in all levels. However, it is important to point out that the nation has long way to go for improvements. From the evidence collected throughout this research, the researcher can conclude:
The lack of introduction of Open Government Data by Saudi Government affected the publics‘ knowledge about the benefits and advantages of utilizing such program. This indicates that the Saudi government is yet to persuade citizens to participate in the initiative.
The fruits of Open Government data are still not harvested in Saudi Arabia where there are no much product/services created by using the data released by the government.
The fact that citizens are using other online programs offered by Saudi e-government mean that citizens have the potential to participate in Open Government Data ―if it‘s marketed right‖.
The score given to Saudi Open Government Data Portal by Global Data Index was not correct. Saudi Arabia has achieved a global ranking score of 103 out of 122 among other countries in term of Open Government Data. By double- checking the results, the
researcher has found that three out of six datasets, which were scored mistakenly zero by the organization actually exists. Those datasets are: Location datasets, National Map and election results.
Obtained result gained from the enhanced model applied in this research, shows that Saudi Arabia‘ final openness score (32.23%) points to the necessity for further improvements. The criteria/ indicators used by the model to evaluate the portal, provides an insight about the areas of improvements and the way it should be done.
Recommendation for future research
Open Government data in Saudi Arabia is a relatively new topic and there are many areas that need to be studied in depth. Although the researcher suggests going beyond the scope of the present research, there are some areas that relate to this research, which are working of future investigation. These include:
Developing strategies to spread the awareness of Open Government Data among citizens in Saudi Arabia.
Automating the model suggested throughout this research by converting it into a web- tool. Automating the assessment of data openness offer a significant advantage as the process can be performed at any time, quickly and without human intervention.
REFERENCES
[1] O. David, ―Benchmarking e-government in the web 2.0 era: what to measure and how,‖ European Journal of e-Practice, pp. 33–43, August 2008.
[2] B. Sanja, V. Natasa, and S. Leonid, ―How open are public government data? an assessment of seven open data portals,‖ Measuring E-Government Efficiency, vol. 5, pp. 25–44, February 2014.
[3] M. Alshehri, and S. Drew, ―Challenges of eGovernment service adoption in Saudi Arabia from e-ready citizen perspective,‖ World Academy of Science, pp. 1053–1059, June 2010.
[4] I. A. Elbadawi, ―The state of open government data in GCC countries,‖ In Proceedings of the 12 th European Conference on e-Government, Barcelona, 2012, pp. 193–200.
[5] B. Ubaldi, ―Open government data: Towards empirical analysis of open government data initiatives,‖ OECD Publishing, France, May 2013. [6] G. Lee, and Y. H. Kwak, ―Open government implementation model: a
stage model for achieving increased public engagement‖, In Proceedings of the 12 th Annual International Digital Government Research Conference: Digital Government Innovation in Challenging Times, Maryland, USA, 12–15 June, 2011, pp. 254–261.
[7] T. Obi, and N. Iwasaki, ―A Decade of World E-Government Rankings,‖ IOS Press, 2015.