Insulin secretion, insulin sensitivity, and
hepatic insulin extraction in first-degree
relatives of type 2 diabetic patients
1Departamento de Clínica Médica, Faculdade de Medicina de Botucatu, and 2Instituto de Biociências, Universidade Estadual Paulista, Botucatu, SP, Brasil 3School of Medicine and Dentistry, University of Rochester, New York, NY, USA
W.P. Pimenta1, M.L. Santos1,
N.S. Cruz1, F.F. Aragon2,
C.R. Padovani2 and
J.E. Gerich3
Abstract
To identify early metabolic abnormalities in type 2 diabetes mellitus, we measured insulin secretion, sensitivity to insulin, and hepatic insulin extraction in 48 healthy normal glucose-tolerant Brazilians, first-degree relatives of type 2 diabetic patients (FH+). Each indi-vidual was matched for sex, age, weight, and body fat distribution with a person without history of type 2 diabetes (FH-). Both groups were submitted to a hyperglycemic clamp procedure (180 mg/dl). Insulin release was evaluated in its two phases. The first was calculated as the sum of plasma insulin at 2.5, 5.0, 7.5, and 10.0 min after the beginning of glucose infusion, and the second as the mean plasma insulin level in the third hour of the clamp procedure. Insulin sensitivity index (ISI) was the mean glucose infusion rate in the third hour of the clamp experiment divided by the mean plasma insulin concentration during the same period of time. Hepatic insulin extraction was determined under fasting conditions and in the third hour of the clamp procedure as the ratio between C-peptide and plasma insulin levels. FH+ indi-viduals did not differ from FH- indiindi-viduals in terms of the following parameters [median (range)]: a) first-phase insulin secretion, 174 (116-221) vs 207 (108-277) µU/ml, b) second-phase insulin secretion,
64 (41-86) vs 53 (37-83) µU/ml, and c) ISI, 14.8 (9.0-20.8) vs 16.8
(9.0-27.0) mg kg-1 min-1/µU ml-1. Hepatic insulin extraction in FH+ subjects was similar to that of FH- ones at basal conditions (median, 0.27 vs 0.27 ng/µU) and during glucose infusion (0.15 vs 0.15 ng/µU).
Normal glucose-tolerant Brazilian FH+ individuals well-matched with FH- ones did not show defects of insulin secretion, insulin sensitivity, or hepatic insulin extraction as tested by hyperglycemic clamp proce-dures.
Correspondence
W.P. Pimenta
Departamento de Clínica Médica Faculdade de Medicina de Botucatu UNESP
Caixa Postal 584 18618-970 Botucatu, SP Brasil
E-mail: [email protected]
Research supported by CNPq (Nos. 400646 and 300464). Publication supported by FAPESP.
Received December 14, 2001 Accepted August 27, 2002
Key words
·Type 2 diabetes ·Insulin secretion ·Insulin sensitivity
Introduction
Type 2 diabetes mellitus is a metabolic syndrome which is relatively common in most countries including Brazil (1,2), and is often the cause of severe micro- and macro-vascular complications (3). Despite decades
which of these abnormalities is the major genetic factor. One approach has been to determine which factor is first detectable in individuals genetically predisposed to de-velop type 2 diabetes. To do this it is neces-sary to study individuals with normal glu-cose tolerance to avoid secondary effects of glucotoxicity on insulin secretion and insu-lin sensitivity (8). However, at this stage, it is not possible to be sure who is a true predia-betic. Moreover, in these studies it is impor-tant to properly match experimental and con-trol groups for acquired variables (e.g., obe-sity, age, physical fitness) which affect ß-cell function and insulin sensitivity (9). Fi-nally, the findings for a specific ethnic group, such as the Pima Indians, the Nauruans, the Mexican- or African-Americans may be not valid for other type 2 diabetic patients.
In a previous study of European normal glucose-tolerant individuals who were first-degree relatives of type 2 diabetic patients and well-matched with the control group with no family history of diabetes we used the hyper- and euglycemic clamp techniques to assess insulin secretion and insulin sensi-tivity (10). We found that individuals with a first-degree relative with type 2 diabetes had impaired insulin secretion and were not in-sulin resistant. These findings were later supported by van Haeften et al. (11) in a similar study, while others observed de-creased insulin sensitivity and apparently normal ß-cell function (12,13). However, in the study by Eriksson et al. (12), the subjects were not well-matched, and some of the participants in the study by Gulli et al. (13) who were Mexican-Americans probably had impaired glucose tolerance. With a less sen-sitive technique, i.e., the acute glucose infu-sion test associated with mathematical mod-els, the results have also been controversial; ß-cell dysfunction (14), decreased insulin sensitivity (15), or no defect (16) has been observed. It should be noted, however, that in the study by Warram et al. (15) probands were markedly obese compared to the
con-trols and none of these studies evaluated the appropriateness of ß-cell function in relation to insulin sensitivity (17). Johnston et al. (18) only observed decreased first-degree insulin release in offspring of type 2 diabetic patients when this variable was adjusted for their degree of insulin sensitivity.
Our aim was to evaluate insulin secretion and insulin sensitivity in Brazilian glucose-tolerant first-degree relatives of type 2 diabetic patients. The Brazilian population is charac-terized by a long history of miscegenation, in variable proportions, of European, Black, and Indian ancestries (19), the latter two having an increased risk to develop type 2 diabetes (20). We used the hyperglycemic clamp tech-nique. Each subject was carefully matched for age, sex, weight, body fat distribution, smoking history, and physical activity.
Subjects and Methods
they underwent the hyperglycemic clamp study as described (10). Briefly, each volun-teer came to the laboratory at 7:00 am after an overnight fast. A cannula was retrogradely inserted into a peripheral hand vein and kept patent by constant saline infusion. The hand was kept warm for blood arterialization. Blood samples were obtained from the hand vein every 15 min for half an hour under basal conditions and during glucose infu-sion, every 2.5 min for the first 10 min, and then every 5.0 min up to 180 min. Another cannula was inserted into an antecubital vein of the opposite arm for glucose infusion. For this infusion, we used a pump (Harvard Ap-paratus Co., Southnatick, MA, USA) begin-ning with the bolus dose (in ml = 2 {[weight (kg) x 1.5 x (180 mg/dl - basal plasma glu-cose (mg/dl))]/103}) which was followed by
a variable velocity of glucose infusion de-pending on the plasma glucose level. This was done to obtain and maintain this level at 180 mg/dl. Glucose was measured in all blood samples; insulin and C-peptide were also measured at the same time as glucose under basal conditions and during the first 20 min, and then every 20 min.
Plasma glucose was determined by the glucose oxidase method (Beckman Instru-ments, Fullerton, CA, USA). Glycosylated hemoglobin (HbA1) was measured by
af-finity chromatography (Isolab, Akron, OH, USA). Plasma insulin and C-peptide were determined using the solid phase and the double antibody radioimmunoassay tech-niques, respectively (Diagnostic Products Co., Los Angeles, CA, USA). Serum choles-terol, its HDL fraction, and triglycerides were measured by standard automated enzymatic techniques (Technicon Instruments Co., Tarrytown, NY, USA).
The phases of insulin secretion were evaluated as follows: the first-phase insulin release was taken to be the sum of plasma insulin concentrations at 2.5, 5.0, 7.5, and 10.0 min of the hyperglycemic clamp experi-ment (10), and the second-phase insulin
re-lease was reported as the average plasma insulin concentration during the last hour of the hyperglycemic clamp, when plasma in-sulin concentrations were expected to pla-teau (10). Insulin sensitivity was assessed as insulin sensitivity index (ISI) and was calcu-lated by dividing the average glucose infu-sion rate (GIR) during the last hour of the clamp, minus the occasional glucose urinary excretion, by the average plasma insulin con-centration during the same interval (10). Under stable conditions of constant hyper-glycemia (third hour of the clamp), the amount of glucose infused (GIR) gives an estimate of the glucose that is metabolized by the tissues since endogenous glucose pro-duction should be suppressed. This value divided by the plasma insulin response (sec-ond-phase insulin secretion) provides an es-timate of tissue sensitivity (ISI) to endog-enously secreted insulin (10) and has been shown to correlate with values for insulin sensitivity obtained in euglycemic/hyperin-sulinemic clamp experiments (10,22).
Hepatic insulin extraction (HIE) under basal conditions was calculated as the ratio between mean basal plasma C-peptide and insulin (three determinations), and during glucose infusion, as the ratio between mean plasma C-peptide and insulin during the third hour of the hyperglycemic clamp experi-ment (23).
Data are reported as either the mean ± SDM or the median and 1st and 3rd quartiles or the percent frequency. The unpaired Stu-dent t-test was used to compare means, the
Mann-Whitney test to compare medians, and the chi-square test to compare frequencies (24). Correlations were performed using lin-ear regression (24). A P value equal to or less than 0.05 was considered to be statistically significant.
Results
Table 1. Both groups were well-matched for sex, age, weight, and body fat distribution. Also they did not differ in terms of ancestry, number of pregnancies, or smoking habit.
In the FH+ group the mother alone was diabetic or other first-degree relatives were also diabetic in 50 and 66% of the cases, respectively, with the mother being the family member most frequently affected (P<0.01). Prior to the clamp, plasma glucose, insu-lin and C-peptide levels, serum lipids, and HIE were comparable in both groups (Table 1). Moreover, both groups showed equal normal glucose tolerance as assessed by HbA1
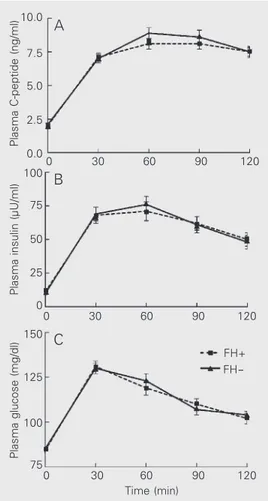
level (Table 1) and by plasma glucose con-centrations after 75-g oral glucose, and pre-sented similar plasma insulin and C-peptide responses during the oral glucose tolerance test (Figure 1). The linear regression coeffi-cients of plasma insulin on plasma glucose with the oral glucose stimulus did not differ between FH+ and FH- individuals (P>0.05). During the hyperglycemic clamp, mean plasma glucose concentrations were 179 ± 2 mg/dl (CV: 2.8 ± 0.9%) and 179 ± 2 mg/dl (CV: 2.7 ± 1.0%) (P>0.05) in the FH+ and FH- groups, respectively (Figure 2). In both groups, a biphasic plasma insulin response was observed (Figure 2). As shown in Table 2, first- and second-phase insulin secretion were comparable in the two groups. The average GIR necessary to maintain plasma glucose levels at 180 mg/dl during the last hour of the hyperglycemic clamp experi-ment was also not different between the two groups (Table 2). Consequently, ISI were similar in FH+ and FH- individuals (Table 2). During the third hour of glucose infusion, HIE showed a similar reduction from its basal value and reached a similar value in both groups (Table 2).
In the two study groups there was a simi-lar and significant inverse relation between ISI and body mass index, first- and second-phase insulin secretion (r = -0.41, -0.42, and -0.59 vs r = -0.47, -0.57, and -0.66, for FH+
and FH- individuals, respectively; P<0.01). Table 1. Clinical characteristics of individuals with (FH+) and without (FH-) a
first-degree relative with type 2 diabetes.
FH+
FH-N (females/males) 56 (46/10) 56 (46/10)
Age (years) 35 (29-40) 34 (30-40)
Ancestry: pure/mixed Caucasian (%) 36.0/64.0 37.5/62.5
Pregnancies 2 (2-3) 3 (2-4)
Smoking (%) 28.6 21.4
BMI (kg/m2) 26.1 ± 3.3 25.7 ± 3.1
Waist-hip ratio 0.81 ± 0.06 0.81 ± 0.06
Fasting plasma glucose (mg/dl) 84 ± 8 85 ± 9
HbA1 (%) 6.10 ± 0.61 5.93 ± 0.87
Fasting plasma insulin (µU/ml) 9 (6-13) 8 (6-12) Fasting plasma C-peptide (ng/ml) 2.1 (1.8-2.6) 2.0 (1.5-2.4)
Cholesterol (mg/dl) 179 ± 36 177 ± 32
HDL cholesterol (mg/dl) 39 ± 9 39 ± 10
Triglycerides (mg/dl) 96 ± 42 94 ± 40
Fasting HIE (ng/µU) 0.269 (0.202-0.346) 0.272 (0.154-0.372)
Data are reported as medians (1st-3rd quartiles) or as means ± SDM. BMI: body mass index; HIE: hepatic insulin extraction. No significant differences were observed be-tween the two groups (Student t-test, Mann-Whitney test or chi-square test).
Plasma C-peptide (ng/ml)
10.0
30
0 60 90 120
30
0 60 90 120
30
0 60 90 120
Time (min) 7.5
5.0
2.5
0.0
Plasma insulin (µU/ml)
100
75
50
25
0
Plasma glucose (mg/dl)
150
125
100
75 A
B
C
FH+ FH
Discussion
A comparative evaluation of ß-cell func-tion, ISI, and HIE was performed between two groups of similar individuals but with (FH+) or without (FH-) first-degree relatives with type 2 diabetes. Both groups showed normal glucose tolerance and were well-matched for the main demographic charac-teristics. Under these conditions, the finding of a defect in any of the three evaluated variables could be considered to be geneti-cally determined.
The fact that the mother was the most frequent relative affected by type 2 diabetes in the FH+ group, although possibly influ-enced by confounding factors and deserving more investigation, agrees with other studies with type 2 diabetic patients (25).
The ß-cell response to the oral glucose challenge of the FH+ group was similar to that of the FH- group. This finding was previously observed by us (10) and by others (12,14,26,27), whereas a decreased (28-30) or increased (13) insulin response to oral glucose has been less frequently reported. These divergent results in relation to ours may be due to the different ethnic groups studied (13) or to a small and specific group of prediabetic individuals that may have included future type 1 diabetic patients (28-30).
Under similar conditions of ß-cell stimu-lation, the two groups were evaluated for insulin release and tissue sensitivity to insu-lin. The first and second phases of insulin secretion and the ISI did not differ between groups. Previous studies using hyperglyce-mic clamps in first-degree relatives of type 2 diabetic patients obtained the following re-sults: unimpaired insulin secretion (12,18),
Plasma glucose (mg/dl)
300
0
-30 30 60 90
200
100
0
120 150 180
Plasma insulin (µU/ml)
100
0
-30 30 60 90
75
50
0
120 150 180
25
Time (min) A
B
FH+
FH
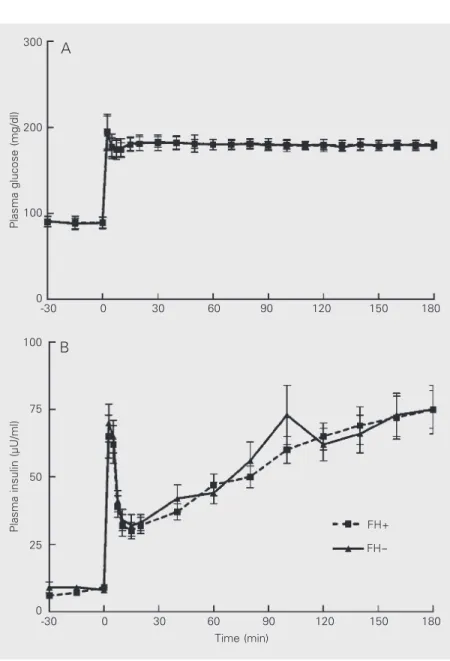
-Figure 2. Plasma glucose (A) and plasma insulin (B) concentrations during hyperglycemic clamp experi-ments. FH+ and FH- indicate individuals with and with-out first-degree relatives with type 2 diabetes, respec-tively. Data are reported as means ± SEM for 48 indi-viduals in each group.
Table 2. Hyperglycemic clamp measurements of insulin secretion, insulin sensitivity, and hepatic insulin extraction of individuals with (FH+) and without (FH-) a first-degree relative with type 2 diabetes.
FH+
FH-First-phase insulin release (µU/ml) 174 (116-221) 207 (108-277) Second-phase insulin release (µU/ml) 64 (41-86) 53 (37-83) GIR (mg kg-1 min-1) 8.70 ± 3.03 8.94 ± 2.75 ISI (mg kg-1 min-1/µU ml-1) 14.8 (9.0-20.8) 16.8 (9.0-27.0) 3rd-hour HIE (ng/µU) 0.151 (0.108-0.215) 0.151 (0.115-0.255)
decreased insulin secretion (10,11) or, in some cases, increased insulin secretion (13). Many studies have evaluated insulin re-lease by an intravenous glucose stimulus in offspring of type 2 diabetic patients who showed normal glucose tolerance. Although most of these studies found lower insulin secretion (14,31,32), many authors did not observe any difference in relation to control individuals (16,33,34), and in some cases in-creased insulin release was reported (15,35).
The reason the results of the present study differ from those of our previous one (10) may be due to the participation of different ethnic groups (36 vs 100% European
ances-try, respectively), since type 2 diabetes in-heritance is heterogenous. On the other hand, increased insulin release as a response to insulin resistance was only observed when the matching for weight was not good (15,35), or when the individuals come from ethnic groups characterized by insulin resistance, such as Mexican-Americans (13) and Afri-can-Americans (35).
Our results may be due to the fact that most first-degree relatives of type 2 diabetics with normal glucose tolerance, even when both parents are diabetic, would not show an insulin release defect, or this defect could not be detectable by the best techniques available, as proposed by Johnston et al. (18). Another reason may be that the distinc-tion between the FH+ and FH- groups based on the presence or absence of type 2 diabetic first-degree relatives may not be sufficient to obtain two groups with a significantly differ-ent concdiffer-entration of diabetes genes, even with a large number of individuals. Also, most of the volunteers of this study were 40 years old or younger and had a body mass index lower than 26.8 kg/m2
(36), thus possi-bly having fewer effects of acquired factors that facilitate the expression of an insulin secretion defect (5).
We should point out that in this study and in previous ones, insulin was measured by radioimmunoassay using antibodies that
sig-nificantly cross-reacted with proinsulin and its intermediates, causing an overestimation of true insulin release. For this reason, we measured plasma C-peptide during the hy-perglycemic clamp procedures, a procedure that permitted us to evaluate the real second-phase insulin release. Both groups showed similar secretion (data not shown). However, the FH+ group may really present decreased first-phase insulin release since this is one of the initial defects of diabetes together with a disproportionate proinsulin release (37).
More definitive results about ß-cell func-tion and insulin sensitivity before the devel-opment of type 2 diabetes were obtained from studies of discordant identical twins. Among these, Vaag et al. (38) performed clamp experiments during the stage of nor-mal glucose tolerance and observed de-creased first-phase insulin secretion with no change in insulin sensitivity. These results partially agree with ours and suggest that we may not have observed a ß-cell secretion defect because we did not have two signifi-cantly different groups with respect to the number of diabetes genes.
The similar insulin release displayed by the FH+ and FH- groups was not due to HIE differences under basal conditions or during glucose infusion. First-degree relatives of type 2 diabetic patients from southern Italy (39) and northern Europe (40) presented hyperinsulinemia due to decreased insulin clearance, a result which is not in agreement with our findings.
first-phase insulin secretion.
Normal glucose-tolerant, white Brazilian first-degree relatives of type 2 diabetic pa-tients did not show defects of ß-cell secre-tory function, ISI, or HIE as tested by hyper-glycemic clamp procedures.
Acknowledgments
We are grateful to Solange S.M. Dantas, João L. Fogueiral, and Mario A. Dallaqua for assistance.
References
1. King H & Zimmet P (1988). Trends in the prevalence and incidence of diabetes: Non-insulin-dependent diabetes mellitus. World Health Statistics Quarterly, 41: 190-196.
2. Malerbi DA, Franco LJ & The Brazilian Cooperative Group on the Study of Diabetes Prevalence (1992). Multicenter study of the preva-lence of diabetes mellitus and impaired glucose tolerance in the urban Brazilian population aged 30-69 years. Diabetes Care, 15: 1509-1516.
3. UK Prospective Diabetes Study (UKPDS) Group (1998). Intensive blood-glucose control with sulphonylureas or insulin compared with conventional treatment and risk of complications in patients with type 2 diabetes (UKPDS 33). Lancet, 352: 837-853.
4. DeFronzo RA, Bonadonna RC & Ferrannini E (1992). Pathogenesis of NIDDM: A balanced overview. Diabetes Care, 15: 318-368. 5. Gerich JE (1998). The genetic basis of type 2 diabetes mellitus:
Impaired insulin secretion versus impaired insulin sensitivity. Endo-crine Reviews, 19: 491-503.
6. Hamman R (1992). Genetic and environmental determinants of noninsulin dependent diabetes mellitus (NIDDM). Diabetes/Metabo-lism Reviews, 8: 287-338.
7. Poulsen P, Kyvik KO, Vaag A & Beck-Nielsen H (1999). Heritability of type II (non-insulin-dependent) diabetes mellitus and abnormal glu-cose tolerance: A population-based twin study. Diabetologia, 42: 139-145.
8. Yki-Järvinen H (1992). Glucose toxicity. Endocrine Reviews, 13: 415-431.
9. Yki-Järvinen H (1995). Role of insulin resistance in the pathogenesis of NIDDM. Diabetologia, 38: 1378-1388.
10. Pimenta W, Korytkowski M, Mitrakou A, Jensen T, Yki-Järvinen H, Evron W, Dailey G & Gerich J (1995). Pancreatic beta-cell dysfunc-tion as the primary genetic lesion in NIDDM. Journal of the Ameri-can Medical Association, 273: 1855-1861.
11. van Haeften T, Dubbeldam S, Zonderland M & Erkelens D (1998). Insulin secretion in normal glucose-tolerant relatives of type 2 dia-betic subjects: assessments using hyperglycemic glucose clamps and oral glucose tolerance tests. Diabetes Care, 21: 278-282. 12. Eriksson J, Franssila-Kallumki A, Ekstrand A, Saloranta C, Widén E,
Schalin C & Groop L (1989). Early metabolic defects in persons at increased risk for non-insulin-dependent diabetes mellitus. New England Journal of Medicine, 321: 337-343.
13. Gulli G, Ferrannini E, Stern M, Haffner S & DeFronzo RA (1992). The metabolic profile of NIDDM is fully established in glucose-tolerant offspring of two Mexican-American NIDDM parents. Diabetes, 41: 1575-1586.
14. Serrano-Rios M, Ramos F, Rodriguez Miñón JL & Vivanco F (1970). Studies in prediabetes: insulin response to oral glucose, intravenous tolbutamide and rapid intravenous glucose infusion in genetic
prediabetics. Diabetologia, 6: 392-398.
15. Warram JH, Martin BC, Krolewski AS, Soeldner JS & Kahn CR (1990). Slow glucose removal rate and hyperinsulinemia precede the development of type II diabetes in the offspring of diabetic parents. Annals of Internal Medicine, 113: 909-915.
16. Byrne MM, Sturis J, Sobel RJ & Polonsky KS (1996). Elevated plasma glucose 2-h postchallenge predicts defects in ß-cell function.
American Journal of Physiology, 270: E572-E579.
17. Kahn SE, Prigeon RL, McCulloh DK, Boyko EJ, Bergman RN, Schwartz MW, Neifing JL, Ward WK, Beard JC, Palmer JP & Porte Jr D (1993). Quantification of the relationship between insulin sensitiv-ity and ß-cell function in human subjects: Evidence for a hyperbolic function. Diabetes, 42: 1663-1672.
18. Johnston C, Ward WK, Beard JC, McKnight B & Porte Jr D (1990). Islet function and insulin sensitivity in the non-diabetic offspring of conjugal type 2 diabetic patients. Diabetic Medicine, 7: 119-125. 19. Smith TL (1967). A composição racial. In: Brasil: Povo e Instituições.
Edições Bloch, Rio de Janeiro, RJ, Brazil.
20. King H, Rewers M & World Health Organization Ad Hoc Diabetes Reporting Group (1993). Global estimates for prevalence of diabetes mellitus and impaired glucose tolerance in adults. Diabetes Care, 16: 157-177.
21. National Diabetes Data Group (1979). Classification and diagnosis of diabetes mellitus and other categories of glucose intolerance. Dia-betes, 28: 1039-1057.
22. Mitrakou A, Vuorinen-Markkola H, Raptis G, Toft I, Mokan M, Strumph P, Pimenta W, Veneman T, Jenssen T, Bolli G, Korytkowski M, Yki Järvinen H & Gerich J (1992). Simultaneous assessment of insulin secretion and insulin sensitivity using a hyperglycemic clamp.
Journal of Clinical Endocrinology and Metabolism, 75: 379-382. 23. Savage PJ, Flock EV, Mako ME, Blix PM, Rubenstein AH & Bennett
PH (1979). C-peptide and insulin secretion in Pima Indians and Caucasians: constant fractional hepatic extraction over a wide range of insulin concentrations and in obesity. Journal of Clinical Endocri-nology and Metabolism, 48: 594-598.
24. Norman GR & Streiner DL (1994). Biostatistics: The Bare Essentials. Mosby-Year, St. Louis, MO, USA.
25. Bjørnholt J, Jervell J, Erikssen G, Thaulow E, Liestøl K & Erikssen J (2000). Type 2 diabetes and maternal family history. Diabetes Care, 23: 1255-1259.
26. Grodsky GM, Karam JH, Pavlatos FCH & Forsham PH (1965). Serum-insulin response to glucose in prediabetic subjects. Lancet, 1: 290-291.
27. Savage PJ, Bennett PH, Gorden P & Miller M (1975). Insulin re-sponses to oral carbohydrate in true prediabetics and matched con-trols. Lancet, 1: 300-302.
hyper-glycemia in prediabetes and diabetes. Diabetes, 16: 560-565. 29. Pyke DA & Taylor KW (1967). Glucose tolerance and serum insulin in
unaffected identical twins of diabetics. British Medical Journal, 4: 21-22.
30. Soeldner JS, Gleason RE, Williams RF, Garcia MJ, Beardwood DM & Marble A (1968). Diminished serum insulin response to glucose in genetic prediabetic males with normal glucose tolerance. Diabetes, 17: 17-26.
31. Simpson RG, Benedetti A, Grodsky GM, Karam JH & Forsham PH (1968). Early phase of insulin release. Diabetes, 17: 684-692. 32. Sönksen PH, Soeldner JS, Gleason RE & Boden G (1973). Abnormal
serum growth hormone responses in genetically potential-diabetic male patients with normal oral glucose tolerance: Evidence for an insulin-like action of growth hormone in vivo. Diabetologia, 9: 426-437.
33. Lowrie EG, Soeldner JS, Hampers CL & Merrill JP (1970). Glucose metabolism and insulin secretion in uremic, prediabetic, and normal subjects. Journal of Laboratory and Clinical Medicine, 76: 603-615. 34. Aronoff SL, Bennett PH, Gorden P, Rushforth N & Miller M (1977).
Unexplained hyperinsulinemia in normal and “prediabetic” Pima Indians compared with normal Caucasians: An example of racial differences in insulin secretion. Diabetes, 26: 827-840.
35. Osei K, Cottrell DA & Orabella MM (1991). Insulin sensitivity, glu-cose effectiveness, and body fat distribution pattern in nondiabetic offspring of patients with NIDDM. Diabetes Care, 14: 890-896. 36. Campbell PJ & Gerich JE (1990). Impact of obesity on insulin action
in volunteers with normal glucose tolerance: Demonstration of a threshold for the adverse effect of obesity. Journal of Clinical Endo-crinology and Metabolism, 70: 1114-1118.
37. Polonsky KS (1995). The ß-cell in diabetes: From molecular genetics to clinical research. Diabetes, 44: 705-717.
38. Vaag A, Henriksen JE, Madsbad S, Holm N & Beck-Nielsen H (1995). Insulin secretion, insulin action, and hepatic glucose production in identical twins discordant for non-insulin-dependent diabetes melli-tus. Journal of Clinical Investigation, 95: 690-698.
39. Cozzolino D, Sessa G, Salvatore T, Sasso FC, Giugliano D & Torella R (1995). Hyperinsulinemia in offspring of non-insulin-dependent dia-betes mellitus patients: The role played by abnormal clearance of insulin. Metabolism, 44: 1278-1282.