CLIMATE CHANGES AND TECHNOLOGICAL ADVANCES:
IMPACTS ON SUGARCANE PRODUCTIVITY IN TROPICAL
SOUTHERN BRAZIL
Júlia Ribeiro Ferreira Gouvêa1; Paulo Cesar Sentelhas2*; Samuel Thomazella Gazzola3; Marcelo Cabral Santos2
1
USP/ESALQ - Programa de Pós-Graduação em Física do Ambiente Agrícola
2
USP/ESALQ - Depto. de Engenharia Rural, Av. Pádua Dias, 11 - 13418-900 - Piracicaba, SP - Brasil.
3
COSAN - Usina Costa Pinto, Bairro Costa Pinto, 13418-000 - Piracicaba, SP - Brasil. *Corresponding author <pcsentel@esalq.usp.br>
ABSTRACT: The climatic projections for this century indicate the possibility of severe consequences for human beings, especially for agriculture where adverse effects to productivity of crops and to agribusiness as a whole may occur. An agrometeorological model was used to estimate sugarcane yield in tropical southern Brazil, based on future A1B climatic scenarios presented in the fourth Intergovernmental Panel on Climate Change report, in 2007. Sugarcane yield was evaluated for 2020, 2050, and 2080 considering the possible impacts caused by changes in temperature, precipitation, sunshine hours and CO2 concentration in the atmosphere, as well as technological advances. Increasingly higher temperatures will cause an increase of the potential productivity (PP), since this variable positively affects the efficiency of the photosynthetic processes of C4 plants. Changes in solar radiation and rainfall, however, will have less impact. PP will increase by 15% in relation to the present condition in 2020, by 33% in 2050 and by 47% in 2080. Regarding the actual productivities (AP), the increase observed in PP will compensate for the negative effect of the projected increase in water deficit. AP will increase by 12% in relation to the present condition in 2020, by 32% in 2050 and by 47% in 2080. The increase in sugarcane productivity resulting from the projected scenarios will have important impacts on the sugarcane sector.
Key words: global warming, water balance, agrometeorological model, sugarcane yield
MUDANÇAS CLIMÁTICAS E AVANÇO TECNOLÓGICO: IMPACTOS
NA PRODUTIVIDADE DA CANA-DE-AÇÚCAR NA REGIÃO
CENTRO-SUL DO BRASIL
RESUMO: As projeções climáticas para este século indicam a possibilidade de graves conseqüências para a humanidade, especialmente para a agricultura, com efeitos adversos nas produtividades das culturas e no agronegócio como um todo. Neste estudo, foi utilizado um modelo agrometeorológico para estimar a produtividade da cana-de-açúcar na região de Piracicaba, SP, Brasil, baseado nos cenários futuros do clima A1B, apresentados no quarto relatório do Painel Intergovernamental sobre Mudanças Climáticas, de 2007. A produtividade da cana-de-açúcar foi avaliada nos anos de 2020, 2050 e 2080, levando-se em consideração as possíveis alterações de temperatura, precipitação, insolação e concentração de CO2 na atmosfera, assim como os avanços tecnológicos. O aumento da temperatura acarretará no aumento da produtividade potencial (PP), já que essa variável afeta positivamente a eficiência do processo fotossintético das plantas C4; entretanto, as alterações na radiação solar e na chuva terão menores impactos na produtividade. A PP aumentará cerca de 15% em relação à condição atual em 2020, de 33% em 2050 e de 47% em 2080. Com relação à produtividade real (AP), o aumento da PP compensará o efeito negativo causado pelo aumento projetado para o déficit hídrico. A AP aumentará cerca de 12% em relação à condição atual em 2020, de 32% em 2050 e de 47% em 2080. O aumento da produtividade da cana-de-açúcar observado na ocorrência dos cenários futuros avaliados terá impactos importantes no setor canavieiro.
INTRODUCTION
Global warming refers to an increase in global tem-peratures. Natural events and human activities are con-tributing to an increase in average global temperatures. This is caused mainly by increases in the concentra-tion of “greenhouse” gases such as carbon dioxide, methane and nitrous oxide. The global increases in car-bon dioxide concentration are due primarily to fossil fuel combustion and land-use change, while those of methane and nitrous oxide are primarily due to agri-culture (Simon & DeFries, 1992; Marengo, 2006; Cerri et al., 2007). Global warming is projected to have sig-nificant impacts on conditions affecting agriculture, including changes in temperature, rainfall and solar ra-diation patterns. These conditions determine the pro-duction capacity of the land. Rising carbon dioxide lev-els would also have effects, both detrimental and ben-eficial, on crop yields. The overall effect of climate change on agriculture will depend on the balance of these effects (Fischer et al., 2002).
Agriculture is the economic activity that most de-pends upon the weather and climate conditions (Assad et al., 2004). The climate affects the growth and de-velopment of plants, as well as the pests that may harm the crops. Any change in the climate will have impact on crop growth and development, as well as the rela-tionship of the plants with microorganisms. One of the best ways to study the impact of climate change on agriculture, more specifically on crop yield, is by ap-plying crop simulation models (Challinor et al, 2005). These models are tools that simulate the influence of climatic conditions on the growth, development and productivity of crops. Their output enables environ-mental risks and production costs to be minimized, which may be an important aid to the development of public policies for decision taking (Pereira et al., 2002). Among the available crop simulation models, the Agro-Ecological Zones model, based on the DeWit method-ology and presented by Doorenbos & Kassam (1994), has proved to be a very useful and accurate way to estimated potential productivity (Fischer et al., 2002). Also, when potential productivity is penalized by wa-ter deficits, during some or all crop development phases, this model is able to estimate actual produc-tivity with high accuracy (Rolim et al., 1998; Marin et al., 2008).
Nowadays, concerns about environmental matters, fuel reserves and expected future increases in the price of fossil fuels are causing several changes in the Bra-zilian energy sector. The search for renewable and less polluting energy sources benefits sugarcane produc-tion, since alcohol is an alternative that may substitute fossil fuels (Goldemberg & Lucon, 2007).
This work used a crop simulation model to deter-mine the potential productivity changes and climatic risks associated with sugarcane production under sce-narios of expected climate change and technological advances. The climatic data from an eighty-year pe-riod for the Piracicaba region, State of São Paulo, Bra-zil, were modified according to the prognoses for the fourth IPCC report and used to quantify the possible impacts of climate change on sugarcane crop produc-tivity. Historical sugarcane yield data for the state of São Paulo was also evaluated to quantify the effect of technological advances in the future scenarios.
MATERIAL AND METHODS
Location and weather data
This study was carried out for the Piracicaba re-gion, State of São Paulo, Brazil, which is one of the main sugarcane production regions of the state. The climate of the area is tropical (wet summer and dry winter). Weather data were taken from the database of a conventional agrometeorological station located at the following coordinates: 22°42’ S; 47°38’ W; and 546 m asl, in Piracicaba, for the period 1927 to 2006. Data were considered in 10-day time intervals, and the vari-ables included in this study were: air temperature (maximum, minimum and mean), sunshine hours, and rainfall, which were used to estimate potential evapo-transpiration, climatological water balance, crop wa-ter balance and sugarcane potential and actual productivities.
Sugarcane potential productivity model
The crop potential productivity (PP) was estimated by the Agro-Ecological Zones model (AZM) (Doorenbos & Kassam, 1994). This model estimates the maximum yield of a crop which would be obtained with a highly productive variety, very well adapted to the respective growth environment; with water, nutritional and phytosanitary requirements supplied, and with the pro-ductivity conditioned only by the genetic characteris-tics of the crop and the environmental conditions (so-lar radiation, photoperiod and air temperature).
The potential productivity of the crop is given by the gross productivity of the dry matter in a standard crop, taking into consideration some coefficients re-lated to the characteristics of the crop. The crop pro-duction varies according to the species, type of car-bon fixation metabolism and temperature, due to cli-matic adaptations.
The following equations describe the procedures for estimating PP, using the AZM (Barbieri & Tuon, 1992):
where: PPG is the gross potential productivity, in dry mass (kg DM ha–1) of a standard crop; C
LAI is the cor-rection for the leaf area index of the specific crop; CR is the respiration coefficient, to account for losses by the respiration process; CH is the harvest index for the specific crop; CW is the correction coefficient to con-sider the weight of the water content in the harvested product; and CD is the duration of the crop cycle (day).
The gross potential productivity is given by:
PPG = PPGo + PPGc [kg DM ha–1 d–1] (2)
where: PPGo and PPGc are respectively the gross po-tential productivity obtained during overcast and clear sky conditions. These variables are given by the fol-lowing expressions:
PPGo = (31.7 + 5.234 Ra) cTo (1 - n/N) [kg DM ha–1 d–1] (3)
PPGc = (107.2 + 8.604 Ra) cTc n/N [kg DM ha–1 d–1] (4)
where: Ra is the extraterrestrial solar radiation [MJ m-2 d–1]; n is the effective number of sunshine hours; N is the maximum number of sunshine hours; and cTo and cTc are the photosynthesis efficiencies during overcast and clear sky conditions, respectively. Both cTo and cTc are function of air temperature, and are given by the equations adjusted for sugarcane by Barbieri & Tuon (1992):
a) For T ≥ 16.5°C
cTo = – 1.064 + 0.173 T – 0.0029 T2 (5)
cTc = – 4.16 + 0.4325 T – 0.00725 T2 (6)
b) For T < 16.5°C
cTo = – 4.16 + 0.4325 T – 0.00725 T2 (7)
cTc = – 9.32 + 0.865 T – 0.0145 T2 (8)
where T is the average air temperature during the 10-day period.
The CLAI for each 10-day period was calculated as a function of the leaf area index (LAI), which was de-termined for sugarcane by power-exponential functions that have accumulated degree-days (DD) as dependent variable, using a base temperature of 18oC (Teruel et al., 1997):
LAI = e–13.52 (Σ DD)2.788 e-0.004023 Σ DD for plant crop (9)
LAI = e-20.21 (Σ DD)3.832 e-0.004936 Σ DD for ratoon crops (10)
where DD was calculated as the difference between average temperature and base temperature.
The LAI values for each period (i) were then used to determine CLAI by the following polynomial equa-tion (Barbieri & Tuon, 1992):
CLAI(i) = 0.0093 + 0.185 LAI(i) – 0.0175 LAI(i)2
(for LAI ≥ 5, CLAI = 0.5) (11)
The respiration coefficient (CR) of the model was computed as a function of the average temperature (T) in the period, being CR = 0.6 for T < 20°C, and CR = 0.5 for T ≥ 20°C. The adopted harvest index (CH) for the sugarcane crop was 0.8 (Doorenbos & Kassam, 1994). The water content correction (CW) was calcu-lated by the following expression (Pereira et al., 2002):
CW = (1 – 0.01 U%)–1 (12)
where U% is the percentage of water in the canes, taken as 80% (Doorenbos & Kassam, 1994).
Finally, the duration of the sugarcane crop cycle (CD) was taken as 16 months or 485 days for a plant crop and 12 months or 365 days for ratoon crops, as normally observed in the Piracicaba region. The plant crop was established in March of each year and har-vested in June of the next year. The ratoon crops were divided into three different cycles of maturation: early ratoon, from April to March; mid ratoon, from August to July; and late ratoon, from October to September.
Estimating actual productivity as a function of wa-ter deficit
The actual productivity (AP) for sugarcane in the context of this study refers only to water-limited yield, and does not account for fertilization levels and pest damage. The AP for sugarcane was calculated by a model that estimates the yield rate due to the potential productivity (PP) and relative water deficit, which oc-curs in each phase of development, according to the water deficit sensitivity index (Ky). Thus, by know-ing the relation between actual and crop evapotrans-piration (ETa/ETc), PPand Ky, it is possible to deter-mine (AP) of a crop by the following equation (Barbieri & Tuon, 1992; Doorenbos & Kassam, 1994; Pereira et al., 2002; Marin et al., 2008):
AP =
∏
=
n
i1 {PPi [1 - Kyi (1 - ETai/ETci)]} (13)
Potential (ETP) and crop (ETc) evapotranspiration
Camargo et al. (1999) to be employed in any climatic condition. To this end, an effective temperature (Tef) is used, which considers the local thermal amplitude:
Tef = 0.36 (3 * Tmax – Tmin) (14)
where: Tmax is the maximum temperature and Tmin the minimum temperature, both in oC. Consequently, the potential evapotranspiration is no longer underes-timated in dry climate conditions or overesunderes-timated in humid environments (Camargo et al., 1999).
Crop evapotranspiration was determined by the product between ETP and crop coefficients (Kc) for each phase of the sugarcane crop, as recommended by FAO (Table 1).
Determination of the crop water balance
The method of Thornthwaite & Mather (1955) was used to process the sequential crop water balance in ten-day time steps, using the “BHcult” program made by Rolim et al. (1998) in an electronic worksheet, with the adaptations proposed by Barbieri et al. (1997). This method proposes that the variation of water storage in the soil follows an exponential function during the drying process. It considers the effective deepness of the roots, the physical characteristics of the soil, and the change in water content as a function of the bal-ance between rainfall (P) and crop evapotranspiration (ETc). As a result, the water balance provides estimates for the actual crop evapotranspiration (ETa), water deficit (WD), and water surplus (WS) for each pe-riod (Pereira et al., 2002). This method was adopted because it is simple and accurate enough for the
pur-poses of this study, as proved by Rolim et al. (2001) and Marin et al. (2008).
Calibration of the models used to estimate poten-tial and actual productivity
The models used for estimating potential and ac-tual productivity in this study were previously cali-brated for the sugarcane crop by different authors. In this work, calibrated values of Ky were obtained from Santos et al. (2006) and Gazzola (2007), who used identical parameterizations for the AZM. The Ky val-ues resulting from the calibration process are presented in Table 2.
Figure 1 presents the result of the calibration pro-cess obtained with data from Santos et al. (2006) and Gazzola (2007), for the Piracicaba region. A high agreement between estimated and observed actual pro-ductivity data was observed, with a slope of 1.02, and R2 of 0.83 (
p < 0.01). This calibration process was
made with data from a wide range of water deficit con-ditions, during four consecutive years with harvests from April to November of each year. The results show that the model can explain 83% of yield variation, be-tween 60 and 130 t ha–1, which is a good performance for the purposes of this study.
Analysis of the sugarcane productivity for the cur-rent climatic conditions
The potential and actual sugarcane productivity data, obtained by the calibrated Agro-Ecological Zones and water deficit penalization methods, were deter-mined for an eighty-year historic series, considering
Table 1 - Crop coefficients (Kc) for sugarcane plant and ratoon crops for different development phases. Adapted from Doorenbos & Kassam (1994).
p o r C t n a l
P RatoonCrop
e l c y c e h t f o s y a
D Kc Days ofthecycle Kc
1 6
-1 0.40 1-61 0.40
3 5 1 -2
6 0.75 62-153 0.75
4 4 2 -4 5
1 1.10 154-244 1.10
4 3 3 -5 4
2 1.25 245-334 1.25
5 8 4 -5 3
3 0.70 335-365 0.70
e s a h p l a c i g o l o n e h P y K y l r a e d n a t n a l p e n a c r a g u S n o o t a r e n a c r a g u
s Mediumsugarcaneratoon
e n a c r a g u s e t a L n o o t a r t n e m h s i l b a t s e d n a g n i t u o r p
S 0.75 0.80 0.70
h t w o r g e v i t a t e g e v h g i h f o d o i r e
P 0.75 0.80 0.70
n o i t a m r o f t s e v r a
H 0.50 0.70 0.50
n o i t a r u t a
M 0.10 0.30 0.10
the observed conditions of temperature, precipitation, sunshine hours and the current CO2 concentration in the atmosphere. This analysis was taken to be the cur-rent scenario (C0).
Future climate projections for the Piracicaba region
The climatic conditions of the scenario A1B (IPCC, 2007) were then used in the simulations. This scenario was adopted because it presents the most rational use of energy sources, combining fossil and non-fossil fu-els. Changes of temperature for A1B scenario range from 1.7 to 4.4°C for 2100. It also indicates that there may be -5 to +5% variations in rainfall during sum-mertime, and -5 to -10% variations during wintertime for the Piracicaba region (IPCC, 2007).
y = 1.02x R2= 0.83*
20 40 60 80 100 120 140
20 40 60 80 100 120 140
E
s
tim
a
te
d
P
ro
d
tu
c
tiv
ity
(t
h
a
-1)
Observed Productivity (t ha-1)
Figure 1 - Relationship between actual productivity, estimated by the AZM model, and observed under field conditions in the Piracicaba region. Adapted from Santos et al. (2006) and Gazzola (2007). *Significant at 1%.
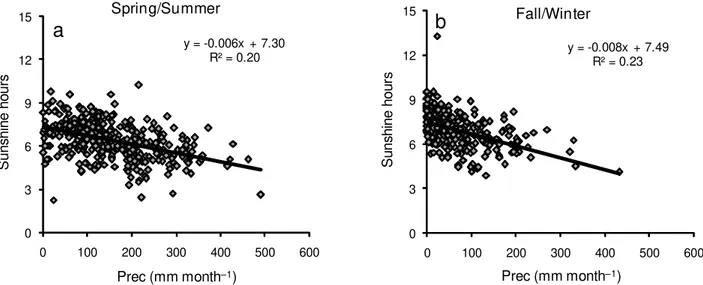
Figure 2 - Relationship between monthly rainfall (Prec) and average daily sunshine hours, during Spring/Summer (a) and Winter/Fall (b) seasons in Piracicaba, SP, Brazil.
y = -0.006x + 7.30 R² = 0.20
0 3 6 9 12 15
0 100 200 300 400 500 600
S
u
ns
h
ine hou
rs
Prec (mm month–1)
Spring/Summer
a
y = -0.008x + 7.49 R² = 0.23
0 3 6 9 12 15
0 100 200 300 400 500 600
S
un
shi
ne
ho
ur
s
Prec (mm month–1)
Fall/Winter
b
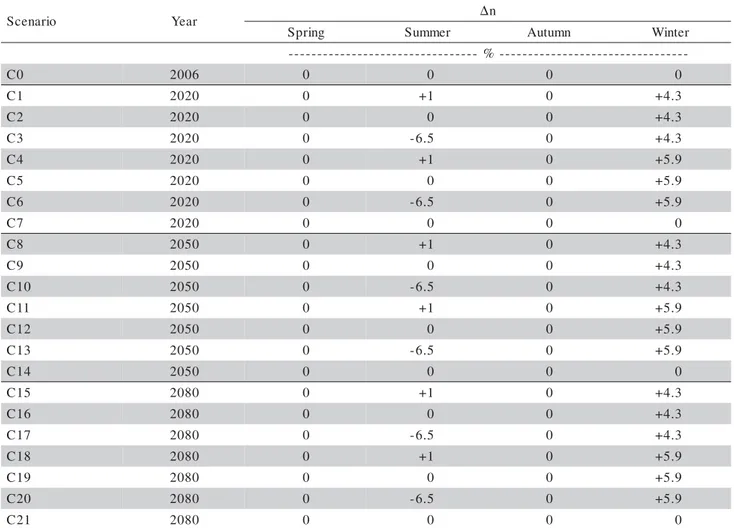
Regarding the influence of cloudy conditions on solar radiation, the relationship between monthly rain-fall and sunshine hours for Piracicaba was established to determine the effect of changing rainfall on the availability of solar energy for the sugarcane crop in the future scenarios (Figure 2). Even considering the weak relationships between rain and sunshine hours (R2 = 0.20 for Spring/Summer and R2 = 0.23 for Fall/ Winter) and the high related uncertainty, these relation-ships were used in the future scenarios to describe the tendency of less/more sunshine hours during the sum-mertime and more sunshine hours during the winter-time, as implied by the possible A1B rainfall estimates (Tables 3 and 4).
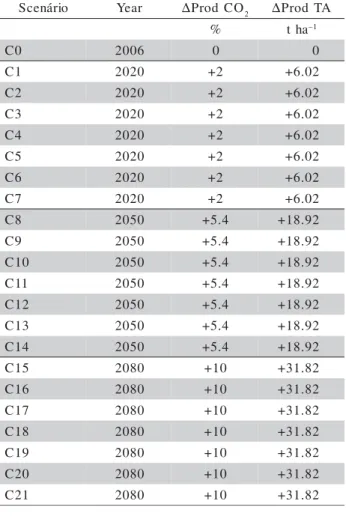
A linear increase from 370 ppm (current concen-tration) to 721 ppm by 2080 was used to evaluate the effect of the increasing CO2 concentration in the at-mosphere. The increment in sugarcane productivity caused by that increase was considered to be 0.029% ppm–1, according to Tubiello et al. (2000).
Scenarios with combinations of increases in tem-perature (1, 2 and 3oC), variations in precipitation and sunshine hours, and increases in CO2 concentration in the atmosphere (440, 559, and 721 ppm) were used to analyze the sugarcane productivity changes, caused by climate forecasts for the Piracicaba region (Tables 3, 4 and 5), for the years 2020, 2050 and 2080.
Statistics (IBGE, 2007), using the census for 1980 and 1985, and the data from the Municipal Agricultural Pro-duction (PAM) database for the period between 1990 and 2006, for the State of São Paulo, Brazil. Based on
o i r a n e c
S Year ∆T ∆P
g n i r p
S Summer Autumn Winter
C
° --- %---
-0
C 2006 0 0 0 0 0
1
C 2020 1 0 -5 0 -5
2
C 2020 1 0 0 0 -5
3
C 2020 1 0 +5 0 -5
4
C 2020 1 0 -5 0 -10
5
C 2020 1 0 0 0 -10
6
C 2020 1 0 +5 0 -10
7
C 2020 1 0 0 0 0
8
C 2050 2 0 -5 0 -5
9
C 2050 2 0 0 0 -5
0 1
C 2050 2 0 +5 0 -5
1 1
C 2050 2 0 -5 0 -10
2 1
C 2050 2 0 0 0 -10
3 1
C 2050 2 0 +5 0 -10
4 1
C 2050 2 0 0 0 0
5 1
C 2080 3 0 -5 0 -5
6 1
C 2080 3 0 0 0 -5
7 1
C 2080 3 0 +5 0 -5
8 1
C 2080 3 0 -5 0 -10
9 1
C 2080 3 0 0 0 -10
0 2
C 2080 3 0 +5 0 -10
1 2
C 2080 3 0 0 0 0
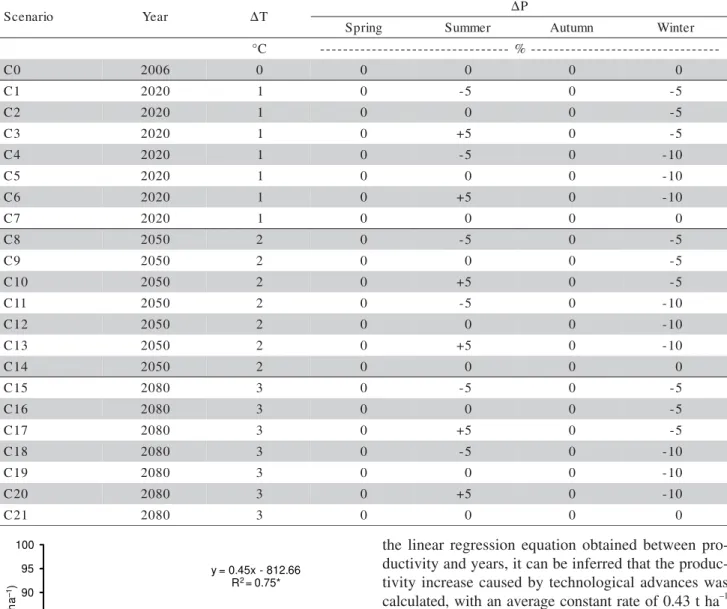
Table 3 - Future climate scenarios with combinations of changes in temperature (ΔT) and rainfall (ΔP), according to the prognosis of the IPCC’s A1B model.
y = 0.45x - 812.66 R2 = 0.75*
50 55 60 65 70 75 80 85 90 95 100
1975 1980 1985 1990 1995 2000 2005 2010
Su
g
a
rc
a
n
e
Pr
od
u
c
ti
v
it
y
(
t
h
a
–1)
Year
Figure 3 - Technological trend of sugarcane productivity in the State of São Paulo, Brazil, from 1980 to 2006. *Significant at 1%.
the linear regression equation obtained between pro-ductivity and years, it can be inferred that the produc-tivity increase caused by technological advances was calculated, with an average constant rate of 0.43 t ha–1 per year.
The yield increment caused by technological ad-vances was adopted as constant throughout the ana-lyzed period, considering that new varieties produced by genetic engineering and best management practices developed within the next 70 years will allow the sug-arcane crop to have an increasingly better yield effi-ciency. Under this assumption a yield plateau hypoth-esis was not adopted for the study period.
Data analysis
80 times, one time for each year of the 80-year pe-riod to incorporate the climate variability. The productivities were analyzed in two ways: individually, for each type of sugarcane crop (plant crop and ra-toon crops); and considering the general productivity, calculated as a function of the usual percentage of each type of sugarcane in the field in a commercial crop (15% of the area with plant crop, 25% with early ra-toon crop, 39% with mid rara-toon crop, and 21% with late ratoon crop).
RESULTS AND DISCUSSION
Impact of future scenarios on potential and actual sugarcane productivity
The potential productivity for each type of matu-rity cycle of the sugarcane crop in the future scenarios is forecast to increase when compared to the current scenario (Figure 4). For C0, the potential productivity of the sugarcane plant crop reaches 148 t ha–1, whereas for the sugarcane ratoon crop the potential is 112 t ha–1 for the early cycle, 97 t ha–1 for the me-dium cycle and 116 t ha–1 for the late cycle. The
gen-eral average potential productivity for sugarcane in the Piracicaba region is 112.5 t ha–1.
Considering the future scenarios, the potential pro-ductivity of the sugarcane plant crop may range from 168.5 to 170.4 t ha–1 in 2020 (C1 to C7), from 191 to 193 t ha–1 in 2050 (C8 to C14) and from 209.6 to 212.1 t ha–1 in 2080 (C15 to C21). For sugarcane ratoon crops, the potential productivity for scenarios C1 to C7 (2020) may range from 127.6 to 129.4 t ha–1 for the early cycle, from 111.5 to 113.1 t ha–1 for the mid cycle, and from 131.9 to 133.8 t ha–1 for the late cycle. For 2050, corresponding to scenarios C8 to C14, the potential productivity may increase further, ranging from 147.5 to 149.5 t ha–1 for the early cycle, from 130.3 to 132.1 t ha–1 for the mid cycle, and from 152.1 to 154.2 t ha–1 for the late cycle. Finally, in 2080, sce-narios C15 to C21, the ratoon crop potential produc-tivity may reach the following ranges: from 162 to 164 t ha–1 for the early cycle; from 145 to 146.7 t ha–1 for the mid cycle; and from 167.1 to 169.2 t ha–1 for the late cycle (Figure 4).
Considering the proportion of the areas of each type of sugarcane maturity cycle in the field, the
gen-o i r a n e c
S Year ∆n
g n i r p
S Summer Autumn Winter
-%
-0
C 2006 0 0 0 0
1
C 2020 0 +1 0 +4.3
2
C 2020 0 0 0 +4.3
3
C 2020 0 -6.5 0 +4.3
4
C 2020 0 +1 0 +5.9
5
C 2020 0 0 0 +5.9
6
C 2020 0 -6.5 0 +5.9
7
C 2020 0 0 0 0
8
C 2050 0 +1 0 +4.3
9
C 2050 0 0 0 +4.3
0 1
C 2050 0 -6.5 0 +4.3
1 1
C 2050 0 +1 0 +5.9
2 1
C 2050 0 0 0 +5.9
3 1
C 2050 0 -6.5 0 +5.9
4 1
C 2050 0 0 0 0
5 1
C 2080 0 +1 0 +4.3
6 1
C 2080 0 0 0 +4.3
7 1
C 2080 0 -6.5 0 +4.3
8 1
C 2080 0 +1 0 +5.9
9 1
C 2080 0 0 0 +5.9
0 2
C 2080 0 -6.5 0 +5.9
1 2
C 2080 0 0 0 0
eral potential productivity will change from 112.5 t ha–1 (C0) to the following ranges: from 128.4 to 130.2 t ha–1 in 2020, from 148.3 to 150.1 t ha–1 in 2050, and from 163.6 to 165.6 t ha–1 in 2080 (Table 6), which correspond to increases of approximately 15%, 33%, and 47%, respectively.
The potential productivity is determined by solar radiation, temperature, photoperiod and genetic char-acteristics of the crop. As a result, increasingly higher temperatures will cause an increase of the potential productivity, since that variable affects the efficiency of the photosynthetic process. For our study, without considering the other effects, an increase in tempera-ture of 1, 2 and 3oC resulted respectively in 6.4, 12.1 and 17.0% yield increments in relation to the present conditions. This can be confirmed by the analysis made by Melo et al. (2007), who stated that the production of dry matter by sugarcane increases with higher tem-peratures.
An increase in temperature caused by higher CO2 concentration in the atmosphere tends to shorten the growth and development cycles of some C4 species, which may cancel the advantages of the CO2 fertiliza-tion (Streck, 2005). This is likely to occur with an-nual crops, which have their development cycles mainly controlled by air temperature. In the case of a sugarcane crop, this is not a fact since this crop is semi-perennial and its cycle is controlled by farmers who allow the plants to remain in the field for a growth period which ranges from 10 to 24 months (Alfonsi et al., 1987).
The results of potential productivity within each considered time period are very similar (Figure 4),
o i r á n e c
S Year ∆Prod CO2 ∆ProdTA
% tha–1
0
C 2006 0 0
1
C 2020 +2 +6.02
2
C 2020 +2 +6.02
3
C 2020 +2 +6.02
4
C 2020 +2 +6.02
5
C 2020 +2 +6.02
6
C 2020 +2 +6.02
7
C 2020 +2 +6.02
8
C 2050 +5.4 +18.92
9
C 2050 +5.4 +18.92
0 1
C 2050 +5.4 +18.92
1 1
C 2050 +5.4 +18.92
2 1
C 2050 +5.4 +18.92
3 1
C 2050 +5.4 +18.92
4 1
C 2050 +5.4 +18.92
5 1
C 2080 +10 +31.82
6 1
C 2080 +10 +31.82
7 1
C 2080 +10 +31.82
8 1
C 2080 +10 +31.82
9 1
C 2080 +10 +31.82
0 2
C 2080 +10 +31.82
1 2
C 2080 +10 +31.82
Table 5 - Future climate scenarios based on combinations of productivity changes caused by CO2 increases (ΔProd CO2), according to the prognosis of the IPCC’s A1B model (IPCC, 2007) and technological advances (ΔProd TA).
Figure 4 - Potential productivity for sugarcane plant and ratoon (early, mid and late) crops under current conditions (C0) and for different future scenarios (from C1 to C21) in Piracicaba, SP, Brazil. The bars represent the standard deviations for an 80-year period. 50 75 100 125 150 175 200 225 250
C0 C1 C2 C3 C4 C5 C6 C7 C8 C9
C1 0 C1 1 C1 2 C1 3 C1 4 C1 5 C1 6 C1 7 C1 8 C1 9 C2 0 C2 1 PP ( t h a –1)
Potencial Productivity - Plant Crop
a Scenarios 50 75 100 125 150 175 200 225 250
C0 C1 C2 C3 C4 C5 C6 C7 C8 C9
C1 0 C1 1 C1 2 C1 3 C1 4 C1 5 C1 6 C1 7 C1 8 C1 9 C2 0 C2 1 PP ( t h a –1 )
Potencial Productivity - Early Ratoon Crop
b Scenarios 50 75 100 125 150 175 200 225 250
C0 C1 C2 C3 C4 C5 C6 C7 C8 C9
C1 0 C1 1 C1 2 C1 3 C1 4 C1 5 C1 6 C1 7 C1 8 C1 9 C2 0 C2 1 PP ( t h a –1 )
Potencial Productivity - Mid Ratoon Crop
c Scenarios 50 75 100 125 150 175 200 225 250
C0 C1 C2 C3 C4 C5 C6 C7 C8 C9
C1 0 C1 1 C1 2 C1 3 C1 4 C1 5 C1 6 C1 7 C1 8 C1 9 C2 0 C2 1 PP ( t h a –1 ) Scenarios
Potencial Productivity - Late Ratoon Crop
which implies that the impacts of the assumed varia-tion due to temperature, CO2 and technology on pro-ductivity were higher than the impact of sunshine hours. Whereas increments in yield were from 6 to 17% due to increases in temperature, from 2 to 10% due to CO2, and from 6 to 32 t ha–1 due to technology, the variation in sunshine hours only resulted in yield variations between -0.28% and +0.93%.
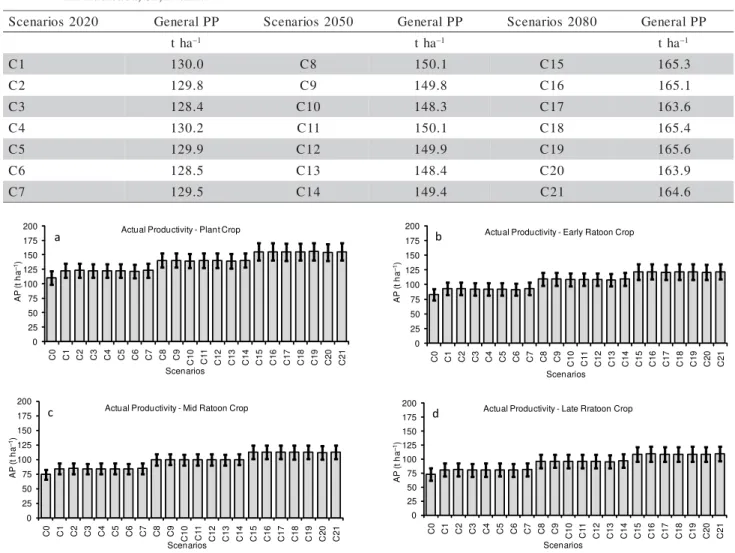
The actual productivities, in which the effect of the water deficit is considered, show similar behavior to the potential productivity in the future scenarios (Fig-ure 5). In the current climate conditions (C0), the ac-tual productivity is 110 t ha–1 for the sugarcane plant crop, 83 t ha–1 for the early ratoon crop, 74 t ha–1 for the mid ratoon crop, and 73 t ha–1 for the late ratoon crop. For the future scenarios, the actual productivity of the sugarcane plant crop may range from 122 to 123 t ha–1 in 2020 (C1 to C7), from 139.4 to 140.6 t ha–1 in 2050 (C8 to C14) and from 154.7 to 155.9 t
ha–1 in 2080 (C15 to C21). For ratoon crops, the ac-tual productivity for scenarios C1 to C7 (2020) may range from 91.6 to 93 t ha–1 for the early cycle, from 83.5 to 84.4 t ha–1 for the mid cycle, and from 80.2 to 81.4 t ha–1 for the late cycle. For 2050, correspond-ing to scenarios C8 to C14, the actual productivity may increase, ranging from 108 to 109.4 t ha–1 for the early cycle, from 99.2 to 99.9 t ha–1 for the mid cycle, and from 95.4 to 96.7 t ha–1 for the late cycle. Finally, in 2080, scenarios from C15 to C21, the ratoon crop ac-tual productivity may reach the following ranges: from 121 to 122 t ha–1 for the early cycle; from 112 to 112.7 t ha–1 for the mid cycle; and 108.2 to 109.3 t ha–1 for the late cycle (Figure 5).
Considering the proportion of the areas of each type of sugarcane maturity cycle in the field, the gen-eral actual productivity will change from the present 81 t ha–1 to the following ranges: from 90.1 to 91.2 t ha–1 in 2020, from 106.1 to 107.1 t ha–1 in 2050, and
Figure 5 - Actual productivity for sugarcane plant and ratoon (early, medium and late) crops under current conditions and for different future scenarios, in Piracicaba, SP, Brazil. The bars represent the standard deviation for an 80-year period.
0 25 50 75 100 125 150 175 200
C0 C1 C2 C3 C4 C5 C6 C7 C8 C9
C1 0 C1 1 C1 2 C1 3 C1 4 C1 5 C1 6 C1 7 C1 8 C1 9 C2 0 C2 1 AP ( t h a –1 )
Actual Productivity - Mid Ratoon Crop
c Scenarios 0 25 50 75 100 125 150 175 200
C0 C1 C2 C3 C4 C5 C6 C7 C8 C9
C1 0 C1 1 C1 2 C1 3 C1 4 C1 5 C1 6 C1 7 C1 8 C1 9 C2 0 C2 1 AP ( t h a –1 ) Scenarios
Actual Productivity - Late Rratoon Crop
d 0 25 50 75 100 125 150 175 200
C0 C1 C2 C3 C4 C5 C6 C7 C8 C9
C1 0 C1 1 C1 2 C1 3 C1 4 C1 5 C1 6 C1 7 C1 8 C1 9 C2 0 C2 1 AP ( t h a –1)
Actual Productivity - Early Ratoon Crop
b Scenarios 0 25 50 75 100 125 150 175 200
C0 C1 C2 C3 C4 C5 C6 C7 C8 C9
C1 0 C1 1 C1 2 C1 3 C1 4 C1 5 C1 6 C1 7 C1 8 C1 9 C2 0 C2 1 AP ( t h a –1)
Actual Productivity - Plant Crop
a Scenarios 0 2 0 2 s o i r a n e c
S GeneralPP Scenarios2050 GeneralPP Scenarios2080 GeneralPP
a h
t –1 tha–1 tha–1
1
C 130.0 C8 150.1 C15 165.3
2
C 129.8 C9 149.8 C16 165.1
3
C 128.4 C10 148.3 C17 163.6
4
C 130.2 C11 150.1 C18 165.4
5
C 129.9 C12 149.9 C19 165.6
6
C 128.5 C13 148.4 C20 163.9
7
C 129.5 C14 149.4 C21 164.6
from 119.2 to 120.1 t ha–1 in 2080 (Table 7), which correspond to increases of 12%, 32%, and 47%, re-spectively.
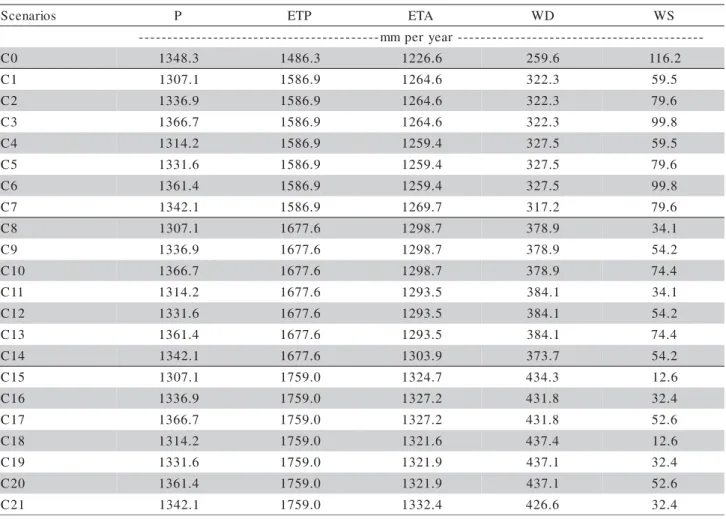
Even considering that the water balance would change in the future scenarios (Table 8), as also highlighted by Salati et al. (2006) and Horikoshi & Fisch (2007), the effects of increasing water defi-cit would have less impact on AP than those caused
by temperature, CO2 concentration and technologi-cal advances. Whereas higher temperatures will in-crease potential productivity by 6 to 17% in the fu-ture scenarios, the higher water deficits, resulting from increasing potential evapotranspiration, will re-duce actual productivity by 1.7% in 2020, by 3.2% in 2050, and by 4.5% in 2080. This weak effect of water deficits on actual yield is explained by the
Table 8 - Annual rain (P), potential evapotranspiration (ETP), actual evapotranspiration (ETA), water deficit (WD) and water surplus (WS), obtained by the 10-day normal water balance, for the current scenario and for the scenarios of climate changes, in Piracicaba, SP, Brazil.
s o i r a n e c
S P ETP ETA WD WS
-r a e y r e p m m
-0
C 1348.3 1486.3 1226.6 259.6 116.2
1
C 1307.1 1586.9 1264.6 322.3 59.5
2
C 1336.9 1586.9 1264.6 322.3 79.6
3
C 1366.7 1586.9 1264.6 322.3 99.8
4
C 1314.2 1586.9 1259.4 327.5 59.5
5
C 1331.6 1586.9 1259.4 327.5 79.6
6
C 1361.4 1586.9 1259.4 327.5 99.8
7
C 1342.1 1586.9 1269.7 317.2 79.6
8
C 1307.1 1677.6 1298.7 378.9 34.1
9
C 1336.9 1677.6 1298.7 378.9 54.2
0 1
C 1366.7 1677.6 1298.7 378.9 74.4
1 1
C 1314.2 1677.6 1293.5 384.1 34.1
2 1
C 1331.6 1677.6 1293.5 384.1 54.2
3 1
C 1361.4 1677.6 1293.5 384.1 74.4
4 1
C 1342.1 1677.6 1303.9 373.7 54.2
5 1
C 1307.1 1759.0 1324.7 434.3 12.6
6 1
C 1336.9 1759.0 1327.2 431.8 32.4
7 1
C 1366.7 1759.0 1327.2 431.8 52.6
8 1
C 1314.2 1759.0 1321.6 437.4 12.6
9 1
C 1331.6 1759.0 1321.9 437.1 32.4
0 2
C 1361.4 1759.0 1321.9 437.1 52.6
1 2
C 1342.1 1759.0 1332.4 426.6 32.4
Table 7 - General sugarcane actual productivity (AP), considering the proportion of each type of maturity cycle in the field: 15% with plant crop; 25% with early ratoon crop; 39% with mid ratoon crop; and 21% with late ratoon crop, in Piracicaba, SP, Brazil.
0 2 0 2 s o i r a n e c
S GeneralAP Scenarios2050 GeneralAP Scenarios2080 GeneralAP
a h
t –1 tha–1 tha–1
1
C 90.9 C8 107.0 C15 119.8
2
C 91.1 C9 107.0 C16 120.1
3
C 90.4 C10 106.3 C17 119.5
4
C 90.7 C11 106.6 C18 119.6
5
C 90.8 C12 106.7 C19 120.0
6
C 90.1 C13 106.1 C20 119.2
7
small differences observed in the relative water defi-cit (1 - ETa/ETc), used in equation 13. It varied, on average, from 0.175 for the current conditions (C0) to 0.203 in 2020 (C1 to C7), 0.226 in 2050 (C8 to C14), and 0.246 in 2080 (C15 to C21). Such small effects of water deficits on AP are controlled not only by the changes in ETP and rain, but also by the time of the year when they occur, since the sug-arcane crop will respond with different intensities to water deficit depending on its growth phase. While water deficit causes intense yield losses dur-ing sproutdur-ing, establishment and the period of high vegetative growth, it is favorable during the matu-ration process having less impact on yield (Doorenbos & Kassam, 1994).
The sugarcane yield loss from potential to actual productivity [(1-AP/PP)*100] for the current scenario (C0) is 28%. It will increase to 30% for scenarios C1 to C7, and to 29% for scenarios C8 to C14. For sce-narios C15 to C21, such yield loss will decrease to 27%. These results reinforce the weak impact of the future water deficit scenarios on productivity, as men-tioned before.
The results of this study, which include the ef-fect of climate change and technology advances, in-dicate increases in the potential and actual productivities of sugarcane in every future scenario for the Piracicaba region, in relation to the current conditions. However, these data should be consid-ered as only an indication of what may happen in future situations, since the evaluation of the impacts of climate changes on agricultural productivity by crop simulation models is very uncertain. The main reason for caution is related to the climate uncer-tainty under higher CO2 concentrations, as observed by Challinor et al. (2005). These authors also ob-served that yield is more affected by perturbation of climate parameters than crop model parameters in both the present-day and doubled CO2 climates; crop transpiration efficiency was crucial for crop model uncertainty in both present-day and doubled CO2 climates; and the response of crop development to mean temperature contributed little to uncertainty in the present-day simulations but was among the largest contributors under doubled CO2.
The direct use of climate change estimates from large-scale models at a regional level was made with-out a downscaling technique. Such an approach, us-ing climate change values calculated at large spatial resolutions with general circulation models, as pre-sented by IPCC, 2007, could bring large biases to the projections at a regional scale, making the results even more uncertain.
Consequences of the future scenarios on the sug-arcane sector considering climate changes in the Piracicaba region
The world supply of energy is mainly based on fos-sil fuels. Their use on a world-wide scale tends to ex-haust the sources, leaving a critical condition for fu-ture generations. Additionally, the use of fossil fuels is responsible for serious local pollution problems and for most of the global emission of gases that cause the greenhouse effect.
The current challenge is to find renewable sources of energy and to increase the efficiency of their gen-eration and use. In Brazil, the sugarcane industry pre-sents an important opportunity for the replacement of fossil fuels. An increase in sugarcane productivity as a consequence of climate change may have im-portant impacts on the sugarcane sector, such as the possibility that the crop will expand to regions now unfeasible for production, due to low temperatures that inhibit the growth of the crop (Zullo Júnior et al., 2006; Melo et al., 2007). An increase in tempera-ture will entail additional beneficial effects, such as an increase in productivity, since the air temperature will be closer to the ideal values for the crop, posi-tively affecting the photosynthetic efficiency. An in-crease in the CO2 concentration will be another stimu-lus for the sugarcane plant, since it responds to this fertilization effect with an increase in biomass pro-duction (Souza, 2007).
Along with environmental factors, technological ad-vances play an important role in the development of the sugarcane crop, since genetic improvement of the plant, associated to adequate management practices, is responsible for an increase in productivity of 0.43 t ha–1 per year. This produces an additional 6, 19 and 32 t ha–1 of yield for 2020, 2050 and 2080 respectively, which represents around 35, 51 and 61% of the re-spective total projected increase in general potential crop productivity. All these factors may lead to an op-timization of the land use, that is, a higher production over smaller areas.
CONCLUSIONS
and 61% in 2080. Changes in solar radiation and rain-fall will have less effect on sugarcane productivity, which is fortunate because forecasts of these variables have very high uncertainty. The PP will increase by 15% in relation to the present condition in 2020, by 33% in 2050 and by 47% in 2080. Regarding the AP, the increase observed in PP will mostly compensate for the negative effect of an increasingly deficit of water. AP will increase by 12% in relation to the present condition in 2020, by 32% in 2050 and by 47% in 2080. Although the results show increases in sugar-cane potential and actual productivities in all future sce-narios, they have to be considered with caution, due to the high degree of uncertainty related to the limita-tions of the used agrometeorological model, the un-certainties of the future climate, and to the large spa-tial resolution of the adopted climate change projec-tions.
ACKNOWNLEDGMENTS
The authors are thankful to CAPES, for the schol-arship for the first author, to CNPq, for the fellow-ship for the second author, and to the anonymous re-viewer for the important suggestions which contrib-uted to the improvement of the manuscript. To Dr. Terry Gillespie, University of Guelph, Canada, for re-viewing the manuscript and for the helpful sugges-tions.
REFERENCES
ALFONSI, R.R.; PEDRO JÚNIOR, M.J.; BRUNINI, O.; BARBIERI, V. Condições climáticas para cana-de-açúcar. In: PARANHOS, S. B. (Coord.) Cana-de-açúcar: cultivo e utilização. Campinas: Fundação Cargill, 1987. v.1, p.42-55.
ASSAD, E.D.; PINTO, H.S.; ZULLO JÚNIOR, J.; ÁVILA, A.M.H. Impacto das mudanças climáticas no zoneamento agroclimático do café no Brasil. Pesquisa Agropecuária Brasileira, v.39, p.1057-1064, 2004.
BARBIERI, V.; TUON, R.L. Metodologia para estimativa da
produção potencial de algumas culturas. Piracicaba:
ESALQ/Departamento de Física e Meteorologia. 1992. 17p.
BARBIERI, V.; TERUEL, D.A.; SILVA, J.G.; SANTOS, R.M.N. Balanço hídrico de Thornthwaite e Mather modificado para estimativa de deficiência nas culturas. In: CONGRESSO BRASILEIRO DE AGROMETEOROLOGIA, 10., Piracicaba, 1997. Anais. Piracicaba: Sociedade Brasileira de Agrometeorologia; 1997. p.587-589.
CAMARGO, A.P.; MARIN, F.R.; SENTELHAS, P.C.; PICINI, A.G. Ajuste da equação de Thornthwaite para estimar a evapotranspiração potencial em climas áridos e superúmidos, com base na amplitude térmica. Revista Brasileira de Agrometeorologia, v.7, p.251-257, 1999.
CHALLINOR, A.J.; WHEELER, T.R.; SLINGO, J.M.; HEMMING, D. Quantification of physical and biological uncertainty in the simulation of the yield of a tropical crop using present day and doubled CO2 climates. Philosophical Transactions of the Royal Society B, v.360, p.2085-2094, 2005.
CERRI, C.E.P.; SPAROVEK, G.; BERNOUX, M.; EASTERLING, W.E.; MELILLO, J.M.; CERRI, C.C. Tropical agriculture and global warming: impacts and mitigations options. Scientia Agricola, v.64, p.83-99, 2007.
DOORENBOS, J.; KASSAM, A.H. Efeito da água no rendimento das culturas. Campina Grande: UFPB, 1994. 306p. (Estudos FAO Irrigação e Drenagem).
FISCHER, G.; SHAH, M.; VELTHUIZEN, H. van. Climate change and agricultural vulnerability. Johannesburg: IIASA. 2002. 152p. GAZZOLA, S.T. Caracterização climática e os efeitos da variabilidade das condições meteorológicas nas produtividades potencial e real da cana-de-açúcar em Piracicaba (SP). Piracicaba: USP/ESALQ, 2007. 61p. (Relatório de Estágio Profissionalizante - Engenharia Agronômica). GOLDEMBERG, J.; LUCON, O. Energia e meio ambiente no Brasil.
Estudos Avançados, v.21, p.7-20, 2007.
HORIKOSHI, A.S.; FISCH, G. Balanço Hídrico atual e simulações para cenários climáticos futuros no município de Taubaté, SP, Brasil. Revista Ambiente e Água: An Interdisciplinary Journal of Applied Science, v.2, p.33-46, 2007.
INSTITUTO BRASILEIRO DE GEOGRAFIA E ESTATÍSTICA -IBGE. Available in www.sidra.ibge.gov.br. Accessed 23 Jun. 2007. INTERGOVERNMENTAL PANEL ON CLIMATE CHANGE.-IPCC. Climate change 2007:the physical science basis. Summary for Policymakers. Working Group I. Available at: http://ipcc-wg1.ucar.edu/wg1/Report/AR4WG1_Pub_SPM-v2.pdf.. Accessed 01 Jun. 2007.
MARENGO, J.A. Mudanças climáticas globais e seus efeitos sobre a biodiversidade: caracterização do clima atual e definição das alterações climáticas para o território brasileiro ao longo do século XXI., Brasília: Ministério do Meio Ambiente, 2006. v.26, 212 p. (Série Biodiversidade).
MARIN, F.R.; LOPES-ASSAD, M.L.; ASSAD, E.D.; VIAN, C.E.; SANTOS, M.C. Sugarcane crop efficiency in two growing seasons in São Paulo State, Brazil. Pesquisa Agropecuária Brasileira, v.43, p.1449-1455, 2008.
MELO, S.B.; GALON, L.; SOUZA, E.F.M.; REZENDE, M.L.; RENATO, N.S. Aquecimento global e um estudo da produtividade potencial da cana-de-açúcar para a região de São Paulo.
Caatinga, v.20, p.10-17, 2007.
PEREIRA, A.R.; ANGELOCCI, L.R.; SENTELHAS, P.C.
Agrometeorologia: fundamentos e aplicações práticas. Guaíba: Agropecuária, 2002. 478p.
ROLIM, G.S.; SENTELHAS, P.C.; BARBIERI, V. Planilha no ambiente Excel para os cálculos de balanços hídricos: normal, seqüencial, de cultura e de produtividade real e potencial. Revista Brasileira de Agrometeorologia, v.6, p.133-137, 1998. ROLIM, G.S.; SENTELHAS, P.C.; UNGARO, M.R.G. Análise de
risco climático para a cultura do girassol, em algumas localidades de São Paulo e do Paraná, usando os modelos DSSAT/OILCROP-SUN e FAO. Revista Brasileira de Agrometeorologia, v.9, p.91-102, 2001.
SALATI, E.; SANTOS, A.A.; KLABIN, I. Temas ambientais relevantes. Estudos Avançados, v.20, p.107-127, 2006. SANTOS, M.C.; SENTELHAS, P.C.; MARIN, F.R. Calibração do
modelo agrometeorológico da FAO para a estimativa da produtividade potencial e real da cana-de-açúcar (Saccharum spp). In: Simpósio Internacional de Iniciação Científica da Universidade de São Paulo, 2006, Piracicaba. XIV SIICUSP. Anais. São Paulo : Universidade de São Paulo, 2006. v.1. CD-ROM.
SIMON, C.; DeFRIES, R.S. Uma terra, um futuro. São Paulo: Makron Books, 1992. 189p.
SOUZA, A.P. A cana-de-açúcar e as mudanças climáticas:
efeitos de uma atmosfera enriquecida em CO2 sobre o crescimento, desenvolvimento e metabolismo de carboidratos de Saccharum spp. Campinas: UNICAMP, 2007. 85p. Dissertação Dissertação (Mestrado).
TERUEL, D.A.; BARBIERI, V.; FERRARO JÚNIOR, L.A. Sugarcane leaf area index modeling under different soil water conditions. Scientia Agricola, v.54, p.39-44, 1997. THORNTHWAITE, C.W. An approach toward a rational
classification of climate. Geographical Review, v.38, p.55-94, 1948.
THORNTHWAITE, C.W.; MATHER, J.R. The water balance.
Publications in Climatology. Philadelphia: Drexel Institute of Technology, 104p. 1955.
TUBIELLO, F.N.; DONATELLI, M.; ROSENZWEIG, C.; STOCKLE, C.O. Effects of climate change and elevated CO2 on cropping systems: model predictions at two Italian locations.
European Journal of Agronomy, v.13, p.179-189, 2000.
ZULLO JÚNIOR, J.; PINTO, H. S.; ASSAD, E.D. Impact assessment study of climate change on agricultural zoning. Meteorological Applications, v.1, p.69-80, 2006.