Climate change scenarios and their impact on the water balance of
sugarcane production areas in the State of São Paulo, Brazil
(http://dx.doi.org/10.4136/ambi-agua.907)
Dayana L. dos Santos1; Paulo C. Sentelhas2
1Agricultural Systems Engineering Graduate Program, ESALQ,
University of São Paulo, Piracicaba, SP, Brazil. e-mail: dayana.santos@usp.br,
2Biosystems Engineering Department, ESALQ,
University of São Paulo, Piracicaba, SP, Brazil.e-mail: pcsentel.esalq@usp.br
ABSTRACT
The evidence of climate changes has increased the demand for biofuel such as the ethanol from sugarcane, which has major comparative advantages in economic and environmental terms in relation to other biofuel sources. The sugarcane production in the State of São Paulo is highly influenced by the soil water availability, which is the main factor causing inter-annual yield variability. With the expected climate change, the crop water balance in the sugarcane production regions may be affected, which will also bring consequences for crop production. Based on that, the objective of this study was to assess the impacts of different climate changes scenarios on potential (ETP) and actual (ETA) evapotranspiration, as well as on water deficit (WD) and water surplus (WS) for four sugarcane production regions in the state of São Paulo, Brazil. For that, twelve climate changes scenarios, with increasing temperatures and rainfall variation, were considered for the years of 2030, 2060 and 2090, based on 2007 IPCC´s report. The results indicated that ETP will increase substantially as a function of higher air temperatures projected for the future scenarios. However, for ETA the elevation will not be so intense due to the variations projected for the rainfall scenarios. In general, the expectation is the reduction of the soil water availability in all locations by 2090, with substantial increase in the WD, around 550, 650, 530 e 720 mm for the worst scenario in relation to the present conditions, respectively for Araçatuba, Assis, Jaboticabal and Piracicaba.
Keywords: Global warming, climatological water balance, evapotranspiration, water deficit.
Cenários de Mudanças Climáticas e seus Impactos no Balanço Hídrico
de Regiões Canavieiras do Estado de São Paulo, Brasil
RESUMO
regiões produtoras de cana-de-açúcar no Estado de São Paulo. Para tanto, foram considerados doze cenários de mudanças climáticas para os anos de 2030, 2060 e 2090, baseados no relatório do IPCC de 2007. Os resultados indicam aumentos acentuados da ETP em função do aumento da temperatura do ar nos diferentes cenários. No entanto, para a ETA esses aumentos não serão tão acentuados devido à variação no regime hídrico. Espera-se uma redução na disponibilidade hídrica em todas as localidades para o ano de 2090, com aumento significativo do WD, da ordem de 550, 650, 530 e 720 mm para o pior cenário em relação à condição atual, respectivamente para Araçatuba, Assis, Jaboticabal e Piracicaba.
Palavras-chave: Aquecimento global, balanço hídrico climatológico, evapotranspiração, deficiência hídrica.
1. INTRODUCTION
The projections of global climate change promoted by the anthropic action, having as consequence the increasing greenhouse effect, is becoming more and more accepted by the scientific and agricultural communities around the world (Marengo, 2008). As a consequence of that, there is an special concern by creating new sources of renewable energy which has increasing the demand by biofuels, including the sugarcane ethanol, which has several advantages in relation to other sources.
In this context, Brazil has a competitive advantage in relation to other countries, since it is the most traditional sugarcane producer in the world, with more than 8 million of hectares planted and a production of 571.5 million of tons during the 2011/12 growing season, with 287.6 million of tons for producing 22.9 billion liters of ethanol (CONAB, 2011). The state of São Paulo is the main sugarcane producer in the country, counting with more than 200 mills. In this state, the sugarcane is produced in different environments with diverse climatic conditions which affect the cane yield (Teramoto, 2003), as well as all the activities related to the production, transport and storage (Pereira et al., 2002).
In the state of São Paulo, the rainfall inter-annual variability is the main cause of sugarcane yield fluctuation, since it affects the soil water balance and, consequently, the water availability for plants. So, any change in the water balance variables, mainly rainfall and/or evapotranspiration, will promote changes in the plant water consumption. Based on the results of Marks et al. (1993), Medeiros (2003) and Villani et al. (2011), an increase in air temperature will lead to a higher evapotranspiration which in a non-changing rainfall regime or in a scenario of less rainfall will promote an increase in the water deficit for plants and, as consequence, a decrease in crop yield by a reduced evapotranspiration. Also, any change in the rainfall regime, with an increase or a decrease in the precipitation amount will result in changes in the water balance (Horikoshi and Fisch, 2007), with positive or negative impacts on agriculture. Results from the study carried out by Liberato and Brito (2010) showed that the climate changes projected for Occidental Amazon will result in a drier climate, with reduction in the soil water availability. In agriculture, such reduction associated with temperature changes will affect plant phenology, crops geographic distribution (crop zoning) and crop yield (Crimmins et al., 2011; Li et al., 2011; Pérez and Sierra, 2012).
be adopted by the authorities, growers and sugar mills to face the challenges of sugarcane production in the future climatic conditions.
2. MATERIAL AND METHODS
The present study was developed for four sugarcane regions in the state of São Paulo,
Brazil, named: Araçatuba (lat.: 20º52’ S, long.: 48º29’ W; alt.: 415 masl); Assis (lat.: 22º38’ S, long.: 50º24’ W, alt.: 560 masl); Jaboticabal (lat.: 21º15’ S; long.: 48º19’ W; alt.: 595 masl) and Piracicaba (lat.: 22º42’ S; long.: 47º38’ W; alt.: 546 masl).
The weather data of the locations listed above were obtained from different sources. Ten-day period data of air temperature were estimated with multiple linear models proposed by Pedro Jr. et al. (1991), based on the normal data from the Brazilian Meteorological Service (INMET) and Agronomic Institute of Campinas (IAC), as a function of latitude, longitude and altitude. The daily average sunshine hours data for each 10-day period were also estimated by multiple linear models, as proposed by Monteiro (2012). Sunshine hours were used to estimate global solar radiation (Rg) by the Angstron-Prescott´s method (Pereira et al., 2002). The daily rainfall data of a 30-year period, from 1979 to 2008, was obtained from the Brazilian Water Agency (ANA), for each location, and transformed in the same 10-day time scale. For the description of the present conditions, the monthly climate data was considered, whereas for the comparisons among the present and future scenarios the annual time scale was analyzed.
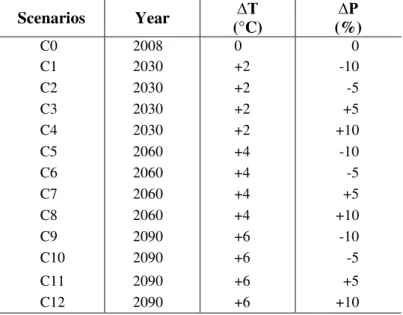
Twelve future scenarios were created for the years of 2030, 2060 and 2090 by combining changes in temperature and rainfall for the four regions. A combination of the three A1 scenarios was used (IPCC, 2007). These scenarios (A1T, A1B and A1Fl) were adopted because they present a full range of variations for air temperature, from 1.4 to 6.4oC. Based on that, the actual temperature data base was increased by 2, 4 and 6oC. For rainfall, as the projections for the state of São Paulo have a great uncertainty associated to, the future scenarios were based on the percentages in relation to the present scenario (-10, -5, +5 and +10 %) suggested by the 2007 IPCC´s report for all this region of Brazil. The changes for rainfall were applied for each rainfall event of the 30-year series in order to evaluate the inter-annual variability of this variable as well as of water balance variables. Table 1 presents all the combinations of the proposed future scenarios, having as reference the average data from 1979 to 2008, mentioned as scenario C0, which refers to the normal data obtained in the end of 2008.
Air temperature data, from C0 to C12 scenarios, were used to estimate potential evapotranspiration (ETP) considering the method of Thornthwaite (1948) adjusted by Camargo et al. (1999). Such method uses the effective temperature (Tef) which is calculated as a function of daily extreme temperatures. This ETP method was chosen among several others for using only air temperature and photoperiod as variables, and for presenting accurate estimates for the state of São Paulo, as presented by Camargo et al. (1999).
ETP, rainfall and soil water holding capacity (SWHC) for each location and scenario were used for estimating the 10-day serial water balance by the method of Thornthwaite and Mather (1955), which was programmed in an Excel spreadsheet by Rolim et al. (1998). The outputs of the water balance are: soil water content; actual evapotranspiration (ETA); water deficit (WD); and water surplus (WS).
2008). Based on that and considering a root depth of 100 cm for sugarcane crop, the SWHC ranged from 70 to 120 mm, as presented in Table 2.
Table 1. Present (C0) and future scenarios of climate change (C1 up to C12) considering the combinations of increase in
temperature (∆T) and variation in rainfall (∆P).
Scenarios Year (°C)∆T (%) ∆P
C0 2008 0 0
C1 2030 +2 -10
C2 2030 +2 -5
C3 2030 +2 +5
C4 2030 +2 +10
C5 2060 +4 -10
C6 2060 +4 -5
C7 2060 +4 +5
C8 2060 +4 +10
C9 2090 +6 -10
C10 2090 +6 -5
C11 2090 +6 +5
C12 2090 +6 +10
Table 2. Soil types for each location and their respective water holding capacity (SWHC) in the studied regions.
Location Soil Type SWHC
(mm)
Araçatuba, SP Sandy-Loam 70
Assis, SP Loam 90
Jaboticabal, SP Clay-Loam 120
Piracicaba, SP Loam 90
The results were analyzed by comparing the changes promoted by the future scenarios in relation to the present one, considered as 2008.
3. RESULTS AND DISCUSSION
3.1. Climate characteristics of the studied areas: present conditions
Jaboticabal has temperature between the conditions presented for Araçatuba and Assis/Piracicaba, with an annual average temperature of 22.5ºC.
Regarding the solar energy variables (Table 4), it is clear that there are no much differences among the four locations studied. The seasonal variation of sunshine hours follows the rainfall regime, having an inverse relationship between them. This variable ranges from 6.4 h in the rainy season (summer) to 8.2 h in the dry season (winter). Photoperiod or maximum sunshine hours is an astronomical variable and consequently is influenced by latitude. As latitude is very similar among the four locations, ranging from 21 to 23o, there is no much variation in photoperiod for them, ranging seasonally from 10.6 to 13.4 h in average. Finally, for global solar radiation the values follow basically the photoperiod variation, but are also modulated by the sunshine hours. The Rg variation along the year is, in average, from 13.1 MJm-2day-1 in June to 22.6 MJm-2day-1 in November.
Table 3. Estimated normal maximum (Tmax), minimum (Tmin) and average (Tavg) air temperature, in
oC, for Araçatuba, Assis, Jaboticabal and Piracicaba, in the state of São Paulo, Brazil.
Location Variable Jan Feb Mar Apr May Jun Jul Aug Sep Oct Nov Dec Annual
Araçatuba
Tmax 31.7 31.9 31.7 30.5 28.6 27.6 27.9 30.5 31.5 31.7 31.8 31.4 30.6 Tmin 20.1 20.3 19.6 17.1 14.5 13.2 12.6 14.3 16.4 18.0 18.6 19.7 17.0 Tavg 25.9 26.1 25.7 23.8 21.6 20.4 20.3 22.4 24.0 24.9 25.2 25.6 23.8
Assis
Tmax 30.2 30.3 29.9 28.2 26.2 25.0 25.3 27.4 28.3 28.9 29.5 29.4 28.2 Tmin 18.8 19.0 18.3 15.6 12.9 11.4 10.9 12.3 14.3 15.9 16.8 18.1 15.4 Tavg 24.5 24.7 24.1 21.9 19.6 18.2 18.1 19.9 21.3 22.4 23.2 23.8 21.8
Jaboticabal
Tmax 30.3 30.4 30.2 29.0 27.3 26.2 26.6 29.0 30.2 30.3 30.3 30.0 29.1 Tmin 19.0 19.2 18.5 16.0 13.4 12.1 11.5 13.1 15.2 16,9 17.5 18.5 15.9 Tavg 24.7 24.8 24.4 22.5 20.4 19.2 19.1 21.1 22,7 23.6 23.9 24.3 22.5
Piracicaba
Tmax 30.0 30.1 29.7 28.0 26.0 24.9 25.1 27.2 28.2 28.7 29.3 29.3 28.0 Tmin 18.7 18.9 18.1 15.5 12.8 11.3 10.7 12.1 14.1 15.8 16.7 18.0 15.2 Tavg 24.4 24.5 23.9 21.8 19.4 18.1 17.9 19.7 21.2 22.3 23.0 23.7 21.6
Table 4. Estimated normal sunshine hours (n), maximum sunshine hours (N) and global solar radiation (Rg, MJm-2day-1) for Araçatuba, Assis, Jaboticabal and Piracicaba, in the state of São Paulo, Brazil.
Location Variable Jan Feb Mar Apr May Jun Jul Aug Sep Oct Nov Dec Annual
Araçatuba
n 6.9 6.7 6.6 7.0 7.0 6.9 7.4 8.1 8.0 7.7 7.7 7.0 6.9
N 13.1 12.7 12.1 11.5 11.0 10.8 10.9 11.3 11.9 12.5 13.0 13.2 12.0 Rg 21.5 20.5 19.2 17.2 15.0 13.7 14.6 17.5 20.0 21.5 22.6 21.7 18.3
Assis
n 6.8 6.5 6.4 6.6 6.6 6.6 7 7.6 7.5 7.3 7.4 6.8 7.2
N 13.1 12.7 12.1 11.5 11.0 10.8 10.9 11.3 11.9 12.5 13.0 13.2 12.0 Rg 21.3 20.3 18.7 16.7 14.5 13.3 14.2 16.9 19.3 20.9 22.1 21.3 18.8
Jaboticabal
n 6.8 6.5 6.5 6.8 6.9 6.8 7.3 8 8 7.6 7.6 7.0 7.1
N 13.2 12.7 12.1 11.5 11.0 10.7 10.8 11.3 11.9 12.5 13.0 13.3 12.0 Rg 21.4 20.2 18.8 16.8 14.6 13.3 14.3 17.1 19.9 21.3 22.4 21.7 18.5
Piracicaba
n 6.7 6.6 6.6 6.8 6.9 7.0 7.6 8.2 7.9 7.6 7.7 7.0 7.2
N 13.3 12.8 12.2 11.5 10.9 10.6 10.7 11.2 11.9 12.5 13.1 13.4 12.0 Rg 21.3 20.4 18.8 16.6 14.3 13.1 14.2 17.0 19.5 21.3 22.6 21.9 18.4
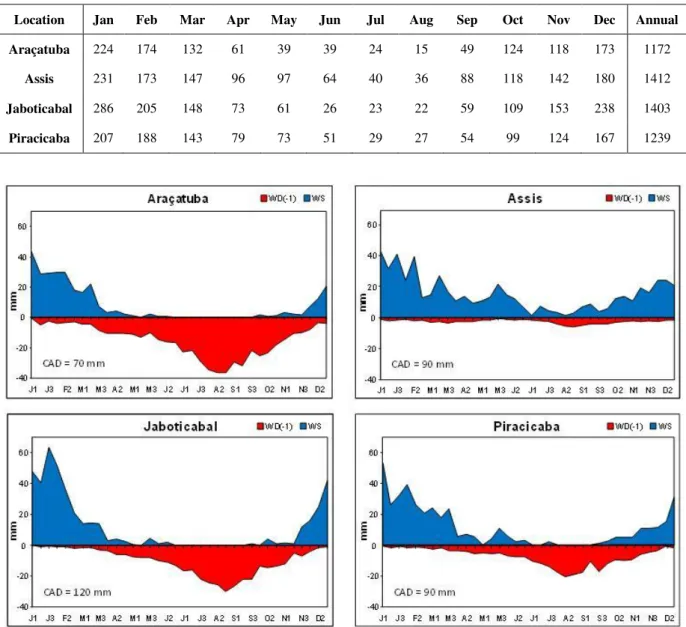
seasonal variation is similar among locations, with a rainy summer, with the total rainfall from October to March representing around 75% of the annual total, and a dry winter. The rainfall regime is mainly caused by convective rains, during the summer, and the influence of high pressure at central Brazil, during the winter, which inhibit the rainfall. The only few rain events during the winter is due to the penetration of cold fronts from south of Brazil.
When the water balance was determined for each location using the 30-year series (1979-2008), the average water surplus and average water deficit were determined for each one of the 36 ten-day periods of the year. These data are presented in Figures 1 to 4 and show the current water availability regime along the year for these locations.
Table 5. Normal monthly (mm month-1) and annual (mm year-1) rainfall for Araçatuba, Assis,
Jaboticabal and Piracicaba, in the state of São Paulo, Brazil, from 1979 to 2008. Source: Brazilian Water Agency.
Location Jan Feb Mar Apr May Jun Jul Aug Sep Oct Nov Dec Annual
Araçatuba 224 174 132 61 39 39 24 15 49 124 118 173 1172
Assis 231 173 147 96 97 64 40 36 88 118 142 180 1412
Jaboticabal 286 205 148 73 61 26 23 22 59 109 153 238 1403
Piracicaba 207 188 143 79 73 51 29 27 54 99 124 167 1239
Figure 1 shows the great difference observed among the four locations, with Assis presenting a predominance of water surplus along the year, with very low water deficiency, even during the winter, when there is the dry season and the monthly rainfall decreases substantially. In Araçatuba, the water deficit is the most intense, showing its highest values during August. Water deficit also can be observed, with less intensity, during the rainy season, showing that there is a higher possibility of dry spells, which are local named as
veranicos, than the other locations. Jaboticabal and Piracicaba are in a transition between the
wetter climate of Assis and the drier climate of Araçatuba, with Jaboticabal a little bit drier during the winter than Piracicaba, but with very similar water surplus conditions during the summer.
The wet season in Araçatuba, Jaboticabal and Piracicaba, in average, lasts from November to March, with the water surplus totaling, respectively, 209, 288 and 181 mm. In Assis the water surplus is better distributed along the year, totaling 244 mm. For water deficit, the predominance is from April to October, except for Assis, which has very few water deficits, but occurring all year long. In average, the annual water deficit is around 480 mm in Araçatuba, 248 mm in Jaboticabal and 146 mm in Piracicaba. In Assis, however, the annual water deficit is less than 1/5 of what happen in Araçatuba, which means only 61 mm per year.
3.2. Climate characteristics of the studied areas: future scenarios
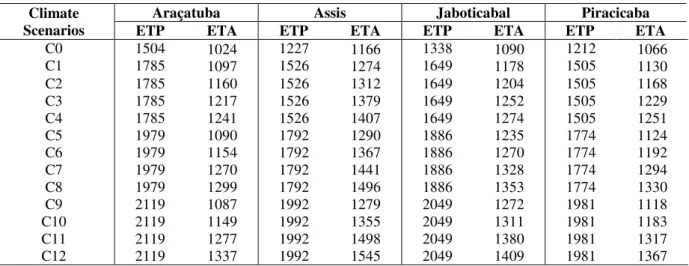
Based on the future temperature and rainfall scenarios, the potential (ETP) and actual (ETA) evapotranspiration were estimated, as well as the water balance for each one of the locations studied (Tables 6 and 7). Based on these results, there is an expectation of very high values of ETP in the future scenarios, in accordance to the higher temperature, with increases, in relation to the present conditions, ranging from 19 to 41% in Araçatuba, from 24 to 62% in Assis, from 23 to 53% in Jaboticabal, and from 24 to 63% in Piracicaba (Table 6). Similar results were reported by Marks et al. (1993) and Horikoshi and Fisch (2007), working respectively in a basin and municipality scales.
Even considering that ETA is influenced by ETP, the changes in this variable in the future scenarios demonstrated that it will be also influenced by the magnitude of the changes in the rainfall regime. For Araçatuba and Piracicaba, the minimum changes in ETA were obtained in the scenario C9 (2090: T= +6ºC; P= -10%), whereas in Assis and Jaboticabal this happened in the scenario C1 (2030: T= +2ºC; P= -10%). For the highest values of ETA, all locations will have them under the scenario C12 (2090: T= +6ºC; P= +10%), which combine the increase of ETP, caused by temperature increase, with the higher rainfall amount, resulting in a higher ETA.
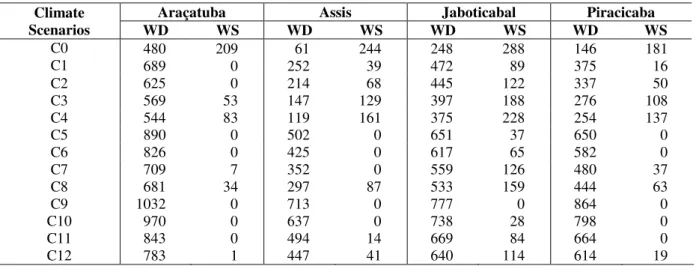
C11. Finally, in Jaboticabal, the changes in WD will be between what will happen in the other locations, with WD increase ranging between 51% in C4 and 314% in C9. On the other hand, Jaboticabal will be the only location with WS = 0 just in one scenario (C9).
Based on the results of Table 7, a reduction in the water availability (WD increase and WS decrease) is expected for all the scenarios of climate change, even when a rainfall increase is projected. The worst scenario, C9 (2090: T= +6ºC; P= -10%) will result in an increase of 553, 652, 529 and 717 mm for WD in relation to C0, respectively for Araçatuba, Assis, Jaboticabal and Piracicaba. WS will decrease abruptly, reaching zero in several scenarios, which means decreases of 209, 244, 288 and 181 mm for the same locations.
The results obtained with the present study is in accordance to other ones conducted in different parts of the world, as in Columbia river basin, in USA (Marks et al., 1993), in northern Jalisco, México (Ibarra-Montoya et al., 2011), in La Pampa province, Argentina (Pérez and Sierra, 2012), in Louess Plateau of China (Li et al., 2011), and in Brazil, like in Taubaté, in the Paraíba Valley (Horikoshi and Fisch, 2007), in the Occidental Amazon (Liberato and Brito, 2010), and in the Northeast semi-arid region (Medeiros, 2003). However, the results presented in this study is much more drastic then presented by these authors, which is related to the fact that the climate change scenarios were applied in all the historical series of rainfall data (from 1979 to 2008) in a 10-day time scale and not only in the monthly normal data. The results presented in this study in terms of WD and WS are the average of the results from the water balance processed for each year of the data series, representing a more comprehensive way to determine the actual average of these variables, as also considered by Gouvêa et al. (2009). The use of normal data can induce to an underestimation of the water balance parameters, giving an unreal vision of the expected water availability conditions for the future, which means much less impact.
Table 6. Annual potential (ETP) and actual (ETA) evapotranspiration in mm year-1, obtained by the serial climatological water balance, for the present condition (C0) and future scenarios of climate change (C1 to C12), in the locations of Araçatuba, Assis, Jaboticabal and Piracicaba, state of São Paulo, Brazil.
Climate Scenarios
Araçatuba Assis Jaboticabal Piracicaba
ETP ETA ETP ETA ETP ETA ETP ETA
C0
C1 1504 1785 1024 1097
1227
1526 1166 1274
1338
1649 1090 1178
1212
1505 1066 1130 C2 1785 1160 1526 1312 1649 1204 1505 1168 C3 1785 1217 1526 1379 1649 1252 1505 1229 C4 1785 1241 1526 1407 1649 1274 1505 1251 C5 1979 1090 1792 1290 1886 1235 1774 1124 C6 1979 1154 1792 1367 1886 1270 1774 1192 C7 C8 C9 C10 C11 C12 1979 1979 2119 2119 2119 2119 1270 1299 1087 1149 1277 1337 1792 1792 1992 1992 1992 1992 1441 1496 1279 1355 1498 1545 1886 1886 2049 2049 2049 2049 1328 1353 1272 1311 1380 1409 1774 1774 1981 1981 1981 1981 1294 1330 1118 1183 1317 1367
water for sugarcane plants demand. This drastic scenario should be focused by authorities, scientists, sugarcane growers and sugar mills to prepare themselves for finding the best solutions of preparedness to deal with shortage of water in a world which is demanding each day more food (sugar) and energy (ethanol). The best solutions in this case would be the use of biotechnology to make available new water deficit resistant varieties and anti-transpirants that when applied on plants could reduce their transpiration (Fletcher and Nath, 1984).
Table 7. Annual water deficit (WD) and water surplus (WS) in mm year-1, obtained by the serial climatological water balance, for the present conditions (C0) and future scenarios of climate change (C1 to C12), in the locations of Araçatuba, Assis, Jaboticabal and Piracicaba, state of São Paulo, Brazil.
Climate Scenarios
Araçatuba Assis Jaboticabal Piracicaba
WD WS WD WS WD WS WD WS
C0
C1 480 689 209 0 252 61 244 39 248 472 288 89 146 375 181 16
C2 625 0 214 68 445 122 337 50
C3 569 53 147 129 397 188 276 108
C4 544 83 119 161 375 228 254 137
C5 890 0 502 0 651 37 650 0
C6 826 0 425 0 617 65 582 0
C7 C8 C9 C10 C11 C12 709 681 1032 970 843 783 7 34 0 0 0 1 352 297 713 637 494 447 0 87 0 0 14 41 559 533 777 738 669 640 126 159 0 28 84 114 480 444 864 798 664 614 37 63 0 0 0 19
4. CONCLUSIONS
From the results obtained in this study, we concluded that climate change, independently of the scenario considered, will impose an increase in potential and actual evapotranspirations, resulting in higher water deficits in all regions. This will be of great concern for sugarcane growers since it can reduce the yields of rainfed crops. On the other hand, water surplus will be reduced, which will have impact on groundwater and, consequently, on the water reservoirs levels, making irrigation very restrict and expansive. The changes in rainfall, positive (+10%) or negative (-10%), will have less influence on the water availability of the regions than the changes in temperature and, consequently, in evapotranspiration. In relation to the method of analysis, the use of historical data, year by year, allowed to identify that the impacts of climate change on water availability will be even worse than predicted by the studies which took into account only normal average data.
5. REFERENCES
COMPANHIA NACIONAL DE ABASTECIMENTO – CONAB. Acompanhamento da safra brasileira: cana-de-açúcar, terceiro levantamento. Brasília, 2011. Disponível em: <http://www.conab.gov.br/OlalaCMS/uploads/arquivos/11_12_08_11_00_54_08.pdf>. Acesso em: 2 jan. 2012.
CRIMMINS, S. M.; DOBROWSKI, S. Z.; GREENBERG, J. A.; ABATZOGLOU, J. T.; MYNSBERGE, A. R. Changes in climatic water balance drive downhill shifts in plant species´ optimum elevations. Science, v. 331, n. 6015, p. 324-327, 2011. http://dx.doi.org/10.1126/science.1199040
DESSAI, S.; VAN DER SLUIJS, J. Uncertainty and climate change adaptation - a scoping study. Utrecht: Copernicus Institute for Sustainable Development and Innovation, 2007. 95p.
FLETCHER, R. A.; NATH, V. Triadimefon reduces transpiration and increases yield in water stressed plants. Physiologia Plantarum, v. 62, n. 3, p. 422–426, 1984. http://dx.doi.org/10.1111/j.1399-3054.1984.tb04596.x
GOUVÊA, J. R. F.; SENTELHAS, P. C.; GAZZOLA, S. T.; SANTOS, M. C. Climate changes and technological advances: impacts on sugarcane productivity in tropical southern Brazil. Scientia Agricola, v. 66, n. 5, p. 593-605, 2009. http://dx.doi.org/10.1590/S0103-90162009000500003
HORIKOSHI, A. S.; FISCH, G. Balanço hídrico atual e simulações para cenários climáticos futuros no município de Taubaté, SP, Brasil. Revista Ambiente e Água, v. 2, n. 2, p. 33-46, 2007. http://dx.doi.org/10.4136/ambi-agua.26
IBARRA-MONTOYA, J. L.; ROMÁN, R.; GUTIÉRREZ, K.; GAXIOLA, J.; ARIAS, V.; BAUTISTA, M. Cambio em la cobertura y uso de suelo em el norte de Jalisco, México: um análisis del futuro, em um contexto de cambio climático. Revista Ambiente e Água, v. 6, n. 2, p. 111-128, 2011. http://dx.doi.org/10.4136/ambi-agua.189
INTERGOVERNMENTAL PANEL ON CLIMATE CHANGE - IPCC. Climate change 2007: the physical science basis. Summary for policymakers. Working Group I. Available in: <http://ipcc-wg1.ucar.edu/wg1Report/AR4WG1_Pub_SPM-v2.pdf>. Access in: 16 April 2009.
LI, Z.; LIU, W. Z.; ZHANG, X. C.; ZHENG, F. L. Assessing the site-specific impacts of climate change on hydrology, soil erosion and crop yields in the Loess Plateau of China. Climate Change, v. 105, n. 1/2, p. 223-242, 2011. http://dx.doi.org/10.1007/s10584-010-9875-9
LIBERATO, A. M. L.; BRITO, J. I. B. Influência de mudanças climáticas no balanço hídrico da Amazônia Ocidental. Revista Brasileira de Geografia Física, v. 3, p. 170-180, 2010.
MARENGO, J. A. Água e mudanças climáticas. Estudos Avançados, v. 22, n. 63, p. 83-96, 2008. http://dx.doi.org/10.1590/S0103-40142008000200006
MARKS, D.; KING, G. A.; DOLPH, J. Implications of climate change for water balance of the Columbia river basin, USA. Climate Research, v. 2, p. 203-213, 1993.
MONTEIRO, L. A. Modelagem agrometeorológica como base para a definição de ambientes de produção para a cultura da cana-de-açúcar no Estado de São Paulo. 2012. 118f. Dissertação (Mestrado em Física do Ambiente Agrícola) – Escola Superior
de Agricultura “Luiz de Queiroz”, Universidade de São Paulo, Piracicaba, 2012.
PEDRO JÚNIOR, M. J.; MELLO, M. H. A.; ORTOLANI, A. A.; ALFONSI, R. R.; SENTELHAS, P. C. Estimativa das temperaturas médias mensais das máximas e das mínimas para o Estado de São Paulo. Campinas: Instituto Agronômico, 1991. 11p. (Boletim Técnico, 142).
PEREIRA, A. R.; ANGELOCCI, L. R.; SENTELHAS, P. C. Agrometeorologia: fundamentos e aplicações práticas. Guaíba: Agropecuária, 2002. 478 p.
PÉREZ, S.; SIERRA, E. Changes in rainfall patterns in the eastern area of La Pampa province, Argentina. Revista Ambiente e Água, v.7, n.1, p.24-35, 2012.
PRADO, H.; PÁDUA JUNIOR, A. L.; GARCIA, J. C.; MORAES, J. F. L.; CARVALHO, J. P.; DONZELI, P. L. Solos e ambientes de produção. In: DINARDO-MIRANDA, L. L. de; VASCONCELOS, A.C.M.; LANDELL, M.G.A. (Ed.). Cana-de-açúcar. Campinas: Instituto Agronômico, 2008. cap. 7, p. 179-204.
ROLIM, G. S.; SENTELHAS, P. C.; BARBIERI, V. Planilha no ambiente Excel™ para os cálculos de balanços hídricos: normal, seqüencial, de cultura e de produtividade real e potencial. Revista Brasileira de Agrometeorologia, v. 6, n. 1, p.133-137, 1998.
TERAMOTO, E. R. Avaliação e aplicação de modelos de estimativa de produção de cana-de-açúcar (Saccharum spp) baseados em parâmetros do solo e do clima. 2003. 86f. Tese (Doutorado em Agronomia) – Escola Superior de Agricultura “Luiz de Queiroz”,
Universidade de São Paulo, Piracicaba, 2003.
THORNTHWAITE, C. W.; MATHER, J. R. The water balance. New Jersey: Drexel Institute of Tecnology, 1955. 104p.
THORNTHWAITE, C. W. An approach toward a rational classification of climate. Geographical Review, Centeron, v. 38, n. 1, p. 55-94, 1948.
VILLANI, G.; TOMEI, F.; TOMOZEIU, R.; MARLETTO, V. Climatic scenarios and their impacts on irrigated agriculture in Emilia-Romagna, Italy. Italian Journal of Agrometeorology, v. 16, n. 1, p. 5-16, 2011.