ABSTRACT: Perception of color and its relationship to water holding capacity are important for defining the yield and quality of the pork production process. The aim of this study was to identify the relationship among color measurements taken at various anatomical positions in the cross-sectional surface of pork loin steak, and measurements of fluid exudation and its glucose concentration, as well as the impact on these attributes due to plasma glucose at slaughter. Two assays were conducted sequentially: i) investigation of the surface color parameters at different anatomical positions in the pork loin cross-section and their relationship to general exudation; and ii) the effect of plasma glucose levels on surface color variables, drip loss and glucose exudate concentration in three anatomical regions in the steak. The L* value of the ventro-lateral region, in the first assay, had the highest correlation with average steak drip loss at all anatomi-cal points, exudation increasing proportionally between 48 and 72 h. The hue angle was also positively correlated with drip loss and lightness. The drip loss was greater when the animals had high plasma glucose, especially in the intermediate and lateral regions of the steak surface. The intermediate region presented greater lightness and lower redness. The plasma and glucose exudate concentrations, potential indicators of the muscle glycolytic metabolism, were related to color and drip loss. These variables can be influenced by the anatomical region inside the muscle, impacting the ability to retain water, two-toning occurrence and overall pork loin quality. Keywords: Longissimus dorsi, color, glycolytic metabolism, quality
Received September 03, 2013 Accepted February 27, 2014
University of São Paulo/ESALQ – Dept. of Animal Science, Av. Pádua Dias 11 – 13418-900 – Piracicaba, São Paulo – Brazil.
*Corresponding author <[email protected]>
Edited by: Concepta Margaret McManus Pimentel
Pork loin two-toning and drip loss in relation to steak cross-section anatomical
Patricia Maloso Ramos, Eduardo Francisquine Delgado*
position, plasma and exudate glucose
Introduction
Two toning and paleness represent yield losses to the pork industry. These problems were diagnosed in the United States and paleness occurred in 10.2 %, while two-toned loin appeared in 12.7 % of the samples (Cannon et al., 1996). While the pale, soft and exudative (PSE) meat is still an issue (Hammel-man et al., 2003) the two-toned meat, that refers to the
idea that the Longissimus dorsi muscle is susceptible
to inconsistency in surface color at different anatomi-cal positions, has been explored less in the literature. The existence of relationships between oxidative and glycolytic fibers at certain anatomical positions in the loin cross-sectional surface is related to myogenesis. Distance between the conglomerates of oxidative fi-bers is not random (Fonseca et al., 2003) and may determine the proportional participation of different fiber types.
The muscle glycolytic potential represented by glycogen, glucose -6- phosphate, glucose and lactate has an impact on natural acidification during muscle to meat transformation, where higher glycolytic potential is associated with lower quality of pork loin (Monin and Sellier, 1985). The muscle or muscle region with greater contribution of glycolytic fibers has higher glycolytic potential which makes them prone to developing pale and exudative meat (Hamilton et al., 2003). Plasma glu-cose at slaughter is also related to lower pH, paleness and lower water holding capacity which is associated
with higher occurrence of glycolytic fibers (Choe et al., 2009).
Pork loin steak can have surface color and water holding capacity problems. Pale, soft and exudative or normal color (Reddish-pink), soft and exudative (RSE) are two common occurrences in pork (Warner et al., 1997). One possible way to indirectly and easily predict water holding capacity problems associated with visual color appraisal is to analyse surface color parameter readings. Some of the color parameters represented by lightness (L*), redness (a*), yellowness (b*) and the com-position of these parameters in terms of hue angle and chroma are highly correlated with the visual perception of pink intensity (Brewer et al., 2001) and are linked to excessive water losses (Mancini and Hunt, 2005). The aim of this study was to verify the impact of plasma glu-cose at slaughter on various anatomical positions of pork loin steaks, color and drip losses.
Materials and Methods
Assay 1
Samples: nineteen randomly selected pork loin samples with a thickness of 2.5 cm, taken from between the
eighth and eleventh ribs, obtained 24-36 h post-mortem
from right carcasses were acquired at a retail store. The steaks were refrigerated and transported to a meat labo-ratory for analysis.
Color measurements: the objective measures of color followed the CIELab standards as represented by L* (lightness), a* (redness) and b* (yellowness) at different points at steak surface (Figure 1) using a colorimeter (Mi-nolta CR 400) with 0.8 cm aperture, calibrated for
illumi-nant C and a 2 o angle. The time lapse to reading was
be-tween 1 and 2 h after steak exposure to oxygen at room
temperature of 21oC. The values for Chroma (C) and
Hue angle (H) (Brewer et al., 2001) were calculated
ac-cording to the following formula: C=√((a*)2+(b*)2) and
H = arctangent(b*/a*), respectively. For those samples that had shown non-uniform colorimeter readings in the
Longissimus thoracis positions within the cross sectional surface were called two-toning steaks, even though the two toning term is mainly related to color differences between muscles within a cut.
Exudate absorption by filter paper: filter paper cylin-ders with a diameter of 2.5 cm were positioned at close contact to the steak surface at the medial position (Kauff-man et al., 1998) to measure the fluid exudation. After 20 min or until one of them was completely impregnated with absorbed liquid, the cylinders were taken off in the same order that they were put on each steak. The results are expressed in differences between the filter paper weight before and after exudate absorption.
Drip loss: measured for each standardized steak (100 g, without fat and/or connective tissue) that was placed on
a reticulated plastic netinside a plastic package
(Honi-kel and Hamm, 1994). This material was kept under
re-frigeration at 4 oC with no contact between exudate and
the meat sample. The weight 48 and 72 h after color parameter readings was determined in order to obtain the percentage weight losses. The weighing at 72 h was taken using the same sample.
Statistical analysis: the experimental design was
com-pletely randomized and the model was: Yij=µ+Pi+eij,
where Yij is the jth observation at the ith position; µ the
overall average; Pi the effect of position i and eij the
ex-perimental error. The analysis of variance was done using PROC GLM in SAS (Statistics Analysis Systems Institute,
version 9.2) and when significant (p < 0.05) the adjusted
means were compared by Tukey test (a < 0.05).The
oc-currence of lightness groups within each region was de-termined using PROC FORMAT and PROC FREQ from SAS, like the PEARSON correlation for all parameters.
Assay 2
Animals: twenty five commercial lineage pigs (Sus scro-fa domesticus) from Pen Ar Lan genetics were used. The sampling was taken at the experimental abattoir that works under the State Inspection Service (SISP) regu-lated by Resolution n.24 (RAA 24; 01/08/1994) from the Brazilian Secretariat of Agriculture and Food Supply.
Plasma glycemia: blood samples were collected at slaughter when the animals were exsanguinated to de-termine plasma glycemia using a human blood glucose concentration checking device (Accu Chek®). Animals were divided into two groups based on blood glucose
levels: 12 animals with high levels, above 120 mg dL–1
(134.5 ± 5.3) and 13 with normal levels, below 80 mg
dL–1 (74.8 ± 2.0). These levels may be associated with
differences in the acidification of meat, producing im-pacts on color and drip loss (Choe et al., 2009).
Temperature: 2 h after slaughter the temperature of the carcasses was measured using a penetration thermom-eter.
Color: in assay 1 it was observed that color measures at several spots on the steak surface can be replaced by fewer measures at specific locations that are more highly correlated with drip loss. Therefore, for the second as-say only three regions were used to measure color: lat-eral, intermediate and medial. Pork loin samples from right carcasses, between tenth and eleventh ribs, with
2.5 cm thickness were collected 24 h post-mortem and
transferred to a meat laboratory for analysis. The color readings were made with the same calibrated device and standards from assay 1.
Exudate absorption by filter paper: the same proce-dure used in assay 1 was repeated in assay 2 with the
difference that in assay 2 the filters that were put in the same regions (3) where the colors were measured in-stead of one filter for each steak.
Drip loss: the traditional method (Honikel and Hamm, 1994) was adapted to three regions on the steak surface where colors were also read. Cylinders were taken off in each anatomical region, using a leaker, weighed and placed inside the reticulated net bag wrapped in plastic bags. After 48 h the volume of drip was weighed to de-termine losses in each region. Following 24 h, the same process in the same samples was carried out to deter-mine drip loss at 72 h.
Glucose exudate concentration: measured at the same time as drip loss determination at 48 h using a hu-man blood glucose concentration checking device (Ham-ilton et al., 2003).
Statistical analysis: the experimental design was completely randomized in a two (levels of plasma glycemia) × three (anatomical regions on steak) fac-torial arrangement with 12 replicates for high and 13 for normal glycemia. The statistical model was
Yijkl=µ+Gi+Rj+(G*R)ij+Tk+eijkl, where Yijk is the
ob-servation k at ith G (glycemia) level and jth R
(anatomi-cal region); µ is the overall average; Gi the effect from
G (glycemia) factor at ith level; R
j the effect from R
(re-gion) factor at jth level; (G*R)
ij the effect from
interac-tion between G factor at ith level and R factor at jth
level; T the effect from T (temperature) factor at kth
level (used as covariate in the statistical model); eijkl is
the experimental error. The variance analysis used the
PROC GLM from SAS. When showing significance (p <
0.05) the adjusted means were compared by the Tukey test (a < 0.05).
Results and Discussion
Assay 1: the study conducted with a reduced number of steaks (19) may account for the broad range for the average lightness (L*) values (44.05 to 55.58), with 21 % of the samples presenting readings above 50.79 which are above the threshold for pale and exudative pork (Warner et al., 1997). Furthermore, although 84 % could be classified as reddish-pink pork with L* readings be-tween 42.00 and 50.00, there was also an indication that some of the samples within this color category might be classified as soft and exudative (RSE) when drip loss is taken into account (Figure 2). The occurrence of soft and exudative pork is well above 10 %, which would be expected in the industry. However, the sampling was random and greater sampling is needed to confirm this heterogeneity and high occurrence for pork with light-ness problems.
The objective measures of color can be taken at many points on the steak surface. More readings combined with better choice of anatomical locations
for these readings give a greater representativeness of the entire steak color (Mancini and Hunt, 2005). For this study, the correlations between the L* values av-eraged from readings at all anatomical positions and steak drip loss had lower coefficients as compared to correlations that use L* values taken at certain posi-tions (Table 1).
The L* averaged from readings at positions 5 and 6 (Figure 1) had the highest positive correlation coeffi-cient with L* values mean and median obtained from readings at all positions on steak (Figure 3). The mean L* value obtained from readings at those same two po-sitions had the highest determination coefficients with
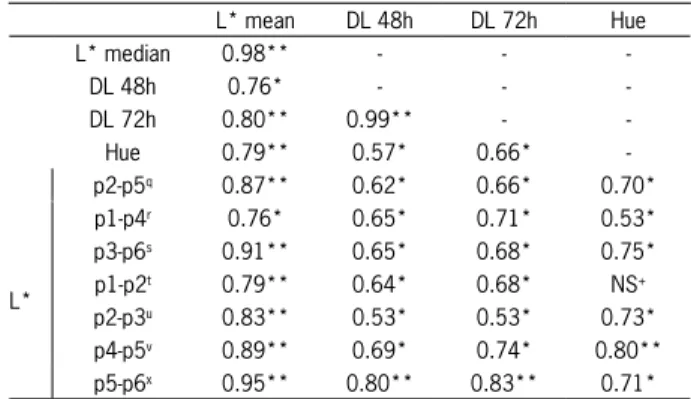
Table 1 – Correlations† between objective measures of lightness (L*) mean in regions of the steak, drip loss (DL) and hue angle (Hue) in pork loin from a retail store.
L* mean DL 48h DL 72h Hue
L* median 0.98** - -
-DL 48h 0.76* - -
-DL 72h 0.80** 0.99** -
-Hue 0.79** 0.57* 0.66*
-p2-p5q 0.87** 0.62* 0.66* 0.70*
L*
p1-p4r 0.76* 0.65* 0.71* 0.53* p3-p6s 0.91** 0.65* 0.68* 0.75* p1-p2t 0.79** 0.64* 0.68* NS+ p2-p3u 0.83** 0.53* 0.53* 0.73* p4-p5v 0.89** 0.69* 0.74* 0.80** p5-p6x 0.95** 0.80** 0.83** 0.71*
†Significant *p < 0.05 and **p < 0.001; +NS: not significant (p > 0.05); lightness average of regions qp2-p5: 2 and 5 positions; rp1-p4: 1 and 4 positions; sp3-p6: 3 and 6 positions; tp1-p2: 1 and 2 positions; up2-up3: 2 and 3 positions; vp4-p5: 4 and 5 positions; xp5-p6: 5 and 6 positions.
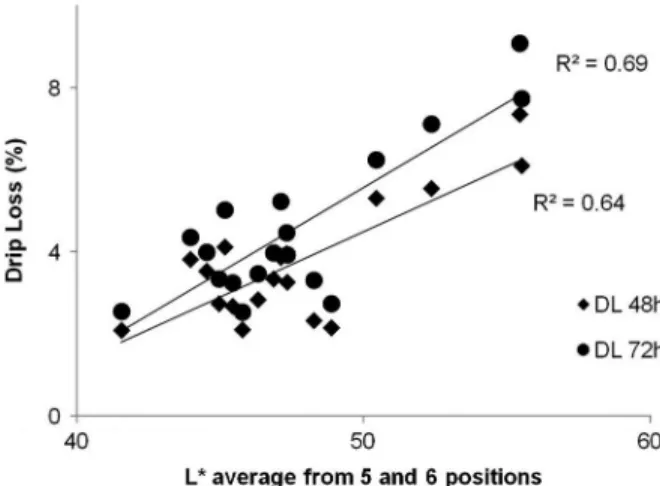
drip loss values in both 48 and 72 h determinations (Fig-ure 4). These correlation coefficients were among the highest when position 5 and 6 were involved in the average L* readings. The high L* readings in this re-gion represented by the two positions mentioned may be a result more closely related to exudation in pork loin. On the other hand, no differences were observed between the regions for average values for redness (a*) or yellowness (b*).
Hue angle mean was the other color variable with significant correlation coefficients with L* values read-ings and drip losses. Nonetheless, hue angles had lower correlation coefficients with drip losses at both times and with L* mean compared to the L* average with readings at regions represented by two positions that considered either position 5 or 6 (Table 1). The hue angle had the lowest or even no significant correlation coeffi-cients with L* readings when position 1 was included in the two position average.
The weaker correlations between hue angle and L* readings are variable in response to the positions where the readings were taken (Table 2). Again, the av-erage from position 5 and 6 had the highest correlation coefficients with L* mean and drip losses. For some of the composed positions (two readings average) there was no significant correlation between hue angle and drip loss, especially for average readings where position 1 was included.
The highest positive correlation between L* read-ings and hue angle averaged from positions 5 and 6 readings, as well as between those readings and the drip loss indicates that this location was lighter, less red and more yellow with increased drip loss. The behavior of L* and hue angle changes had differences according to positions. This may be responsible for some visual non uniform color intensity, which will be called two ton-ing. The visual pink color intensity is high and nega-tively correlated with L* and the hue angle (Brewer et al., 2001).
Chroma parameter and exudate absorption by fil-ter paper was not related to drip losses either in fil-terms of time or regions. High positive correlation between drip losses at different hours shows that at 48 hours it is possible to predict the losses that will occur at 72 h (Figure 5). Although there was no difference for deter-mined color variables at several positions (Table 3), the frequency for high lightness values occurrence observed in the average from positions 5 and 6 fits the frequency for pale and exudative meat (Table 4). Therefore, even though there was lower occurrence for higher L* val-ues in the ventro-lateral region for this study, when it happened it was associated with higher drip losses. On the other hand, when higher L* values appear in other anatomical positions, like in dorso-medial, this associa-tion is not seen.
Partial considerations: Lightness (L*) reading in the ventro-lateral region (average from positions 5 and 6 readings) of pork loin reflects the L* mean values from all positions in steak surface. The drip losses at different times persist in steady steps up to 72 h, and can be
esti-Figure 3 − Correlation between L* overall average and the L* average in positions 5 and 6 of steak loin sampled in a retail store.
Figure 4 − Correlations between L* average from 5 and 6 positions on the surface of pork loin with drip loss at 48 and 72 h from steaks sampled in a retail store.
Table 2 – Correlations† between hue angle (Hue) in regions of the steak, lightness mean (L*) and drip loss (DL) at 48 and 72 h in the pork loin from a retail store.
L* mean DL 48h DL 72h
Hue
p2-p5q 0.66* 0.52* 0.57*
p1-p4 r 0.51* NS+ 0.56*
p3-p6 s 0.71** 0.47* NS
p1-p2 t 0.48* NS 0.48*
p2-p3 u 0.56* NS NS
p4-p5 v 0.55* NS 0.55*
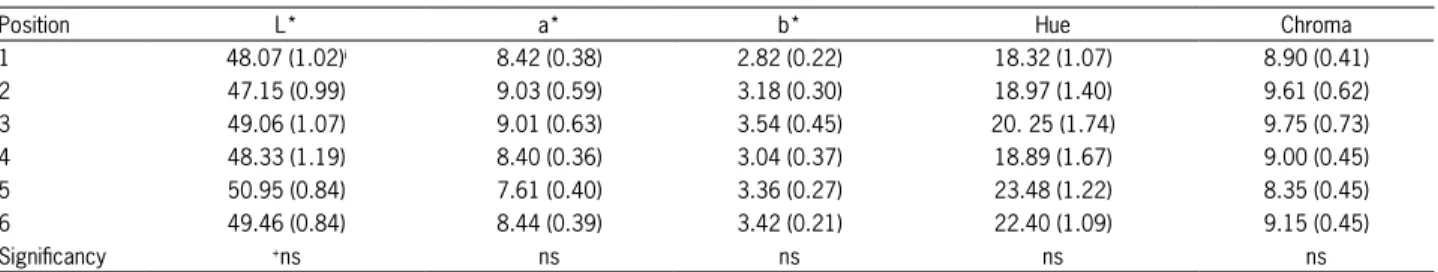
Table 3 – Lightness (L*), redness (a*), yellowness (b*), Hue angle and Chroma in anatomical position of the pork loin steaks from a retail store.
Position L* a* b* Hue Chroma
1 48.07 (1.02)i 8.42 (0.38) 2.82 (0.22) 18.32 (1.07) 8.90 (0.41)
2 47.15 (0.99) 9.03 (0.59) 3.18 (0.30) 18.97 (1.40) 9.61 (0.62)
3 49.06 (1.07) 9.01 (0.63) 3.54 (0.45) 20. 25 (1.74) 9.75 (0.73)
4 48.33 (1.19) 8.40 (0.36) 3.04 (0.37) 18.89 (1.67) 9.00 (0.45)
5 50.95 (0.84) 7.61 (0.40) 3.36 (0.27) 23.48 (1.22) 8.35 (0.45)
6 49.46 (0.84) 8.44 (0.39) 3.42 (0.21) 22.40 (1.09) 9.15 (0.45)
Significancy +ns ns ns ns ns
ivalues in parentheses: standard error; +ns: not significant (p > 0.05).
Figure 5 – Correlation between drip loss at 48 and 72 h of pork loin steaks sampled in a retail store.
Table 4 – Count and frequency of lightness (L*) ranges within regions in pork loin steaks from a retail store.
L* p2-p5qp1-p4rp3-p6sp1-p2tp2-p3up4-p5vp5-p6x
>50 Count 8 7 5 9 10 5 4
Frequency (%) 42.11 36.84 26.32 47.37 52.63 26.32 22.22
42-50Count 11 12 14 10 9 14 14
Frequency (%) 57.89 63.16 73.68 52.63 47.37 73.68 77.78 Lightness values averaged at regions qp2-P5: positions 2 and 5; rp1-p4: positions 1 and 4; sp3-P6: positions 3 and 6; tp1-p2: positions 1 and 2; up2-p3: positions 2 and 3; vp4-p5: positions 4 and 5; xp5-p6: positions 5 and 6.
mated for L* mean, median and ventro-lateral readings. Chroma and exudate absorption by filter paper were not correlated with drip losses. The regions in the same steak had potentially different color and drip loss even under the same cooling conditions.
Assay 2: no interaction was observed between glycemia and anatomical regions in steak pork loin. The pH
val-ues measure at 24 h post-mortem for the high glycemic
group and for the normal one were: 5.55 ± 0.04 vs 5.65 ± 0.03, respectively. The drip losses at 48 h were
differ-ent (p < 0.01) between the groups of high and normal
plasma glucose, with higher losses observed for the for-mer group as compared to the latter (9.0 ± 0.4 vs 8.0 ±
0.4 g 100 g–1, respectively).
The evaluation for drip loss at 72 h also showed
differences (p < 0.05) between the glycemic groups,
and it corroborates the results from assay 1 for steady
step behavior between 48 and 72 h. The group that had greater plasma glucose continued to present higher loss-es compared with normal plasma glucose (12.0 ± 1.0 vs
11.0 ± 1.0 g 100 g–1).
The results for pH and drip losses could classify both groups into PSE or RSE categories, according to the Warner et al. (1997) classification, for showing pH values lower than 6 and drip losses above 5 %. The inadequate cooling condition from the technical point of view, with carcasses exposed to ambient temperature for 4 h after slaughter caused greater losses of water. Temperature
was a significant factor (p < 0.05) in determining drip
loss, L* parameters and glucose exudate concentration. The high glycemic group had an average temperature
at 2 h of 29.75 ± 0.93 oC versus 28.08 ± 0.89 oC for
the normal glycemic group. The adequate temperature fall through accelerated chilling for pig carcasses is a technique that can be used to improve pork loin quality, by acting to reduce drip losses (Springer et al., 2003). Nonetheless, this conditioning may have provided the right stage for favoring different drip losses between the groups. These differences in drip losses, in modest amounts, were reported before only with much greater plasma glucose differences and an extremely high plas-ma glucose concentration (Choe et al., 2009).
The high drip losses and differences in surface col-or were associated with low pH values observed, as ex-pected. These results corroborate the idea of the condi-tioning being determinant to that observed association, since the lowest pH values were linked to the highest drip losses, with higher correlation until 180 min after slaughter (Kapper et al., 2014). While this association be-tween pH and drip losses was previously considered as being related only to high initial levels of glycogen (Ben-dall and Swatland, 1988), the complex properties of the muscle metabolism, including the mitochondrial contri-bution, may be more related to the pH decline process than the glycogen content alone (Scheffler et al., 2013). The changing in steak color surface at different anatomi-cal positions may contribute to explaining the properties that will define meat color and water holding capacity.
The drip losses were also different (p < 0.05) at
lateral regions was not different (p = 0.54) as well as the
lateral and medial regions (p = 0.21). Drip loss at 72 h
was not different (p ≥0.07) among regions (Table 5).
The exudate absorption by filter paper differ (p
< 0.01) between the glycemic groups, being greater for high plasma glucose animals than for the normal
glyce-mic pigs (4.0 ± 0.5; 2.0 ± 0.3 g 100 g–1; respectively).
There were no differences for exudate absorption by fil-ter paper among steak surface regions (Table 5). Exudate
glucose concentration did not differ (p = 0.39) between
the high and normal glycemic groups. These results do not corroborate with a direct impact of plasma glucose availability on glucose exudate concentration by modi-fication of the muscle glycolytic potential, which is due to the glucose, glycogen and lactate content (Monin and Sellier, 1985). High and positive correlation between
glu-cose exudate concentration and glycolytic potential
post-mortem has been reported, which in turn was negatively correlated with meat quality (Hamilton et al., 2003).
On the other hand, glucose exudate
concentra-tion was different among regions (p < 0.05). The lateral
region presented greater glucose exudate concentration than the medial (290.92 ± 20.93 vs 207.09 ± 21.44 mg
dL–1, respectively), but was not different (p = 0.71) from
the intermediate (265.46 ± 21.27 mg dL–1). The latter
had the same glucose concentration observed in the
me-dial region (p = 0.15).
Color variables were not different among plasma glucose groups, but differences among regions were found. The L* values in the intermediate region from the high glycemic group are higher than those at the me-dial region from the normal glycemic group (Table 6). When the lateral and medial regions were compared, the
lightness was not different (p = 0.30). For similar
glyce-mic levels (135 vs 88 mg dL–1) no differences were found
between lightness and muscle fiber area composition
for type IIb, while higher glycemic level (231 mg dL–1)
showed greater values for these characteristics (Choe et al., 2009).
Lightness and exudate absorption by filter paper points to a marked effect of glycemic level on the sur-face steak region color and exudation. The greater drip loss associated with high L* readings for the
intermedi-ate region from high glycemic level may be a reflection of different glycolytic potential dictated by a fiber pro-file, which differs in its ability to store glycogen after acute stress. The fast-twitch white type of muscle rap-idly stores glycogen from lactate after exercise (McLane and Holloszy, 1978). Moreover, those fibers have higher glycogen concentration after rest and they are metaboli-cally better equipped for anaerobic glycogen utilization and faster glycolysis than slow twitch type I fibers (Klont et al., 1998). On the other hand, slow twitch fibers are better equipped to respond to insulin (Song et al., 1999) in order to increase glucose uptake and disposal result-ing in glycogen synthesis at higher rates (James et al., 1985), and are, hence, candidates that can alter the gly-colytic potential. These differential responses related to fiber type profile may be the reason for the impor-tance of the distribution of glycogen within the muscle and not overall concentration from muscle in defining meat quality (Hambrecht et al., 2005). Also recent re-view suggests that mitochondria, besides differences in content between fibers types, play an important role in the extent of pH decline, with ultrastructural changes observed in PSE (Hudson, 2012).
The a* value in the intermediate region (6.68 ±
0.25) was lower (p < 0.02) than those observed for
medi-al (7.68 ± 0.24) and latermedi-al (7.69 ± 0.27) regions. Those differences were associated with differences between the intermediate region of the high glycemic group and lateral/medial regions of the normal group (Table 6).
Although the results for L* and a* were similar for both plasma glucose groups, they showed different behavior within anatomical regions and their relation-ship with water holding capacity and glucose exudate concentration. The intermediate region contributes neg-atively to the overall perception of color, because both L* (higher) and a* (lower) values corroborate this visual paleness typical for PSE pork. When greater lightness values associates with decreased redness (a*) there is a perception of pale and lighter areas on the pork loin surface (Hammelman et al., 2003). Furthermore, visual redness has high positive correlation to a* values (Zhu and Brewer, 1999). On the other hand, there was no sig-nificant correlation between a* value and visual pink
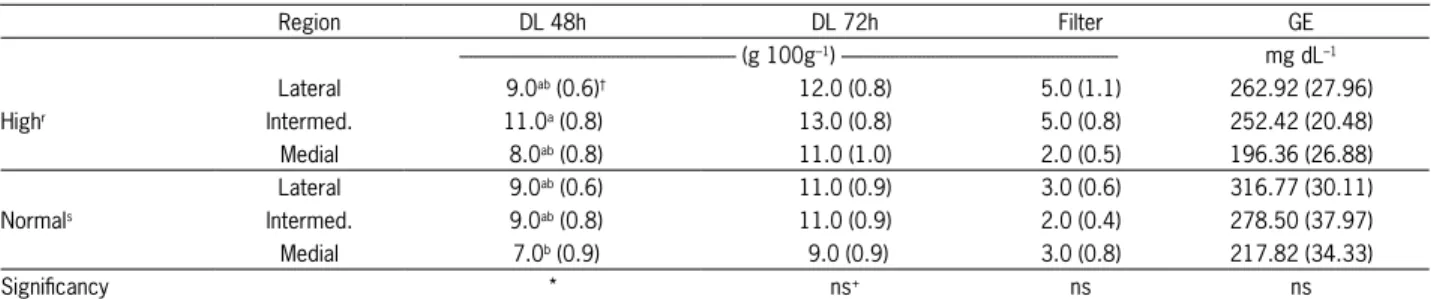
Table 5 – Drip losses (DL), exudate absorbed by filter paper (Filter) and exudate glucose concentration (GE) according to three anatomical regions evaluated on same steak pork loin into two groups of plasma glucose at slaughter in an experimental abattoir.
Region DL 48h DL 72h Filter GE
--- (g 100g–1) --- mg dL–1 Lateral 9.0ab (0.6)† 12.0 (0.8) 5.0 (1.1) 262.92 (27.96)
Highr Intermed. 11.0a (0.8) 13.0 (0.8) 5.0 (0.8) 252.42 (20.48)
Medial 8.0ab (0.8) 11.0 (1.0) 2.0 (0.5) 196.36 (26.88) Lateral 9.0ab (0.6) 11.0 (0.9) 3.0 (0.6) 316.77 (30.11)
Normals Intermed. 9.0ab (0.8) 11.0 (0.9) 2.0 (0.4) 278.50 (37.97)
Medial 7.0b (0.9) 9.0 (0.9) 3.0 (0.8) 217.82 (34.33)
Significancy * ns+ ns ns
color intensity when color was measured in pork loin using the Minolta illuminant C settings (Brewer et al., 2001). The b* (3.47 ± 0.48), Hue angle (24.62 ± 2.25) and Chroma (8.17 ± 0.51) were not different among ei-ther groups or regions (Table 6).
Partial considerations: High plasma glucose concen-tration at slaughter may contribute to increased drip loss. Paleness in intermediate region linked to non-uni-form pork loin color is associated with high drip loss and suggests differences in the glycolytic process among surface regions. The higher glucose exudate concentra-tion in the intermediate and lateral regions corroborates with this hypothesis.
Conclusions
The L* readings at the ventro-lateral region may potentially be the point at which excessive drip loss and paleness can be predicted. Those readings associ-ated with hue angle as compared to the dorso-medial position readings may help to identify two-toning pork loin. Animals with high plasma glucose concentration at slaughter are susceptible to problems with water holding capacity.
Acknowledgements
To National Research Council – CNPq (Brazilian National Council for Scientific and Technological Devel-opment) for the scholarship. To Dr. Saulo da Luz e Silva for assistance in the analytical procedures and Elso Car-los Terciotti for sample collection.
References
Bendall, J.R.; Swatland, H.J. 1988. A Review of the relationships of pH with physical aspects of pork quality. Meat Science 24: 85-126.
Brewer, M.S.; Zhu, L.G.; Bidner, B.; Meisinger, D.J.; McKeith, F.K. 2001. Measuring pork color: effects of bloom time, muscle, pH and relationship to instrumental parameters. Meat Science 57: 169-176.
Cannon, J.E.; Morgan, J.B.; McKeith, F.K.; Smith, G.C.; Sonka, S.; Heavner, J.; Meeker, D.L. 1996. Pork chain quality audit survey: quantification of pork quality characteristics. Journal of Muscle Foods 7: 29-44.
Choe, J.H.; Choi, Y.M.; Lee, S.H.; Nam, Y.J.; Jung, Y.C.; Park, H.C.; Kim, Y.Y.; Kim, B.C. 2009. The relation of blood glucose level to muscle fiber characteristics and pork quality traits. Meat Science 83: 62-67.
Fonseca, S.; Wilson, I.J.; Horgan, G.W.; Maltin, C.A. 2003. Slow fiber cluster pattern in pig longissimus thoracis muscle: Implication for myogenesis. Journal of Animal Science 81: 973-983.
Hambrecht, E.; Eissen, J.J.; Newman, D.J.; Smits, C.H.M.; Verstegen, M.W.A.; Den Hartog, L.A. 2005. Preslaughter handling effects on pork quality and glycolytic potential in two muscles differing in fiber type composition. Journal of Animal Science 83: 900-907. Hamilton, D.N.; Miller, K.D.; Ellis, M.; McKeith, F.K.; Wilson,
E.R. 2003. Relationships between longissimus glycolytic potential and swine growth performance, carcass traits, and pork quality. Journal of Animal Science 81: 2206-2212. Hammelman, J.E.; Bowker, B.C.; Grant, A.L.; Forrest, J.C.;
Schinckel, A.P.; Gerrard, D.E. 2003. Early postmortem electrical stimulation simulates PSE pork development. Meat Science 63: 69-77.
Honikel, K.O.; Hamm, R. 1994. Quality attributes and their measurement in meat, poultry and fish products. p. 125-159. In: Pearson, A.M.; Dutson, T.R., eds. Advances in meat research. Beltsville, MD, USA.
Hudson, N.J. 2012. Mitochondrial treason: a driver of pH decline rate in post-mortem muscle? Animal Production Science 52: 1107-1110.
James, D.E.; Jenkis, A.B.; Kraegen, E.W. 1985. Heterogeneity of insulin action in individual muscles in vivo: euglycemic clamp studies in rats. American Journal of Physiology-Endocrinology and Metabolism 248: E567-E574.
Kapper, C.; Walukonis, C.J.; Scheffler, T.I.; Scheffler, J.M.; Don, C.; Morgan, M.T.; Forrest, J.C.; Gerrard, D.E. 2014. Moisture absorption early postmortem predicts ultimate drip loss in fresh pork. Meat Science 96: 971-976.
Kauffman, R.G.; Van Laack, R.L.; Russel, R.L.; Pospiech, E.; Cornelius, C.A.; Suckow, C.E.; Greaser, M.L. 1998. Can pale, soft and exudative pork be prevented by postmortem sodium bicarbonate injection? Journal of Animal Science 76: 3010-3015.
Table 6 – Color variables L*, a*, b*, Hue angle and Chroma according to three anatomical regions evaluated on same steak pork loin into two groups of plasma glucose at slaughter in an experimental abattoir.
L*u a*v b*x Huew Chromaz
High#
Lateral 52.81ab (1.65)† 7.46 ab (0.35) 3.53 (0.48) 24.03 (2.25) 8.32 (0.51) Interm. 56.15a (1.20) 6.39 b (0.36) 3.32 (0.32) 26.95 (1.19) 7.22 (0.45) Medial 50.02 b (1.01) 7.44 ab (0.28) 2.97 (0.32) 21.20 (1.28) 8.03 (0.38)
Normal+
Lateral 52.81ab (1.05) 7.90a (0.40) 3.82 (0.33) 25.43 (1.10) 8.79 (0.49) Interm. 55.56ab (1.55) 6.95ab (0.35) 3.64 (0.35) 27.13 (1.62) 7.88 (0.44) Medial 51.81b (1.65) 7.91a (0.39) 3.47 (0.41) 22.83 (1.72) 8.69 (0.50)
Significancy ** * +ns ns ns
Klont, R.E.; Brocks, L.; Eikelenboom, G. 1998. Muscle fibre type and meat quality. Meat Science 49: S 219-S229.
Mancini, R.A.; Hunt, M.C. 2005. Current research in meat color. Meat Science 71: 100-121.
McLane, J.A.; Holloszy, J.O. 1979. Glycogen synthesis from lactate in three types of skeletal muscle. Journal of Biological Chemistry 254: 6548-6553.
Monin, G.; Sellier, P. 1985. Pork of low technological quality with a normal rate of muscle pH fall in the immediate post-mortem period: the case of the Hampshire breed. Meat Science 13: 49-63.
Scheffler, T.I.; Scheffler, J.M.; Kasten, S.C.; Sosnick, A.A.; Gerrard, D.E. 2013. High glycolytic potential does not predict low ultimate pH in pork. Meat Science 95: 85-91.
Song, X.M.; Ryder, J.W.; Kawano, Y.; Chibalin, A.V.; Krook, A.; Zierath, J.R. 1999. Muscle fiber type specificity in insulin signal transduction. American Journal of Physiology-Regulatory Integrative and Comparative Physiology 277: R1690-R1696. Springer, M.P.; Carr, M.A.; Ramsey, C.B.; Miller, M.F. 2003.
Accelerated chilling of carcasses to improve pork quality. Journal of Animal Science 81: 1464-1472.
Warner, R.D.; Kauffman, R.G.; Greaser, M.L. 1997. Muscle protein changes post mortem in relation to pork quality traits. Meat Science 45: 339-352.