Vagotomy ameliorates islet
morphofunction and body metabolic
homeostasis in MSG-obese rats
C. Lubaczeuski
1, S.L. Balbo
1, R.A. Ribeiro
2, J.F. Vettorazzi
3, J.C. Santos-Silva
3,
E.M. Carneiro
3and M.L. Bonfleur
1 1Laborato´rio de Fisiologia Endo´crina e Metabolismo, Centro de Cieˆncias Biolo´gicas e da Sau´de, Universidade Estadual do Oeste do Parana´, Cascavel, PR, Brasil
2
Universidade Federal do Rio de Janeiro, Macae´, RJ, Brasil 3
Laborato´rio de Paˆncreas Endo´crino e Metabolismo, Departamento de Biologia Estrutural e Funcional, Instituto de Biologia, Universidade Estadual de Campinas, Campinas, SP, Brasil
Abstract
The parasympathetic nervous system is important for b-cell secretion and mass regulation. Here, we characterized involvement of the vagus nerve in pancreaticb-cell morphofunctional regulation and body nutrient homeostasis in 90-day-old monosodium glutamate (MSG)-obese rats. Male newborn Wistar rats received MSG (4 g/kg body weight) or saline [control (CTL) group] during the first 5 days of life. At 30 days of age, both groups of rats were submitted to sham-surgery (CTL and MSG groups) or subdiaphragmatic vagotomy (Cvag and Mvag groups). The 90-day-old MSG rats presented obesity, hyperinsulinemia, insulin resistance, and hypertriglyceridemia. Their pancreatic islets hypersecreted insulin in response to glucose but did not increase insulin release upon carbachol (Cch) stimulus, despite a higher intracellular Ca2++mobilization. Furthermore, while the pancreas weight was 34% lower in MSG rats, no alteration in islet andb-cell mass was observed. However, in the MSG pancreas, increases of 51% and 55% were observed in the total islet andb-cell area/pancreas section, respectively. Also, theb-cell number perb-cell area was 19% higher in MSG rat pancreas than in CTL pancreas. Vagotomy prevented obesity, reducing 25% of body fat stores and ameliorated glucose homeostasis in Mvag rats. Mvag islets demonstrated partially reduced insulin secretion in response to 11.1 mM glucose and presented normalization of Cch-induced Ca2++mobilization and insulin release. All morphometric parameters were similar among Mvag and CTL rat pancreases. Therefore, the higher insulin release in MSG rats was associated with greaterb-cell/islet numbers and not due to hypertrophy. Vagotomy improved whole body nutrient homeostasis and endocrine pancreatic morphofunction in Mvag rats.
Key words:b-Cell; Obesity; Parasympathetic nervous system
Introduction
Central and peripheral mechanisms are involved in the regulation of body glucose homeostasis (1). Insulin and glu-cagon secretion are directly controlled by peripheral glucose levels and by the central nervous system (CNS) through the autonomic nervous system (ANS) (2). Pancreatic islets are innervated by vagal cholinergic nerves and sympathetic fibers (3). The parasympathetic nervous system (PNS) potentiates insulin secretion by the acetylcholine muscarinic 3 (M3) receptor, which activates phospholipase C (PLC) that, in turn, produces the intracellular messengers inositol-1,4,5-triphosphate (IP3) and diacylglycerol (DAG) (2). In contrast, the sympathetic nervous system (SNS), which releases norepinephrine, predominantly decreases insulin secretion via thea2-adrenergic receptors (3).
Nutrients and hormones also contribute to pancreatic
b-cell mass steady state, and the PNS has been found to be involved in b-cell mass regulation under normal and pathological conditions (4-9). While the mechanism of action of the PNS upon endocrine pancreatic mass regulation is not completely understood, there is some evidence to demonstrate that, in obesity, increased vagal action may lead to a vicious cycle that increases fat storage and disrupts body energy homeostasis (10,11).
Early postnatal administration of monosodium gluta-mate (MSG) in rodents produces neuronal necrosis in the arcuate nuclei of the hypothalamus and median eminence, which leads to development of obesity during adulthood (12). MSG-induced obesity is characterized by hypo- or
Correspondence: M.L. Bonfleur:,mlbonfleur@hotmail.com..
normophagy (13), higher fat deposition, glucose intoler-ance, hyperinsulinemia, and insulin resistance (14). Furthermore, pancreatic islets from MSG-obese rodents secrete more insulin in response to glucose (15-17) but present a diminished secretory function in response to cholinergic stimulus (15,18). This effect is partly associated with an alteration in ANS action, with a reduction in sympathetic function, but enhanced PNS activity (10). We previously demonstrated that subdiaphragmatic vagotomy in MSG rats prevented obesity, glucose intolerance, and pancreatic islet hypersecretion in response to glucose (14,16), supporting the hypothesis that PNS action is involved in pancreatic islet hyperfunction and related comorbidities in MSG rodents. However, the mechanism of action involved in such a process is unknown. Here, once again using subdiaphragmatic vagal denervation, performed at 30 days of age, we investigated whether the vagus nerve is involved in endocrine pancreatic morphofunctional alterations that lead to hyperinsulinemia and body nutrient homeostasis disruption in 90-day-old MSG-obese rats.
Material and Methods
Induction of experimental obesity in rats
All experiments were approved by the Universidade Estadual do Oeste do Parana´ (UNIOESTE) Committee on Ethics in Animal Experimentation (Certificate#00812). Male newborn Wistar rats received a subcutaneous injection of MSG [4 g/kg body weight (BW); MSG group], or saline (1.25 g/kg BW; CTL group) during the first 5 days of life. Pups were weaned on the 21st day of life and had free access to standard rodent chow (Biobase, Brazil) and water. The rats were housed in standard cages and maintained on a 12:12-h light-dark cycle (lights on from 6:00 a.m. to 6:00 p.m.) under controlled temperature (22±16C).
Vagotomy
At 30 days of age, MSG and CTL rats, after 12 h of fasting, were anesthetized with a mixture of 90 mg/kg
ip ketamine (Vetbrands, Brazil) and 9 mg/kg ip xylazine (Vetbrands). Half of the rats were submitted to subdia-phragmatic truncal vagotomy. The stomach and esopha-gus were exteriorized from the peritoneal cavity and humidified with saline. The common hepatic branch of the ventral vagal trunk, the accessory celiac and gastric branches of the ventral vagal trunk, and the dorsal vagal trunk were cut (denoted as Mvag and Cvag groups) (19). In sham-vagotomized rats (denoted as MSG and CTL groups), the vagus nerve was separated from the esophagus, but was not cut. At the end of the experimental period (2 months later), stomach food retention from each group was evaluated by the stomach weight per BW ratio to confirm subdiaphragmatic vagal denervation (5,14).
Obesity and general nutritional parameters
Body weight and food intake were measured during
the experimental period (from the 30th to 90th day of life). Food intake is reported as feed efficiency (food intake/BW gain). At 90 days of age, both rat groups, after 12 h of fasting, were weighed, and the nasoanal length was measured to calculate the Lee index. Rats were then killed by decapitation, and the retroperitoneal and perigonadal fat pads were removed and weighed. Blood was collected and serum was stored at ––206C for insulin measurement by radioimmunoassay (RIA). Total cholesterol (CHOL) and triglycerides (TG) were measured using standard commercial kits, according to the manufacturers’ instructions (Merck, Germany; and Boehringer, Germany, respectively).
Intraperitoneal glucose tolerance test (ipGTT)
At the end of the experimental period, rats from all groups were deprived of food for 8 h, and glycemia (time 0) was measured using a glucose analyzer (Abbott, Optium Xceed, USA). Subsequently, the rats received anipinjection of 2 g/kg BW glucose, and blood samples were collected at 15, 30, 60 and 120 min. Additional blood samples were collected at 0 and 30 min of the test for insulin measurement by RIA.
Body insulin sensitivity
Tissue insulin sensitivity was also evaluated using the homeostasis model assessment (HOMA) index of insulin resistance [(HOMA-IR) = fasting insulin (1 U/mL)6fasting
glucose (mM)/22.5]. For glucose disappearance rate (KITT)
evaluation, fasted rats were injectedipwith 1 U/kg BW of human insulin (Humulin R, Lilly, USA). Blood was taken before insulin injection (time 0) and after 4, 8, 12, 16 and 20 min for glucose analysis. The KITT was calculated as
0.693/t1/2.
Lipids, TG, and CHOL content in the liver
Liver lipids were extracted by Folch’s method. The ex-tract was evaporated and weighed by a gravimetric method for total fat content measurement. Lipids were then diluted in isopropanol for determination of the TG and CHOL content in the liver using enzymatic colorimetric methods, according to the manufacturer’s instructions (Laborclin, Bioliquid, Brazil).
Islet isolation, static insulin secretion, and total islet insulin content
Islets were isolated by collagenase (Sigma-Aldrich Chemicals, USA) digestion of the exocrine pancreas and then selection under a microscope to exclude any contam-inating tissues. For static incubations, groups of four islets were preincubated for 30 min at 376C with 0.5 mL Krebs-bicarbonate (KBR) buffer with the following composition: 115 mM NaCl, 5 mM KCl, 2.56 mM CaCl2, 1 mM MgCl2,
10 mM NaHCO3, 15 mM HEPES, supplemented with
5.6 mM glucose, 3 g bovine serum albumin (BSA) per liter, and equilibrated with a mixture of 95% O2-5% CO2 to
buffer (1 mL), and the islets were incubated for 1 h with 2.8, 11.1 or 16.7 mM glucose. In another series of experiments, islets were incubated with 11.1 mM glucose without or with 100mM carbachol (Cch). At the end of the incubation
period, the supernatants were collected and maintained at –206C. For islet insulin content, groups of four islets were collected and transferred to tubes containing 1 mL deio-nized water, and the islet cells were homogedeio-nized using a sonicator (Brinkmann Instruments, USA). The insulin was measured by RIA using human insulin radiolabelled with
125
I as tracer, rat insulin as standard (Crystal Chem Inc., USA), and rat insulin antibody (donated by Dr Leclerq-Meyer, Free University of Brussels, Belgium). The charcoal-dextran method was used to separate free insulin from antibody-bound125I insulin (20).
Cytoplasmic Ca2++oscillations
Fresh pancreatic islets were incubated with 5mM fura-2 acetoxymethyl ester for 1 h at 376C in KBR buffer sup-plemented with 5.6 mM glucose, 3 g BSA/L, at pH 7.4. The islets were then washed with the same medium and were placed in a chamber that was thermostatically regulated at 376C on the stage of an inverted epifluorescence mic-roscope (Nikon Eclipse TE200, Japan). Islets were then perifused with albumin-free KBR buffer containing 2.8 or 16.7 mM glucose, which was continuously gassed with 95% O2-5% CO2, pH 7.4. In another series of experiments, islets
were perifused with Ca2++-free KBR containing 11.1 mM
glucose plus 250mM diazoxide and 10 mM EGTA without or
with 100mM Cch, as indicated in the legends to Figures 1-6.
A ratio image was acquired every 3 s with a Cool One camera (Photon Technology International, USA) using a dual filter wheel equipped with 340, 380, and 10 nm band-pass filters, and a range of neutral density filters (Photon Technology International). Data were acquired by using the Image Master version 5.0 (Photon Technology International).
Pancreas morphometry and immunohistochemistry
For morphometric analysis, pancreases from all groups of rats were removed, weighed, and fixed for 24 h in Bouin’s solution, before embedding in paraffin. From each pancreas, five consecutive 7-mm serial sections were selected; a space of 140mm in thickness was then retained, after five more consecutive sections were obtained. Three sections were randomly selected for insulin and one section for glucagon immunoperoxidase reaction. For immunohistochemistry, paraffin was removed; the sections were rehydrated and washed with 0.05 M Tris-saline buffer (TBS), pH 7.4, and subsequently incubated with TBS containing 0.3% H2O2for
30 min to endogenous peroxidase activity blockade. They were then permeabilized for a further 1 h with 0.1% Tween 20 and 5% of fat-free milk in TBS. Afterwards, the sections were incubated with a polyclonal guinea pig anti-insulin (1:150; Dako North America, Inc., USA) or rabbit anti-glucagon (1:50; Dako North America, Inc.) antibody at 46C overnight and, after this period, incubated with rabbit
anti-guinea pig or goat anti-rabbit conjugated antibody with horseradish peroxidase for 1 h and 30 min. The positive insulin or glucagon cells were detected with diaminobenzi-dine (DAB; Sigma-Aldrich Chemicals) solution (10% DAB and 0.2% H2O2in TBS). Finally, the sections were stained
with Ehrlich’s hematoxylin and mounted for microscopy. All islets present in the sections were systematically captured with a digital camera coupled to a microscope (Olympus DP71; Olympus BX60; Olympus, Japan).
Islet,b-cell, anda-cell areas were measured using the Image-Pro-Plus Media, Cybernetics Program (USA), and at least 750 islets per group from three to four rats were sampled. The percentages of total islet andb-cell areas were calculated by dividing the sum of the islet andb-cell areas, respectively, per pancreas area section and multiplying by 100 (21,22). The percentages of small, medium, and large islets were calculated as previously reported (21). The islet andb-cell masses were calculated by multiplying the pancreas weight by the percentage of the total islet andb -cells areas, respectively (22,23). The b-cell number was quantified by counting the number of cellular nuclei within the insulin immunoreactive area, and then the results were expressed asb-cell number per 1000mm2ofb-cell area. The
b-cell size was measured using the same material used for determination ofb-cell area, and was calculated by dividing
b-cell area perb-cell number in the insulin immunoreactive area (24).
Statistical analysis
Results are reported as means ± SE for the number of determinations (n) indicated. The statistical analyses were carried out using two-way analysis of variance (ANOVA) followed by the Duncan’s post-test or Student’s
t-test (P#0.05) with the Statistica 7.0 software (StatSoft, USA).
Results
General rat parameters
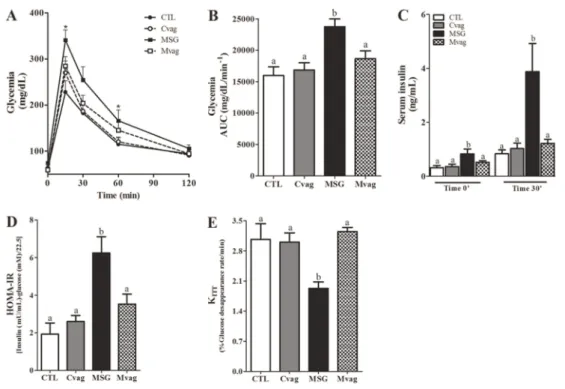
Figure 1A shows that BW progression in MSG-treated rats was significantly lower at 4 weeks after sham surgery, compared to CTL (P,0.003). The total BW, as judged by the area under the growth curve (AUC), was lower in MSG rats than in CTL rats (P,0.02; Figure 1B). In addition, the amount of food consumed during the experimental period by MSG rats was lower than that of CTL rats (P,0.005; Figure 1C). However, the conversion of this food into efficient BW gain in MSG rats was similar to that seen in CTL rats (Figure 1D). Vagotomy did not modify BW between the groups,
whereas it significantly reduced the total food intake in the Cvag and Mvag groups, compared to their respective controls (P,0.02 and P,0.001, respectively; Figure 1C), and altered feeding efficiency in Mvag in comparison with MSG rats (P,0.03; Figure 1D).
At the end of the experimental period, MSG rats showed a reduction of 14 and 8% in final BW and nasoanal length, respectively, compared to CTL rats (P,0.006 and P,0.007, respectively; Table 1). MSG treatment efficiently induced obesity, since the Lee index was higher and retroperitoneal and perigonadal fat pads were larger in MSG rats compared to CTL rats (P,0.002, P,0.0005, and P,0.0001, respec-tively; Table 1). Vagotomy did not alter nasoanal length or Lee index, but was effective for decreasing BW and pre-venting fat deposition in Mvag rats, compared to MSG rats, with reductions of 25% and 26% in the retroperitoneal and perigonadal fat stores, respectively (P,0.05, P,0.02, and P,0.05; Table 1). In addition, the size of the retroperitoneal fat pad was also reduced in Cvag rats, compared to CTL rats (P,0.01; Table 1). To confirm bilateral subdiaphragmatic vagotomy, we analyzed the ratio between stomach weight and BW (14). Cvag rats and Mvag rats presented higher stomach weight per BW ratios (0.86±0.05 and 0.69± 0.01% BW, respectively), compared to CTL rats (0.49±
0.01% BW; P,0.001) and MSG rats (0.38±0.08% BW; P,0.001), respectively.
Glucose tolerance and insulin sensitivity
At the end of the experimental period, all rat groups were submitted to anipGTT. Before glucose administra-tion, fasted MSG rats did not show any alteration in blood glucose levels, whereas they presented higher plasma insulin levels (P,0.05; Figure 2, A and C). After glucose loading, glycemia reached maximal levels at 15 min in all groups (Figure 2A). MSG rats presented higher glycemia levels at 15 and 60 min of the test, compared with CTL rats (P,0.006 and P=0.05; Figure 2A). Total glycemia during theipGTT in MSG rats was 50% higher than the CTL group (P,0.006; Figure 2B). In addition, at 30 min, insulinemia was four-fold higher in MSG rats than in CTL rats (P,0.0001; Figure 2C). Vagotomy normalized glucose tolerance and insulinemia, before and at 30 min after the glucose injection, in Mvag rats (Figure 2, A-C). Glucose intolerance in the MSG group was in accordance with an impaired insulin peripheral action, since the HOMA-IR was 3.3-fold higher in MSG rats than in CTL rats (P,0.0005; Figure 2D). In addition, the MSG group presented a 37% reduction in KITT,
compared with CTL rats (P,0.005; Figure 2E). Vagotomy, performed at 30 days of age, normalized HOMA-IR and KITT
values, indicating a significant preventative effect on insulin resistance in adult MSG rats (Figure 2, D and E).
Serum biochemical parameters and lipid content in the liver
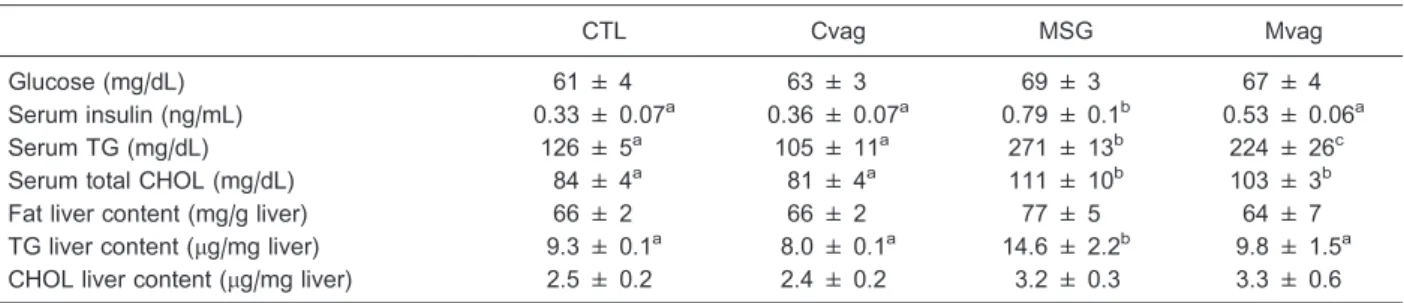
Fasting glucose levels were similar in all groups (Table 2); however, normoglycemia in MSG rats was maintained by hyperinsulinemia, compared to CTL (P,0.001; Table 2). Vagotomy efficiently reduced insulinemia in Mvag rats, with a decrease of 33% in serum insulin, in comparison with MSG rats (P,0.03; Table 2). The MSG group presented hypertriglyceridemia and hypercholesterolemia (P,0.0001 and P,0.005). Serum TG levels were efficiently reduced in Mvag rats compared to MSG rats (P,0.03; Table 2). Furthermore, the TG content in the liver of the MSG rats was 57% higher than in CTL rats (P,0.02; Table 2). Early subdiaphragmatic vagotomy normalized the TG content in the liver of adult Mvag rats (Table 2). No alteration was observed in total fat and CHOL content in the liver.
Islet insulin secretory function and Ca2++handling
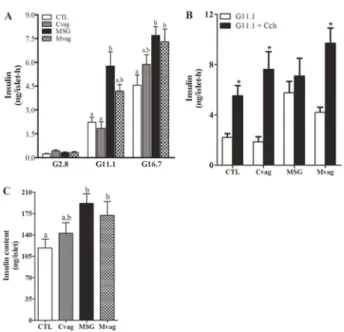
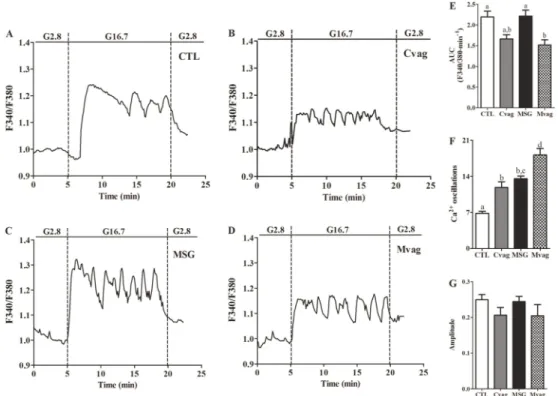
Figure 3A shows glucose-induced insulin secretion in islets isolated from CTL, Cvag, MSG, and Mvag rats. Insulin release at basal glucose concentration was similar for all groups. At stimulatory glucose concentrations, the insulin release was significantly higher in MSG rat islets compared to CTL rat islets (P,0.001 and P,0.01, for 11.1 and 16.7 mM glucose, respectively; Figure 3A). This effect was not due to modifications in Ca2++influx (Figure 4), since the AUC and amplitude of the intracellular Ca2++concentration ([Ca2++]i) in MSG rat islets were similar to those of CTL rat islets, when islets were perifused with 16.7 mM glucose (Figure 4, E and G), whereas the MSG group presented a higher fre-quency of Ca2++oscillations than CTL rat islets (P,0.0001; Figure 4F). Vagotomy partially reduced insulin secretion at 11.1 mM glucose in Mvag rats, but did not modify the hormone’s secretion at 16.7 mM glucose, compared to MSG rats (Figure 3A). This effect was associated with a lower total [Ca2++]i, but a higher number of Ca2++oscillations in response to 16.7 mM glucose in Mvag rat islets (P,0.03 and P,0.0001, respectively; Figure 4, D-F).
When the islets were incubated in the presence of 11.1 mM glucose plus 100mM Cch, an M3 receptor agonist
(6), MSG rat islets did not present an increase in insulin release (Figure 3B). However, Cch induced a higher intra-cellular Ca2++mobilization in the MSG group, since the total quantity and amplitude of [Ca2++]i were enhanced in MSG rat islets compared with CTL (P,0.006 and P,0.02; Figure 5, C, E, and F). Mvag rat islets efficiently enhanced insulin release in response to Cch (Figure 3B), and this effect was accompanied by a normal intracellular Ca2++ mobilization
compared with CTL rat islets (Figure 5, D-F). In addition, islet insulin content was 61% higher in MSG rat islets than in CTL rat islets (P,0.01; Figure 3C). Subdiaphragmatic vagal
Figure 4.Representative curves of glucose-induced cytoplasmic Ca2++oscillations in islets isolated from 90-day-old CTL (A), Cvag (B), MSG (C) and Mvag (D) rats. The area under the curve (AUC) (during G16.7 condition=5-20 min) (E), frequency of Ca2++oscillations (F) and amplitude (G) of the [Ca2++]i in response to 16.7 mM glucose. The experiments were performed in a perifusion system in a medium that contained 2.8 or 16.7 mM glucose (G2.8 and G16.7, respectively). The amplitude was calculated by subtracting the highest fluorescence ratio obtained at G16.7 from G2.8 fluorescence values immediately before changing the glucose concentration in the perifusion. Data are the ratio of F340/F380 registered for each group. CTL: control; Cvag: CTL with subdiaphragmatic vagotomy; MSG: monosodium glutamate; Mvag: MSG with subdiaphragmatic vagotomy. Data are reported as means±SE that were obtained from 4-14 independent experiments. Different letters represent statistically significant differences (two-way ANOVA followed by Duncan’s post-test, P#0.05).
denervation did not alter islet insulin storage in the Cvag and Mvag groups (Figure 3C).
Pancreatic islet morphology and morphometry
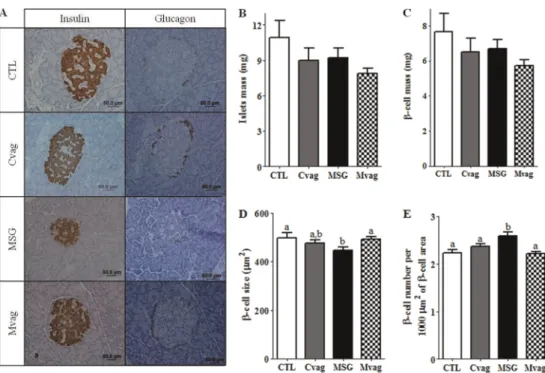
Figure 6A shows histological pancreatic sections stained for insulin or glucagon. The pancreatic islet architecture was not altered between the groups. Table 3 shows that MSG rats presented reductions of 34 and 49% in the ratio of pancreas weight per BW and total pancreas area, respec-tively, compared to CTL rats (P,0.0001 and P,0.03). After 2 months of subdiaphragmatic vagotomy denervation, Mvag rats presented 1.3- and 1.9-fold increases in pancreas weight and area, respectively, compared with MSG rats
(P,0.04 and P,0.03, respectively; Table 3). Histological analyses showed that pancreatic islets from MSG rats were smaller and had a reduction in b-cell area without modification in thea-cell content, compared with islets from CTL rats (P,0.0001; Table 3). Furthermore, the MSG group presented an increase in the percentage of total islet andb -cell areas per pancreas section analyzed (P,0.0001), with no modification in the distribution of islets by size (Table 3). However, no alterations in islet and b-cell mass were ob-served (Figure 6, B and C), but an increasedb-cell number/ 1000mm2ofb-cell area was present in the MSG rat pan-creas, compared with CTL (P,0.04; Figure 6E). In addition,
b-cell size was lower in the MSG group than in the CTL
Figure 6.Representative images of pancreas sections stained for insulin or glucagon and hematoxylin (A). Islet mass (B),b-cell mass (C),b-cell size (D) andb-cell number (E) in the pancreas of 90-day-old control (CTL), CTL with subdiaphragmatic vagotomy (Cvag), monosodium glutamate (MSG) and MSG with subdiaphragmatic vagotomy (Mvag) rats. Data are reported as means±SE (n=4). Different letters indicate statistically significant differences (two-way ANOVA followed by Duncan’s post-test, P#0.05).
Table 1. Final body weight (BW), nasoanal length, Lee Index, retroperitoneal and perigonadal fat pads of 90-day old CTL, Cvag, MSG and Mvag rats.
CTL Cvag MSG Mvag
BW (g) 361 ± 11a 337 ± 11a,b 310 ± 11b,c 277 ± 11c
Nasoanal length (cm) 24 ± 0.7a 25 ± 0.4a 22 ± 0.2b 22 ± 0.3b
Lee Index 286 ± 5a 278 ± 4a 311 ± 1b 304 ± 6b
Retroperitoneal fat pads (% BW) 0.9 ± 0.1a 0.5 ± 0.1b 1.6 ± 0.1c 1.2 ± 0.1d Perigonadal fat pads (% BW) 0.9 ± 0.1a 0.8 ± 0.04a 1.9 ± 0.2b 1.4 ± 0.1a
group (P,0.02; Figure 6D). Pancreases of the Mvag rats did not present any alterations in islet andb-cell areas, com-pared with MSG rats (Table 3). In addition, the percentage of islet andb-cell areas per pancreas section (Table 3), as well asb-cell number/1000mm2of b-cell area andb-cell
size per islet, were similar in the pancreases of Mvag and CTL rats (Figure 6, D and E). However, the Mvag group presented a higher islet number per pancreatic section evaluated, compared with the CTL group (P,0.03; Table 3). Vagotomy, performed at 30 days of age, also reduced the islet andb-cell areas in the pancreases of 90-day-old Cvag rats (P,0.005 and P,0.02), without altering other islet morphometric parameters (Table 3 and Figure 6).
Discussion
In the present study, we hypothesized that the increased glucose-induced insulin secretion and hyperinsulinemia in MSG rats may be linked to morphofunctional alterations in the endocrine pancreas due to vagus nerve hyperactivity,
since an ANS imbalance with enhanced PNS but decreased SNS action has been previously reported in MSG-induced obesity (10). Therefore, we performed a subdiaphragmatic vagotomy in 30-day-old MSG rats and, after 2 months, adult vagotomized MSG rats exhibited a normalization of someb -cell morphofunctional alterations and insulinemia, together with the prevention of obesity development and glucose homeostasis disruption.
Islet perifusion experiments demonstrated that en-hanced glucose-induced insulin secretion in the MSG group was not accompanied by an alteration in total [Ca2++]i in response to glucose (Figure 4, C and E). However, MSG rat islets did not increase insulin secretion in response to the potentiating agent, Cch (Figure 3B). Previously, we demon-strated a downregulation in the M3/protein kinase C (PKC) pathway in MSG rat islets (18). Here, we extend the data about the M3/PKC mechanism in the MSG islets, showing a higher Ca2++mobilization from internal stores in response to Cch (Figure 5). It is known that, in b-cells, Cch increases [Ca2++]i in a biphasic manner. The first phase is induced by
Table 2. Fasting serum glucose, insulin, TG and total CHOL concentrations and total fat, TG and CHOL content in the liver of 90-day-old CTL, Cvag, MSG and Mvag rats.
CTL Cvag MSG Mvag
Glucose (mg/dL) 61 ± 4 63 ± 3 69 ± 3 67 ± 4
Serum insulin (ng/mL) 0.33 ± 0.07a 0.36 ± 0.07a 0.79 ± 0.1b 0.53 ± 0.06a
Serum TG (mg/dL) 126 ± 5a 105 ± 11a 271 ± 13b 224 ± 26c
Serum total CHOL (mg/dL) 84 ± 4a 81 ± 4a 111 ± 10b 103 ± 3b
Fat liver content (mg/g liver) 66 ± 2 66 ± 2 77 ± 5 64 ± 7
TG liver content (mg/mg liver) 9.3 ± 0.1a 8.0 ± 0.1a 14.6 ± 2.2b 9.8 ± 1.5a CHOL liver content (mg/mg liver) 2.5 ± 0.2 2.4 ± 0.2 3.2 ± 0.3 3.3 ± 0.6
Data are reported as means±SE (n=6-11). CTL: control; Cvag: CTL with subdiaphragmatic vagotomy; MSG: monosodium glutamate; Mvag: MSG with subdiaphragmatic vagotomy; TG: triglycerides; CHOL: total cholesterol. Different letters indicate statistically significant differences (P#0.05, two-way ANOVA followed by Duncan’s post-test).
Table 3. Morphometric analysis of the pancreas of 90-day-old CTL, Cvag, MSG and Mvag rats.
CTL Cvag MSG Mvag
Pancreas weight (% BW) 0.43 ± 0.02ab 0.47 ± 0.03b 0.28 ± 0.02c 0.36 ± 0.02a Pancreas area (cm2) 2.56 ± 0.30a 3.16 ± 0.27a 1.36 ± 0.11b 2.63 ± 0.17a Islet area (mm2) 19225 ± 1044a 15965 ± 828b 13554 ± 659c 14674 ± 646b,c b-cell area (mm2) 13582 ± 790a 11579 ± 612b 9859 ± 476c 10660 ± 488b,c
a-cell area (mm2) 2039 ± 209 2091 ± 272 2102 ± 241 2249 ± 193
Total islet area (% pancreas area) 0.72 ± 0.09a 0.61 ± 0.06a 1.09 ± 0.09b 0.72 ± 0.04a Totalb-cell area (% pancreas area) 0.51 ± 0.07a 0.44 ± 0.05a 0.79 ± 0.05b 0.53 ± 0.03a % small islets (0-5,000mm2) 39.9 ± 1.9 44.9 ± 2.7 48.5 ± 2.6 45.0 ± 2.6 % medium islets (5,000-10,000mm2) 19.0 ± 2.5 16.1 ± 1.2 16.0 ± 1.2 17.2 ± 1.4 % large islets (.10,000mm2) 41.1 ± 2.6 39.0 ± 2.5 35.5 ± 2.2 37.8 ± 2.3
Islet number per section 91 ± 14a 118 ± 9a,b 107 ± 9a,b 127 ± 4b
Number of islets analyzed 832 814 1091 1145
IP3, and the second phase is due to the opening of Ca2++ channels located on the plasma membrane (25). The increase in [Ca2++]i together with DAG activates PKC,
which enhances the efficiency of Ca2++in insulin granule exocytosis (2). We recently demonstrated a lower PKC content in MSG islets (18). This evidence suggests that a disruption in insulin granule exocytosis occurs in the MSG group, possibly due to PKC, even though the internal Ca2++ flux in response to Cch was adaptively enhanced.
Vagotomy did not alter insulin secretion at 16.7 mM glucose in Mvag rats (Figure 3A) compared to MSG rats. However, a reduction in glucose-induced insulin secretion in islets from MSG rats submitted to early subdia-phragmatic vagotomy has been reported previously (16). In contrast, we found that Cch effectively enhanced insulin secretion in Mvag islets (Figure 3B) and provoked a normal intracellular Ca2++mobilization (Figure 5). Although further investigations are needed to verify the discrepant results in glucose-induced insulin secretion in the Mvag group, our data indicate that early vagotomy may prevent down-regulation in the M3/PKC pathway, which may improve Mvag b-cell function after a glucose stimulus, because the PLC pathway is also activated in the presence of this molecule inb-cells (26).
Pancreatic morphometry demonstrated that, although islet andb-cell mass did not differ between MSG and CTL rat pancreases (Figure 6, B and C), the MSG group presented a higher percentage of total islet andb-cell areas per pancreas section (Table 3), a higherb-cell number/1000mm2ofb-cell
area (Figure 6E), with reducedb-cell size (Figure 6D). These islet modifications demonstrate that increased insulin se-cretion, at stimulatory glucose concentrations (Figure 3A), as well as hyperinsulinemia (Table 2 and Figure 2C), are associated with greater numbers of pancreatic b-cells in MSG islets. Several lines of experimental evidence suggest that the vagus nerve controls cellular proliferation in different tissues in ventromedial hypothalamic lesioned rats (4,7,27-29). This increased proliferation was inhibited by bilateral subdiaphragmatic vagotomy or by administration of the cholinergic blocker, atropine (4,27).
The above studies demonstrated that the vagus nerve is important for the acute control of cellular replication; however, its chronic action has been poorly investigated. Our results indicated that the PNS was chronically involved in endocrine pancreas modification in obesity of MSG rats because, after 2 months of subdiaphragmatic vagotomy, Mvag rats exhibited normal values for pancreas weight and area, percentage of total islet andb-cell areas (Table 3),
b-cell number per b-cell area, and b-cell size (Figure 6). These data are in accordance with reports demonstrating that early subdiaphragmatic vagotomy decreased b-cell proliferation inob/obmice (5). This evidence supports the hypothesis that vagus nerve hypertonia during the onset of obesity and insulin resistance may programb-cell number in the pancreas. In addition, we observed that PNS activity was an important determinant of the islet andb-cell composition
in normal rats, since adult Cvag rats presented a decrease in islet and b-cell areas without any alteration in the mass content of whole pancreas (Figure 6, B and C).
Our study, in addition to detecting morphofunctional alterations in the pancreas of MSG rats, also replicated the obesity parameters that have been previously reported for MSG rats (13-15,17,30), since MSG rats presented lower values for BW and nasoanal length and increased values for Lee index and fat deposition, normoglycemia, hyperinsulin-emia, dyslipidhyperinsulin-emia, glucose intolerance, and insulin resistance (Tables 1 and 2; Figures 1 and 2). Vagotomy, performed at 30 days of age, prevented obesity and improved glucose tolerance and insulin sensitivity in adult Mvag rats (Tables 1 and 2, Figures 1 and 2). We also observed a decrease in retroperitoneal fat deposition in Cvag rats (Table 1). Prevention of body fat accumulation and an improvement in glucose tolerance have been reported in Mvag rats (14,31). It is known that, in the postprandial state, the activation of parasympathetic efferent nerves improves the action of insulin in target tissues (32,33). However, in obesity, PNS hyperactivity occurs, leading to an adaptive enhanced acetylcholinesterase activity (15,34); and this effect may contribute to decreased insulin action and development of type 2 diabetes.
We also demonstrated that Mvag rats presented lower serum TG levels and normal TG content in the liver. It has been accepted that vagal afferent nerves play an important role in energy homeostasis. There have been reports of experimental evidence for the involvement of vagal afferent neurons in the transmission of satiety signals from the gut to the CNS (35). Daly et al. (36) reported that the consumption of an unhealthy diet promotes obesity due to a reduction of gut signals to the CNS, which culminates in increased food intake and increased weight. However, the obesity induced by neonatal treatment with MSG is not linked to a disruption in dietary consumption, but to altered hypothalamic actions that increase PNS activity and de-crease the action of the SNS (10), contributing to hype-rinsulinemia, obesity and insulin resistance development. As such, the nucleus tractus solitari senses all vagal affer-ents and contributes to regulate energy balance (35). Furthermore, insulin was reported to enhance the basal activity of duodenal vagal mechanoreceptors, increasing afferent input to the CNS (37); this action in MSG hyper-insulinemic obese rats may enhance PNS activity. In addition, vagal efferent nerves to the liver are involved in insulin-induced hepatic lipogenesis (38). As such, we hypothesized that subdiaphragmatic vagotomy abolishes vagal afferent input to the CNS and efferent input to the liver, which may decrease TG production and, consequently, its levels in the blood serum.
In conclusion, we demonstrated for the first time that hyperinsulinemia and insulin hypersecretion in response to glucose in MSG rats was associated with an increase in
secretory function in the presence of the cholinergic stimulus, which may predispose these rodents to the early development of b-cell dysfunction. Subdiaphragmatic vagotomy, performed at 30 days of age, prevented islet morphofunctional and whole body nutrient metabolism alterations in adult Mvag rats. It is possible that increased PNS activity in the endocrine pancreas of MSG rats was responsible for the hyperinsulinemia that enhances fat storage, damages glucose homeostasis, and reduces the
action of insulin in MSG-induced obesity.
Acknowledgments
We are grateful to Assis Roberto Escher for animal care and Nicola Conran for editing the English. This study is part of the MSc thesis of C. Lubaczeuski and was supported by grants from Fundac¸a˜o Arauca´ria, CNPq, CAPES, and FAPESP (2011/09012-6).
References
1. Plum L, Belgardt BF, Bruning JC. Central insulin action in energy and glucose homeostasis.J Clin Invest2006; 116: 1761-1766, doi: 10.1172/JCI29063.
2. Gilon P, Henquin JC. Mechanisms and physiological significance of the cholinergic control of pancreatic beta-cell function.Endocr Rev2001; 22: 565-604.
3. Ahren B. Islet nerves in focus - defining their neurobiological and clinical role. Diabetologia 2012; 55: 3152-3154, doi: 10.1007/s00125-012-2727-6.
4. Kiba T, Tanaka K, Numata K, Hoshino M, Misugi K, Inoue S. Ventromedial hypothalamic lesion-induced vagal hyperactivity stimulates rat pancreatic cell proliferation.Gastroenterology 1996; 110: 885-893, doi: 10.1053/gast.1996.v110.pm8608899. 5. Edvell A, Lindstrom P. Vagotomy in young obese hypergly-cemic mice: effects on syndrome development and islet proliferation.Am J Physiol1998; 274: E1034-E1039. 6. Yoshimura R, Omori H, Somekawa S, Osaka T, Ito R, Inoue
S, et al. Continuous carbachol infusion promotes peripheral cell proliferation and mimics vagus hyperactivity in a rat model of hypothalamic obesity.Biomed Res2006; 27: 81-88, doi: 10.2220/biomedres.27.81.
7. Suzuki Y, Inoue S, Shimizu H, Ishizuka N, Kasahara Y, Takahashi T, et al. Cell proliferation in visceral organs induced by ventromedial hypothalamic (VMH) lesions: Development of electrical VMH lesions in mice and resulting pathophysio-logical profiles.Endocr J2011; 58: 247-256, doi: 10.1507/ endocrj.K10E-408.
8. Medina A, Yamada S, Hara A, Hamamoto K, Kojima I. Involvement of the parasympathetic nervous system in the initiation of regeneration of pancreatic beta-cells.Endocr J 2013; 60: 687-696, doi: 10.1507/endocrj.EJ12-0361. 9. Imai J, Katagiri H, Yamada T, Ishigaki Y, Suzuki T, Kudo H,
et al. Regulation of pancreatic beta cell mass by neuronal signals from the liver.Science2008; 322: 1250-1254, doi: 10.1126/science.1163971.
10. Scomparin DX, Gomes RM, Grassiolli S, Rinaldi W, Martins AG, de Oliveira JC, et al. Autonomic activity and glycemic homeostasis are maintained by precocious and low intensity training exercises in MSG-programmed obese mice.Endocrine 2009; 36: 510-517, doi: 10.1007/s12020-009-9263-2. 11. Stearns AT, Balakrishnan A, Radmanesh A, Ashley SW,
Rhoads DB, Tavakkolizadeh A. Relative contributions of afferent vagal fibers to resistance to diet-induced obesity. Dig Dis Sci2012; 57: 1281-1290, doi: 10.1007/s10620-011-1968-4.
12. Olney JW. Glutamate-induced neuronal necrosis in the infant mouse hypothalamus. An electron microscopic study. J Neuropathol Exp Neurol1971; 30: 75-90, doi: 10.1097/
00005072-197101000-00008.
13. Maiter D, Underwood LE, Martin JB, Koenig JI. Neonatal treatment with monosodium glutamate: effects of prolonged growth hormone (GH)-releasing hormone deficiency on pulsa-tile GH secretion and growth in female rats.Endocrinology 1991; 128: 1100-1106, doi: 10.1210/endo-128-2-1100. 14. Balbo SL, Grassiolli S, Ribeiro RA, Bonfleur ML, Gravena C,
Brito MN, et al. Fat storage is partially dependent on vagal activity and insulin secretion of hypothalamic obese rat. Endocrine 2007; 31: 142-148, doi: 10.1007/s12020-007-0021-z.
15. Lucinei Balbo S, Gravena C, Bonfleur ML, de Freitas Mathias PC. Insulin secretion and acetylcholinesterase activity in monosodium l-glutamate-induced obese mice. Horm Res2000; 54: 186-191, doi: 10.1159/000053257. 16. Balbo SL, Bonfleur ML, Carneiro EM, Amaral ME, Filiputti E,
Mathias PC. Parasympathetic activity changes insulin response to glucose and neurotransmitters. Diabetes Metab2002; 28: 3S13-3S17.
17. Nardelli TR, Ribeiro RA, Balbo SL, Vanzela EC, Carneiro EM, Boschero AC, et al. Taurine prevents fat deposition and ameliorates plasma lipid profile in monosodium glutamate-obese rats.Amino Acids2011; 41: 901-908, doi: 10.1007/ s00726-010-0789-7.
18. Ribeiro RA, Balbo SL, Roma LP, Camargo RL, Barella LF, Vanzela EC, et al. Impaired muscarinic type 3 (M3) receptor/PKC and PKA pathways in islets from MSG-obese rats. Mol Biol Rep 2013; 40: 4521-4528, doi: 10.1007/ s11033-013-2546-y.
19. Laye S, Bluthe RM, Kent S, Combe C, Medina C, Parnet P, et al. Subdiaphragmatic vagotomy blocks induction of IL-1 beta mRNA in mice brain in response to peripheral LPS.Am J Physiol1995; 268: R1327-R1331.
20. Scott AM, Atwater I, Rojas E. A method for the simultaneous measurement of insulin release and B cell membrane potential in single mouse islets of Langerhans.Diabetologia1981; 21: 470-475, doi: 10.1007/BF00257788.
21. Ng SF, Lin RC, Laybutt DR, Barres R, Owens JA, Morris MJ. Chronic high-fat diet in fathers programs beta-cell dysfunction in female rat offspring.Nature2010; 467: 963-966, doi: 10.1038/nature09491.
23. Ribeiro RA, Santos-Silva JC, Vettorazzi JF, Cotrim BB, Mobiolli DD, Boschero AC, et al. Taurine supplementation prevents morpho-physiological alterations in high-fat diet mice pancreatic beta-cells.Amino Acids 2012; 43: 1791-1801, doi: 10.1007/s00726-012-1263-5.
24. Marroqui L, Batista TM, Gonzalez A, Vieira E, Rafacho A, Colleta SJ, et al. Functional and structural adaptations in the pancreatic alpha-cell and changes in glucagon signaling during protein malnutrition.Endocrinology2012; 153: 1663-1672, doi: 10.1210/en.2011-1623.
25. Liu YJ, Gylfe E. Store-operated Ca2++ entry in insulin-releasing pancreatic beta-cells.Cell Calcium1997; 22: 277-286, doi: 10.1016/S0143-4160(97)90066-X.
26. Thore S, Wuttke A, Tengholm A. Rapid turnover of phospha-tidylinositol-4,5-bisphosphate in insulin-secreting cells mediated by Ca2++ and the ATP-to-ADP ratio. Diabetes 2007; 56: 818-826, doi: 10.2337/db06-0843.
27. Kiba T, Tanaka K, Endo O, Inoue S. Role of vagus nerve in increased DNA synthesis after hypothalamic ventromedial lesions in rat liver.Am J Physiol1992; 262: G483-G487. 28. Kiba T, Tanaka K, Hoshino M, Numata K, Okano K, Inoue S.
Ventromedial hypothalamic lesions induce the proliferation of gastrointestinal mucosal cells in the rat.Life Sci1995; 57: 827-832, doi: 10.1016/0024-3205(95)02014-A.
29. Kintaka Y, Osaka T, Suzuki Y, Hashiguchi T, Niijima A, Kageyama H, et al. Effects of gastric vagotomy on visceral cell proliferation induced by ventromedial hypothalamic lesions: role of vagal hyperactivity.J Mol Neurosci 2009; 38: 243-249, doi: 10.1007/s12031-009-9200-0.
30. Hirata AE, Andrade IS, Vaskevicius P, Dolnikoff MS. Monosodium glutamate (MSG)-obese rats develop glucose intolerance and insulin resistance to peripheral glucose
uptake.Braz J Med Biol Res1997; 30: 671-674, doi: 10.1590/ S0100-879X1997000500016.
31. Balbo SL, Mathias PC, Bonfleur ML, Alves HF, Siroti FJ, Monteiro OG, et al. Vagotomy reduces obesity in MSG-treated rats.Res Commun Mol Pathol Pharmacol2000; 108: 291-296. 32. Lautt WW, Macedo MP, Sadri P, Takayama S, Duarte RF, Legare DJ. Hepatic parasympathetic (HISS) control of insulin sensitivity determined by feeding and fasting.Am J Physiol Gastrointest Liver Physiol2001; 281: G29-G36. 33. Macedo MP, Lima IS, Gaspar JM, Afonso RA, Patarrao RS,
Kim YB, et al. Risk of postprandial insulin resistance: the liver/vagus rapport.Rev Endocr Metab Disord2014; 15: 67-77, doi: 10.1007/s11154-013-9281-5.
34. Paes AM, Carniatto SR, Francisco FA, Brito NA, Mathias PC. Acetylcholinesterase activity changes on visceral organs of VMH lesion-induced obese rats.Int J Neurosci 2006; 116: 1295-1302, doi: 10.1080/00207450600920910. 35. de Lartigue G, de La Serre CB, Raybould HE. Vagal afferent
neurons in high fat diet-induced obesity; intestinal micro-flora, gut inflammation and cholecystokinin.Physiol Behav 2011; 105: 100-105, doi: 10.1016/j.physbeh.2011.02.040. 36. Daly DM, Park SJ, Valinsky WC, Beyak MJ. Impaired
intestinal afferent nerve satiety signalling and vagal afferent excitability in diet induced obesity in the mouse.J Physiol 2011; 589: 2857-2870, doi: 10.1113/jphysiol.2010.204594. 37. Blat S, Malbert CH. Insulin modulates duodenal vagal
afferents basal activity.Auton Neurosci2005; 122: 29-37, doi: 10.1016/j.autneu.2005.07.006.