PANOECONOMICUS, 2013, 2, Special Issue, pp. 231-247
Received: 29 June 2012; Accepted: 05 November 2012.
UDC 330.43:330.131.7 DOI: 10.2298/PAN1302231S Original scientific paper
Stavros Stavroyiannis
Department of Finance and Auditing, Technological Educational Institute of Kalamata,
Greece
Leonidas Zarangas
Department of Finance and Auditing, Technological Educational Institute of Epirus,
Greece
An early version of this paper was presented at the Annual International Conference on Macroeconomics Analysis and International Finance, May 24-26, 2012, at University of Crete, Rethymno. The authors would like to thank the discussant Georgios Tsiotas, the chair of the session Sophie Béreau, and the conference partici-pants for many helpful comments and discussions.
Out of Sample Value-at-Risk and
Backtesting with the
Standardized Pearson Type-IV
Skewed Distribution
Summary: This paper studies the efficiency of an econometric model where the volatility is modeled by a GARCH (1,1) process, and the innovations follow a standardized form of the Pearson type-IV distribution. The performance of the model is examined by in sample and out of sample testing, and the accuracy is explored by a variety of Value-at-Risk methods, the success/failure ratio, the Kupiec-LR test, the independence and conditional coverage tests of Christof-fersen, the expected shortfall measures, and the dynamic quantile test of Engle and Manganelli. Overall, the proposed model is a valid and accurate model performing better than the skewed Student-t distribution, providing the financial analyst with a good candidate as an alternative distributional scheme.
Key words:Value-at-Risk, Econometric modeling, GARCH, Pearson type-IV distribution.
JEL: C01, C46, C5.
In the last decades a variety of financial crises took place such as the worldwide market collapse in 1987, the Mexican crisis in 1995, the Asian and Russian financial crises in 1997-1998, the Orange County default, the Barings Bank, the dot.com bub-ble and Long Term Capital Management bankruptcy, and the financial crisis of 2007-2009 which lead several banks to bankruptcy, with Lehman Brothers being the most noticeable case. Such financial uncertainty has increased the likelihood of financial institutions to suffer substantial losses as a result of their exposure to unpredictable market changes, and financial regulators as well as the supervisory committee of banks have favored quantitative risk techniques that can be used for the evaluation of the potential loss.
232 Stavros Stavroyiannis and Leonidas Zarangas
in the 1990’s and put in full implementation in 2007. A central feature of the modi-fied Basel II Accord was to allow banks to develop and use their own internal risk management models, under the condition that these models were “back tested” and “stress tested” under extreme circumstances.
Value-at-Risk (VaR), defined by Fred Stambaugh (1996) and Jorion Philippe (2000) as a certain amount lost on a portfolio of financial assets with a given prob-ability over a fixed number of days, has become a standard tool used by financial analysts to measure market risk, because of its simplicity to quantify market risk by a single number. Since it has a probabilistic point of view, several approaches in esti-mating the profit and loss distribution function of portfolio returns have been devel-oped in the last decades, and a substantial literature of empirical applications have emerged, providing an overall support of VaR as an appropriate measure of risk. Ini-tially there was a focus on the left tail of the distribution which corresponds to nega-tive returns, indicating the computation of VaR for a long trading position portfolio, but more recent approaches deal with modeling VaR for both the long and short trad-ing position.
233
Out of Sample Value-at-Risk and Backtesting with the Standardized Pearson Type-IV Skewed Distribution
The aim of this paper is to reconsider the Value-at-Risk where the volatility clustering and returns are modelled via a typical GARCH (1,1) model, and the inno-vations process follows a standardized form of the Pearson type-IV distribution. The model and the distribution are fitted to the data via maximization of the logarithm of the maximum likelihood estimator (MLE). As a case study we consider the last 5000 returns of the Dow Jones Industrial Average (DJIA) up to 31 December 2010, includ-ing the recent 2007-2009 financial crisis. We examine the in sample and out of sam-ple efficiency of the model for both the long and short trading position, and VaR backtesting is performed by the success-failure ratio, the Kupiec Likelihood-ratio (LR) test, the Christoffersen independence and conditional coverage test, the ex-pected shortfall with related measures, and the dynamic quantile test of Engle and Manganelli. The results, compared with the skewed Student-t distribution, in the sense of Fernandez and Steel (1998), indicate that the Pearson type-IV distribution improves the value of the MLE and gives accurate VaR results. The remainder of the paper is organized as follows. Section 1 reviews briefly the Pearson type-IV distribu-tion. In Section 2 we present the financial data used and the econometric methodol-ogy followed. Section 3 reports on the VaR analysis, Section 4 provide the in sample and out of sample procedure and VaR results and Section 5 discusses the concluding remarks.
1. The Pearson Type-IV Distribution
The Pearson system of distributions is a generalization of the differential equation leading to the Gaussian distribution, to a differential equation with solution:
2 1 2 ) 2 /( 1 2 4 2 tan 4 2 exp ) ( ) ( b ac cx b b ac c cm b cx bx a x
p c .
(1)
Such an attempt indicated a way to construct probability distributions in which the skewness (standardized third cumulant) and kurtosis (standardized fourth cumulant) could be adjusted equally freely, in order to fit theoretical models to datasets that exhibited skewness. In a series of papers Karl Pearson (1893, 1895, 1901, 1916) classified seven types of distributions from Equation (1), the Gaussian distribution (Pearson 0), the Beta (Pearson I), the Gamma distribution (Pearson type-III), the Beta prime distribution (Pearson type-VI), and the Student-t distribution (Pearson type-VII), while some extra classes IX-XII are also discussed (Pearson 1916). In the case where the discriminant is negative, after rearrangement of the terms in Equation (1) we conclude on the Pearson type-IV distribution in its recent form in the literature (Yuichi Nagahara 1999, 2004, 2007):
a x a x m i m m a m x p m 1 2 tan exp 1 ) ( ) 2 / ( ) 2 / 1 ( ) ( )
( . (2)
234 Stavros Stavroyiannis and Leonidas Zarangas
skewed for
0
while for
0
reduces to the Student’s t-distribution (Pearson type-VII) withm
degrees of freedom. The mean and the variance of the distribution which are of interest are given by:) 1 ( 2 m av x (3) and
2 2 2 2
2 ) 1 ( 4 1 ) 3 2 ( ) ( m v m a x x
. (4)
Application to financial time series using the method of moments has been performed by Kurt Brännäs and Niklas Nordman (2003), Gamini Premaratne and Anil K. Bera(2005), Malay Bhattacharyya, Abhishek Chaudhary, and Gaurav Yadav (2008), and a review is provided by Michael A. Magdalinos and George P. Mitsopoulos (2007). Since the variable domain of the Pearson type-IV distribution is
)
,
(
, Shaohua Chen and Hong Nie (2008) proposed a lognormal sum ap-proximation using a variant of the Pearson distribution to account for the(
0
,
)
domain. R. Willink (2008) indicated a closed-form expression for the Pearson Type IV Distribution Function. David Ashton and Mark Tippett (2006), derived the Pear-son type-IV distribution from a stochastic differential equation with standard Markov properties, and they commented on the distributional properties on selected time se-ries. Matteo Grigoletto and Francesco Lisi (2009, 2011), incorporated constant and dynamic conditional skewness and kurtosis into a GARCH-type structure with the Pearson type-IV distribution, and they performed in and out of sample VaR with the Kupiec and Christoffersen tests. Fabio Pizzutilo (2012) analyzed the European mar-ket using the Pearson system of continuous distributions, and compared the results using the different types of the Pearson system.
The cumulative density function (CDF) needed for the calculation of the con-stants at the confidence intervals, was recently calculated by Joel Heinrich (2004):
a x i m i m F a x i m a x p x P 1 2 ; 2 ; 2 / , 1 1 2 ) ( )
( 2 1 (5)
for the long position and,
)) 2 ( exp( 1 1 2 / ) ( 1 ; 2 2 ; 2 2 , 1 1 2 2 ) ( )
( 2 1
2 m i a x i i m m F a x i m ia x p x P (6)
235
Out of Sample Value-at-Risk and Backtesting with the Standardized Pearson Type-IV Skewed Distribution
2. Econometric Modeling
2.1. The Data
If the value of an asset has been recorded for a sufficient time, a common way to ana-lyze the time evolution of the returns is successive differences of the natural loga-rithm of price
P
t,r
t
ln(
P
t/
P
t1)
100
. As a case study we consider the last 5000 returns of the Dow Jones Industrial Average (DJIA) up to 31. December 2010. 2.2. The ModelWe consider a univariate time series GARCH (1,1) model where the innovations fol-low a Pearson type-IV distribution (Stavros Stavroyiannis et al. 2012):
t t t
t z
r (7)
2 1 2 1 2
t t
t a
. (8)
To keep the ARCH tradition, it is important to express the density in terms of the mean and of the variance of the distribution, and not as used up to now, in terms of the scale and location coefficient, in order to acquire a standardized distribution with zero mean and unit variance, to satisfy the martingale hypothesis used in financial time series. Solving for
anda
,) 1 ( 2 m a 2 2 2 2 ) 1 ( 4 1 ) 3 2 ( m m a
and substituting into the PDF we get,
) 1 ( 2 ) 3 2 ( ) 1 ( 4 1 2 2 m x m m a x .
Setting
0
, and
1
, we have for the new variable to be used,) 1 ( 2 ) 1 ( 4 1 ) 3 2 ( 1 2 2
m x m
m
.
236 Stavros Stavroyiannis and Leonidas Zarangas
Gamma functions, and integrating the PDF to acquire the normalization constant, we conclude on the standardized form of the Pearson type-IV distribution,
2
1 2 1 2 ) ˆ ˆ ( 1 ) ˆ ˆ ( tan exp )) 2 / 1 (( ) 2 / 2 / ) 1 (( 2 / ) 2 / 1 ( ˆ ) ( m x x m iv m m m x f (9) 1 ˆ m v (10)
2 2
) 1 ( 1 2 1 ˆ m v m (11)
The log-likelihood for the proposed model is as follows,
N t t t tPIV z v z
m C N L 1 1 2 2 ) ˆ ˆ ( tan ) ) ˆ ˆ ( 1 ln( 2 1 ) ln( 2 1
ln (12)
where,
2 / ) 1 (( 2 / 2 / ) 1 ( ln 2 1 ) ln( 2 1 2 ln ˆ ln 2 1 2 1 ln m iv m m mC (13)
The squared ratio of the complex Gamma function (Milton Abramowitz and Irene A. Stegun 1965) in Equation (13) was calculated by transcribing the C++ source code (Heinrich 2004) to Matalb®. Within an error of the order
O
(
10
10)
, in-stead of using Equations (5) and (6) with the cost of the complex GHF, the constants at the confidence intervals can be also computed, to speed up computational time, using an adaptive quadrature (Walter Gander and Walter Gautschi2000; Lawrence F. Shampine 2008) based on a Gauss-Kronrod pair (15th and 7th order formulas), via numerical integration of the normalized PDF. The algorithmic recurrence in Equation (8) uses the sample mean of squared residuals to start recursion, and for the numeri-cal optimization, the Broyden–Fletcher–Goldfarb–Shanno (BFGS) method for the inverse Hessian update is used.The optimization results for the in sample case, the constant in mean
, the constant in variance
, the ARCH term
, the GARCH term
, the persistence of the model (
), the tail coefficientm
, the asymmetry coefficient
, the associ-ated t-statistics in the parentheses1, and the value of the MLE, are shown in Table 1, for the Pearson type-IV and the skewed Student-t distributions. The Pearson type-IV distribution appears to describe better the assets return distribution leading to an im-proved value of the MLE.
1
237
Out of Sample Value-at-Risk and Backtesting with the Standardized Pearson Type-IV Skewed Distribution
3. Value-at-Risk Models
Having estimated the unknown parameters of the model, the VaR for the
a
-percentile of the assumed distribution can be calculated straightforward using the equationVaR
(
a
)
F
1(
a
)
(Ta-Lun Tang and Shwu-Jane Shieh 2006) which under the Pearson type-IV distribution for the long and short position is,
F 1 (1 a)
VaRlong PearsonIV
(14)
1 ( )
a F
VaRshort PearsonIV
(15)
whereat
F
1(.)
, the inverse of the cumulative distribution function at the specific confidence level is understood. Each time an observation exceeds the VaR border it is called a VaR violation, or VaR breech, or VaR break. Verifying the accuracy of risk models used in setting the market risk capital requirements demands backtesting (David G. McMillanand and Dimos Kambouroudis 2009; Anastassios A. Drakos, Georgios P. Kouretas, and Zarangas2010; Nikolaos Giannellis, Angelos Kanas, and Athanasios P. Papadopoulos 2010; Panayiotis F. Diamandis et al. 2011), and over the last decade a variety of tests have been proposed that can be used to investigate the fundamental properties of a proposed VaR model. The accuracy of these VaR esti-mates is of concern to both financial institutions and their regulators. As noted by Francis X. Diebold and Jose A. Lopez (1996), it is unlikely that forecasts from a model will exhibit all the properties of accurate forecasts. Thus, evaluating VaR es-timates solely upon whether a specified property is present may yield only limited information regarding their accuracy (Yu Chuan Huang and Bor-Jing Lin2004). In this work we consider five accuracy measures; the success-failure ratio, the Kupiec LR-test, the Christoffersen independence and conditional coverage tests, the ex-pected shortfall with related measures, and the dynamic quantile test of Engle and Manganelli.3.1 Success – Failure Ratio
A typical way to examine a VaR model is to count the number of VaR violations when portfolio losses exceed the VaR estimates. An accurate VaR approach produces a number of VaR breaks as close as possible to the number of VaR breaks specified by the confidence level. If the number of violations is more than the selected confi-dence level would indicate then the model underestimates the risk. On the other hand, if the number of violations is less, then the model overestimates the risk. The test is conducted as
x
/
T
, whereT
is the total number of observations, andx
is the number of violations for the specific confidence level.
3.2 Kupiec LR Test
238 Stavros Stavroyiannis and Leonidas Zarangas
on failure rates is the Proportion of Failures (POF) by Paul H. Kupiec (1995). Meas-uring whether the number of violations is consistent with the confidence level, under null hypothesis that the model is correct the number of violations follows the bino-mial distribution. The Kupiec test (unconditional coverage) is best conducted as a likelihood-ratio (LR) test where the test statistics takes the form:
) 1 ( ~
1 ) 1 ( ln
2 2
x T x
x T x
POF
T x T
x p p
LR (16)
where,
T
is the total number of observations,x
is the number of violations, andp
is the specified confidence level. Under the null hypothesis that the model is correct,POF
LR
is asymptotically
2 distributed with one degree of freedom. If the value of theLR
POF-statistic exceeds the critical value of the
2 distribution, the null hy-pothesis is rejected and the model is considered to be inaccurate. Therefore, the risk model is rejected if it generates too many or too few violations; however, based on that assumption a model that generates dependent exceptions can be also accepted as accurate.3.3 Christoffersen Independence, and Conditional Coverage Tests
In order to check whether the exceptions are spread evenly over time or they form clustering, the Christoffersen interval forecast test (conditional coverage) is used (Pe-ter F. Christoffersen 1998). This Markov test examines whether or not the likelihood of a VaR violation depends on whether or not a VaR violation occurred on the previ-ous day. If the VaR measure accurately reflects the underlying risk then the chance of violating today’s VaR should be independent of whether or not yesterday’s VaR was violated. Assigning an indicator that takes the value 1 if VaR is exceeded and 0 otherwise,
and defining
n
ij the number of days where the conditionj
occurred assuming that conditioni
occurred the previous day, the results can be displayed in a contingency2
2
table. Letting
i represent a probability of observing a violation conditional on statei
on the previous day,)
/(
00 01 010
n
n
n
,)
/(
10 11 111
n
n
n
, and)
/(
)
(
n
01
n
11n
00
n
01
n
10
n
11
239
Out of Sample Value-at-Risk and Backtesting with the Standardized Pearson Type-IV Skewed Distribution
the violation independence under the null hypothesis should state that
0
1. The relevant test statistics for independence of violations is a likelihood ratio,) 1 ( ~ ) 1 ( ) 1 (
) 1 ( ln
2 2
1 1 0 0
11 10 01
00
11 01 10 00
n n n
n
n n n n
ind LR
(17)
and is asymptotically
2 distributed with one degree of freedom. In the case where0
11
n
, indicating no violation clustering, either due to few observations or rather high confidence levels, the test is conducted as (Christoffersen and Denis Pelletier 2004),01 00
0 0)
1
( n n ind
LR (18)
which discards as a result the NaN’s (not a number) that appear in several works in the literature.
Joining the two criteria, the Kupiec test and the Christoffersen independence test, the Christoffersen conditional coverage (CC) is achieved. The test statistics for conditional coverage is asymptotically
2 distributed with two degrees of freedom:) 2 ( ~2
ind POF
CC LR LR
LR (19)
3.4 Expected Shortfall and Tail Measures
In the sense of Philippe Artzner et al. (1997, 1999), VaR is not considered as a co-herent measure of risk since, in the properties a coco-herent measure functional must satisfy on an appropriate probabilistic space, the sub-additivity property does not hold for all cases. Specific portfolios can be constructed where the risk of a portfolio with two assets can be greater than the sum of the individual risks therefore, violating sub-additivity and in general the diversification principle (Oliver Scaillet 2000). Ex-pected shortfall is a coherent measure of risk and it is defined as the exEx-pected value of the losses conditional on the loss being larger than the VaR. One expected short-fall measure associated with a confidence level
1
p
denoted as
p, is the Tail Conditional Expectation (TCE) of a loss given that the loss is larger than
p, that is:) | ( t t p
p EY Y
(20)
240 Stavros Stavroyiannis and Leonidas Zarangas
3.5. Dynamic Quantile Test of Engle-Manganelli
Engle and Simeone Manganelli (1999, 2004) suggest using a linear regression model linking current violations to past violations so as to test the conditional efficiency hypothesis. Let
Hit
(
a
)
I
t(
a
)
a
be the demeaned process ona
associated to)
(
a
I
t :
else ,
) ( if
, 1 )
( | 1
a
a VaR r a a
Hitt t tt (21)
Considering the following regression model,
K
k
K
k
t k t k t k
t k t k k
t k
t a Hit a gHit a Hit a z z
Hit
1 1
1 1( ),..., , ,..]
), ( [ )
( )
( (22)
where
t is an i.i.d. process and whereg
(.)
is a function of past violations and of variablesz
tk, from the available information set
t1. Whatever the chosen speci-fication, the null hypothesis test of conditional efficiency corresponds to testing the joint nullity of coefficients,
k,
k, and of constant
:0 :
0 k k
H
, k1,...,K.Therefore, the current VaR violations are uncorrelated to past violations since
0
kk
(consequence of the independence hypothesis), whereas the uncondi-tional coverage hypothesis is verified when
0
. The Wald statistics, notedCC
DQ
, in association with the test of conditional efficiency hypothesis then verifies,) 1 2 ( )
1 ( ˆ
2
K
a a
Z Z DQ
L
T
CC . (23)
4. In Sample and Out of Sample Procedure and VaR Results
We examine the validity and accuracy of the econometric model by performing the aforementioned statistical test and the results are compared to the skewed Student-t distribution2 (Jurgen A. Doornik 2009). As rule of thumb, we consider a result to be better if there is a change at the second decimal place. A better result is indicated with bold fonts at the tables, an equal result, meaning that the results are equal or there is a change beyond the second decimal point, is indicated in italics fonts, and a worst result is indicated in regular fonts.
2
241
Out of Sample Value-at-Risk and Backtesting with the Standardized Pearson Type-IV Skewed Distribution
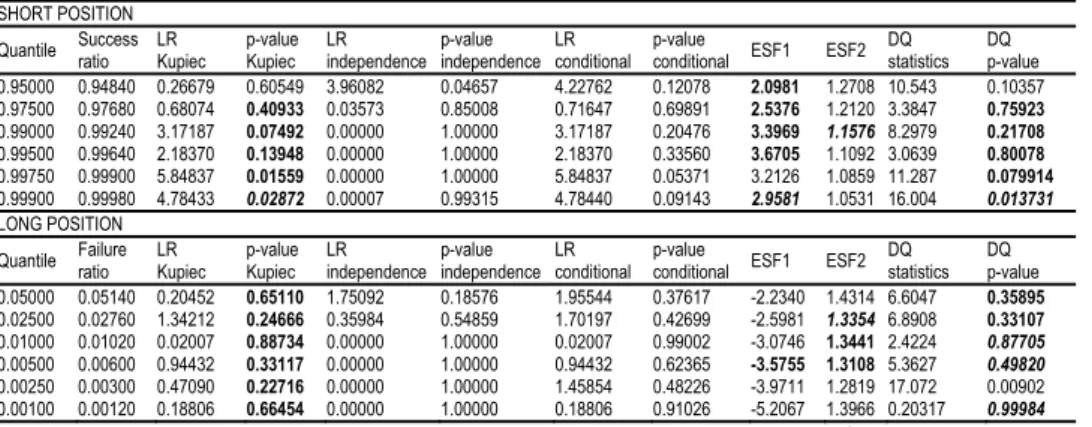
4.1 In Sample VaR Results
We use the estimation results to compute the one-step-ahead VaR for the long and short trading position for several confidence levels which range from 5% to 0.1%. The results are shown in Table 2 which includes the success/failure ratio, the Kupiec likelihood ratio and p-value, the Christoffersen independence (unconditional cover-age) likelihood ratio and p-value, the Christoffersen joint test (conditional covercover-age) likelihood ratio and p-value, the expected shortfall measures ESF1 and ESF2, and the statistics and p-value for the dynamic quantile test.
4.2 Out of Sample VaR Results
The testing methodology in the previous subsection is equivalent to back-testing the model on the estimation sample. In the literature, it is argued that this should be fa-vorable to the tested model and out-of-sample forecasts, where the model is esti-mated on the known returns and the VaR forecast is made for some period
]
;
1
[
t
t
h
, where h is the time horizon of the forecasts. In our implementation the testing procedure for the long and short VaR assumesh
1
day, and we use the ap-proach described in Giot and Laurent (2003). The first estimation sample is the com-plete sample for which the data is available less the last five years. The predicted one-day-ahead VaR (both for long and short positions) is then compared with the observed return and both results are recorded for later assessment using the statistical tests. At thei
-thiteration wherei
runs from 2 to 5·252 (five years of data), the es-timation sample is augmented to include one more day and the VaR are forecasted and recorded. Wheneveri
is a multiple of 50, the model is re-estimated to update the Pearson type-IV GARCH parameters. Therefore, the model parameters are updated every 50 trading days and a “stability window” of 50 days for the parameters is as-sumed. The procedure is iterated until all days (less the last one) have been included in the estimation sample. Corresponding failure rates are then computed by compar-ing the long and short forecastedVaR
t1 with the observed returny
t1for all days in the five years period. Using the aforementioned in sample statistical tests for the out of sample VaR the results are shown in Table 3.5. Discussion and Conclusions
In this work we have presented the implementation of an econometric model where the volatility clustering is modeled by a GARCH(1,1) process and the innovations follow a Pearson type-IV distribution. The model was tested in-sample and out-of-sample and the accuracy was examined by a variety of statistical tests, the suc-cess/failure ratio, the Kupiec-LR test, the two Christoffersen tests accounting for in-dependence and conditional coverage, the ESF1 and ESF2 measures, and the Dy-namic Quantile test of Engle and Manganelli. The main findings are:
242 Stavros Stavroyiannis and Leonidas Zarangas
that it approaches better the skewness and leptokurtosis of the PDF of financial assets returns and therefore, the underlying associated data generation process. Another issue is that, in contrast to the skewed Student-t distribution which is an artifact dis-tribution, the Pearson type-IV distribution describes the whole PDF using one func-tion resulting from a solid differential equafunc-tion, capable of transforming, according to the conditions, to the most common distributional schemes.
The Pearson type-IV distribution appears to perform better than the skewed Student-t at the Kupiec-LR test and the joint test of Christoffersen. However due to the small number of out of sample observations, it is difficult to judge the uncondi-tional Christoffersen test at high confidence levels, therefore the joint test has been left out of the comparison. In the Expected Shortfall measures and the DQ-test cases, the proposed model performs very well for the out of sample case as shown in Table 3.
243
Out of Sample Value-at-Risk and Backtesting with the Standardized Pearson Type-IV Skewed Distribution
References
Abramowitz, Milton, and Irene A. Stegun. 1965. Handbook of Mathematical Functions with Formulas, Graphs, and Mathematical Tables. Mineola: Dover Publications.
Artzner, Philippe, Freddy Delbaen, Jean-Marc Eber, and David Heath. 1997. “Thinking Coherently.” RISK, 10(11): 68-71.
Artzner, Philippe, Freddy Delbaen, Jean-Marc Eber, and David Heath. 1999. “Coherent Measures of Risk.” Mathematical Finance, 9(3): 203-228.
Ashton, David, and Mark Tippett. 2006. “Mean Reversion and the Distribution of United Kingdom Stock Index Returns.” Journal of Business Finance & Accounting, 33(9-10): 1586-1609.
Baillie, Richard T., Tim Bollerslev, and Hans Ole Mikkelsen. 1996. “Fractionally Integrated Generalized Autoregressive Conditional Heteroskedasticity.” Journal of Econometrics, 74(1): 3-30.
Bank for International Settlements - BIS. 1996. Supervisory Framework for the Use of “Backtesting” in Conjunction with the Internal Models Approach to Market Risk Capital Requirements. Basel: Bank for International Settlements.
Bank for International Settlements - BIS. 2006. International Convergence of Capital Measurement and Capital Standards – A Revised Framework. Basel: Bank for International Settlements.
Bhattacharyya, Malay,Abhishek Chaudhary, and Gaurav Yadav. 2008. “Conditional VaR Estimation Using the Pearson’s Type IV Distribution.” European Journal of Operational Research, 192(2): 386-397.
Bollerslev, Tim. 1986. “Generalized Autoregressive Conditional Heteroskedasticity.” Journal of Econometrics, 31(3): 307–327.
Bollerslev, Tim. 1987. “A Conditional Heteroskedastic Time Series Model for Speculative Prices and Rates of Return.” The Review of Economics and Statistics, 69(3): 542-547.
Bollerslev, Tim, and Hans Ole Mikkelsen. 1996. “Modeling and Pricing Long-Memory in Stock Market Volatility.” Journal of Econometrics, 73(1): 151-184.
Brännäs, Kurt, and Niklas Nordman. 2003. “Conditional Skewness Modeling for Stock Returns.” Applied Economics Letters, 10(11): 725-728.
Chen, Shaohua, and Hong Nie. 2008. “Lognormal Sum Approximation with a Variant of Type IV Pearson Distribution.” IEEE Communications Letters, 12(9): 630-632.
Chung, Ching-Fan. 1999. “Estimating the Fractionally Integrated GARCH Model.” http://idv.sinica.edu.tw/metrics/Pdf_Papers/Figarch.pdf.
Christoffersen, Peter F. 1998. “Evaluating Interval Forecasts.” International Economic Review, 39(4): 841-862.
Christoffersen, Peter F., and Denis Pelletier. 2004. “Backtesting Value-at-Risk: A Duration-Based Approach.” Journal of Financial Econometrics, 2(1): 84-108.
Davidson, James. 2004. “Moment and Memory Properties of Linear Conditional Heteroscedasticity Models, and a New Model.” Journal of Business & Economic Statistics, 22(1): 16-29.
De Grauwe, Paul. 2009. “The Banking Crisis: Causes, Consequences and Remedies.” Centre for European Policy Studies Policy Brief 178.
244 Stavros Stavroyiannis and Leonidas Zarangas
Developed and Emerging Equity Markets.” International Review of Financial Analysis, 20(3): 165-176.
Diebold, Francis X., and Jose A. Lopez. 1996. “Forecast Evaluation and Combination.”
Federal Reserve Bank of New York Research Paper 9525.
Doornik, Jurgen A. 2009. An Introduction to OxMetrics 6: A Software System for Data Analysis and Forecasting. London: Timberlake Consultants Ltd.
Drakos, Anastassios A., Georgios P. Kouretas, and Leonidas Zarangas. 2010. “Forecasting Financial Volatility of the Athens Stock Exchange Daily Returns: An Application of the Asymmetric Normal Mixture Garch Model.” International Journal of Finance & Economics, 15(4): 331-350.
Ding, Zhuanxin, Clive William John Granger, and Robert F. Engle. 1993. “A Long Memory Property of Stock Market Returns and a New Model.” Journal of Empirical Finance, 1(1): 83-106.
Engle, Robert F. 1982. “Autoregressive Conditional Heteroskedasticity with Estimates of the Variance of U.K. Inflation.” Econometrica, 50(4): 987-1008.
Engle, Robert F., and Tim Bollerslev. 1986. “Modelling the Persistence of Conditional Variances.” Econometric Review, 5(1): 1-50.
Engle, Robert F., and Simeone Manganelli. 1999. “CAViaR: Conditional Autoregressive Value at Risk by Regression Quantiles.” National Bureau of Economic Research Working Paper 7341.
Engle, Robert F., and Simeone Manganelli. 2004. “CAViaR: Conditional Autoregressive Value-at-Risk by Regression Quantiles.” Journal of Business & Economic Statistics,
22(10): 367-381.
Fama, Eugene F. 1965. “The Behavior of Stock Market Prices.” Journal of Business, 38(1): 34-105.
Fernandez, Carmen, and Mark F. J. Steel. 1998. “On Bayesian Modelling of Fat Tails and Skewness.” Journal of the American Statistical Association, 93(441): 359-371.
Fielitz, Bruce D. 1971. “Stationary or Random Data: Some Implications for the Distribution of Stock Price Changes.” Journal of Financial and Quantitative Analysis, 6(3): 1025-1034.
Gander, Walter, and Walter Gautschi. 2000. “Adaptive Quadrature – Revisited.” BIT Numerical Mathematics, 40(1): 84-101.
Giannellis, Nikolaos, Angelos Kanas, and Athanasios P. Papadopoulos. 2010.
“Asymmetric Volatility Spillovers between Stock Market and Real Activity: Evidence from the UK and the US.” Panoeconomicus, 57(4): 429-445.
Giot, Pierre, and Sébastien Laurent. 2003. “Value-at-Risk for Long and Short Trading Positions.” Journal of Applied Econometrics, 18(6): 641-664.
Glosten, Lawrence R., Ravi Jagannathan, and David E. Runkle. 1993. “On the Relation between the Expected Value and the Volatility of the Nominal Excess Return on Stocks.” The Journal of Finance, 48(5): 1779-1801.
Grigoletto, Matteo, and Francesco Lisi. 2009. “Looking for Skewness in Financial Time Series.” The Econometrics Journal, 12(1): 310-323.
Grigoletto, Matteo, and Francesco Lisi. 2011. “Practical Implications of Higher Moments in Risk Management.” Statistical Methods & Applications, 20(4): 487-506.
245
Out of Sample Value-at-Risk and Backtesting with the Standardized Pearson Type-IV Skewed Distribution
Hendricks, Darryll. 1996. “Evaluation of Value-at-Risk Models Using Historical Data.”
Economic Policy Review, 2(1): 39-70.
Huang, Yu Chuan, and Bor-Jing Lin. 2004. “Value-at-Risk Analysis for Taiwan Stock Index Futures: Fat Tails and Conditional Asymmetries in Return Innovations.” Review of Quantitative Finance and Accounting, 22(2): 79-95.
Jorion, Philippe. 2000. Value-at-Risk: The New Benchmark for Managing Financial Risk.
New York: McGraw-Hill.
Kupiec, Paul H. 1995. “Techniques for Verifying the Accuracy of Risk Measurement Models.” Journal of Derivatives, 3(2): 73-84.
Lambert, Philippe, and Sébastien Laurent. 2000. “Modelling Skewness Dynamics in Series of Financial Data.” Institut de Statistique Louvain-la-Neuve Discussion Paper 0119.
Laurent, Sébastien, and Jean-Philippe Peters. 2002. “G@RCH 2.2: An Ox Package for Estimating and Forecasting Various ARCH Models.” Journal of Economic Surveys,
16(3): 447–485.
Laurent, Sébastien. 2009. Estimating and Forecasting ARCH Models Using G@RCH 6.
London: Timberlake Consultants.
McMillan, David G., and Dimos Kambouroudis. 2009. “Are RiskMetrics Forecasts Good Enough? Evidence from 31 Stock Markets.” International Review of Financial Analysis, 18(3): 117-124.
Magdalinos, Michael A., and George P. Mitsopoulos. 2007. “Conditional
Heteroskedasticity Models with Pearson Family Disturbances.” In The Refinement of Econometric Estimation and Test Procedures, Finite Sample and Asymptotic Analysis,
ed. Garry Phillips and Elias Tzavalis, 1-33. Cambridge, MA: Cambridge University Press.
Mandelbrot, Benoit. 1963. “The Variation of Certain Speculative Prices.” Journal of Business, 36(4): 394-419.
Mandelbrot, Benoit. 1967. “The Variation of Some Other Speculative Prices.” Journal of Business, 40(4): 393-413.
Nagahara, Yuichi. 1999. “The PDF and CF of Pearson Type IV Distributions and the ML Estimation of the Parameters.” Statistics & Probability Letters, 43(3): 251-264.
Nagahara, Yuichi. 2004. “A Method of Simulating Multivariate Nonnormal Distributions by the Pearson Distribution System.” Computational Statistics and Data Analysis, 47(1): 1-29.
Nagahara, Yuichi. 2007. “A Method of Calculating the Downside Risk by Multivariate Nonnormal Distributions.” Asia-Pacific Financial Markets,15(3-4): 175-184.
Nelson, Daniel B. 1991. “Conditional Heteroskedasticity in Asset Returns: A New Approach.” Econometrica, 59(2): 347-370.
Pearson, Karl. 1893. “Contributions to the Mathematical Theory of Evolution (Abstract).”
Proceedings of the Royal Society of London, 54: 329–333.
Pearson, Karl. 1895. “Contributions to the Mathematical Theory of Evolution, II: Skew Variation in Homogeneous Material.” Philosophical Transactions of the Royal Society, 186: 343-414.
Pearson, Karl. 1901. “Mathematical Contributions to the Theory of Evolution - X.
246 Stavros Stavroyiannis and Leonidas Zarangas
Pearson, Karl. 1916. “Mathematical Contributions to the Theory of Evolution - XIX. Second Supplement to a Memoir on Skew Variation.” Philosophical Transactions of the Royal Society, 216: 429-457.
Pizzutilo, Fabio. 2012. “The Behaviour of the Distributions of Stock Returns: An Analysis of the European Market Using the Pearson System of Continuous Probability
Distributions.” Applied Financial Economics, 22(20): 1743-1752.
Premaratne, Gamini, and Anil K. Bera. 2005. “A Test for Symmetry with Leptokurtic Financial Data.” Journal of Financial Econometrics, 3(2): 169-187.
Scaillet, Oliver. 2000. “Nonparametric Estimation and Sensitivity Analysis of Expected Shortfall.” Mathematical Finance, 14(1): 115-129.
Shampine, Lawrence F. 2008. “Vectorized Adaptive Quadrature in MATLAB.” Journal of Computational and Applied Mathematics, 211(2): 131–140.
Stambaugh, Fred. 1996. “Risk and Value at Risk.” European Management Journal, 14(6): 612-621.
Stavroyiannis, Stavros, Ilias A. Makris, Vasilios N. Nikolaidis, and Leonidas Zarangas.
2011. “Value-at-Risk for the Long and Short Trading Position with the Pearson Type-IV Distribution.” Paper presented at the Business and Economics Society International Conference, Split.
Stavroyiannis, Stavros, Ilias A. Makris, Vasilios N. Nikolaidis, and Leonidas Zarangas.
2012. “Econometric Modeling and Value-at-Risk Using the Pearson Type-IV Distribution.” International Review of Financial Analysis, 22: 10–17.
Subbotin, Mikhail F. 1923. “On the Law of Frequency of Error.” Matematicheskii Sbornik, 31: 296-301.
Tang, Ta-Lun, and Shwu-Jane Shieh. 2006. “Long Memory in Stock Index FuturesMarkets: A Value-at-Risk Approach.” Physica A, 366: 437-448.
Tse, Yiu Kuen. 1998. “The Conditional Heteroskedasticity of the Yen-Dollar Exchange Rate.” Journal of Applied Econometrics, 193: 49-55.
Tsiotas, Georgios. 2012. “On Generalised Asymmetric Stochastic Volatility Models.”
Computational Statistics & Data Analysis, 56(1): 151-172.
247
Out of Sample Value-at-Risk and Backtesting with the Standardized Pearson Type-IV Skewed Distribution
Appendix
Table 1 Pearson-IV GARCH Model (Optimization Results)
Pearson IV Skewed student
0.0499 0.0521
(4.489) (4.683)
0.0071 0.0071
(3.573) (3.563)
0.0665 0.0665
(8.568) (8.466)
0.9279 0.9280
(114.2) (113.1)
m 7.6832 7.4255
(9.439) (9.869)
0.8819 -0.0620
(3.229) (-3.233)
+ 0.9944 0.9945
Source: Authors’ calculations.
Table 2 In Sample Results with the Standardized Pearson Type-IV Distribution
SHORT POSITION
Quantile Success ratio
LR Kupiec
p-value Kupiec
LR independence
p-value independence
LR conditional
p-value
conditional ESF1 ESF2 DQ statistics
DQ p-value
0.95000 0.94840 0.26679 0.60549 3.96082 0.04657 4.22762 0.12078 2.0981 1.2708 10.543 0.10357
0.97500 0.97680 0.68074 0.40933 0.03573 0.85008 0.71647 0.69891 2.5376 1.2120 3.3847 0.75923
0.99000 0.99240 3.17187 0.07492 0.00000 1.00000 3.17187 0.20476 3.3969 1.1576 8.2979 0.21708
0.99500 0.99640 2.18370 0.13948 0.00000 1.00000 2.18370 0.33560 3.6705 1.1092 3.0639 0.80078
0.99750 0.99900 5.84837 0.01559 0.00000 1.00000 5.84837 0.05371 3.2126 1.0859 11.287 0.079914
0.99900 0.99980 4.78433 0.02872 0.00007 0.99315 4.78440 0.09143 2.9581 1.0531 16.004 0.013731
LONG POSITION
Quantile Failure ratio LR Kupiec p-valueKupiec LRindependence independence p-value LR conditional p-valueconditional ESF1 ESF2 DQstatistics DQ p-value
0.05000 0.05140 0.20452 0.65110 1.75092 0.18576 1.95544 0.37617 -2.2340 1.4314 6.6047 0.35895
0.02500 0.02760 1.34212 0.24666 0.35984 0.54859 1.70197 0.42699 -2.5981 1.3354 6.8908 0.33107
0.01000 0.01020 0.02007 0.88734 0.00000 1.00000 0.02007 0.99002 -3.0746 1.3441 2.4224 0.87705
0.00500 0.00600 0.94432 0.33117 0.00000 1.00000 0.94432 0.62365 -3.5755 1.3108 5.3627 0.49820
0.00250 0.00300 0.47090 0.22716 0.00000 1.00000 1.45854 0.48226 -3.9711 1.2819 17.072 0.00902
0.00100 0.00120 0.18806 0.66454 0.00000 1.00000 0.18806 0.91026 -5.2067 1.3966 0.20317 0.99984
Source: Authors’ calculations.
Table 3 Out of Sample Results with the Standardized Pearson Type-IV Distribution SHORT POSITION
Quantile Success ratio
LR Kupiec
p-value Kupiec
LR independence
p-value independence
LR conditional
p-value
conditional ESF1 ESF2 DQ statistics
DQ p-value 0.95000 0.95079 0.016793 0.89689 0.00000 1.00000 0.01679 0.99164 2.6132 1.3004 7.3720 0.28781 0.97500 0.97540 0.0081823 0.92792 0.00000 1.00000 0.00818 0.99592 3.1397 1.2301 3.3732 0.76076
0.99000 0.99048 0.029325 0.86403 0.00000 1.00000 0.02932 0.98544 4.5295 1.1735 7.4767 0.27900
0.99500 0.99444 0.075438 0.78358 0.00000 1.00000 0.07544 0.96298 4.3124 1.0955 0.27243 0.99962
0.99750 0.99921 2.0089 0.15638 0.00029 0.98635 2.00916 0.36620 10.508 1.0585 4.6302 0.59203
0.99900 1.00000 NaN 0.00000 1.00000 0.31731 NaN NaN NaN NaN 3.8e+30 0.00000
LONG POSITION
Quantile Failure ratio
LR Kupiec
p-value Kupiec
LR independence
p-value independence
LR conditional
p-value
conditional ESF1 ESF2 DQ statistics
DQ p-value 0.05000 0.064286 4.9850 0.025568 0.0099013 0.92074 4.99488 0.08230 -2.63631.4200 14.700 0.022725
0.02500 0.034921 4.5374 0.033162 0.2286530 0.63252 4.76606 0.09227 -2.88201.3206 15.153 0.019097
0.01000 0.015079 2.8411 0.091882 0.0000000 1.00000 2.84109 0.24158 -3.16111.2384 5.1491 0.52484
0.00500 0.0063492 0.42458 0.51466 0.0000000 1.00000 0.42458 0.80873 -3.51391.2558 0.62868 0.99590
0.00250 0.0015873 0.48403 0.48660 0.0000003 0.99953 0.48403 0.78504 -2.66441.5235 0.67846 0.99494
0.00100 0.00079365 0.057830 0.80996 0.0002925 0.98635 0.05812 0.97136 -3.3488 1.7123 0.071665 0.99999
248 Stavros Stavroyiannis and Leonidas Zarangas