Belonging to Four Genera of the Lauraceae Family
Lin Li1, Wan Hui Ye2*, Shi Guang Wei1*, Ju Yu Lian2, Zhong Liang Huang2
1Guilin University of Electronic Technology, Guilin, China,2South China Botanical Garden, Chinese Academy of Science, Guangzhou, China
Abstract
Spatial distribution pattern of biological related species present unique opportunities and challenges to explain species coexistence. In this study, we explored the spatial distributions and associations among congeneric species at both the species and genus levels to explain their coexistence through examining the similarities and differences at these two levels. We first used DNA and cluster analysis to confirmed the relative relationship of eight species within a 20 ha subtropical forest in southern China. We compared Diameter at breast height (DBH) classes, aggregation intensities and spatial patterns, associations, and distributions of four closely related species pairs to reveal similarities and differences at the species and genus levels. These comparisons provided insight into the mechanisms of coexistence of these congeners. O-ring statistics were used to measure spatial patterns of species.V0–10, the mean conspecific density within 10 m of a tree, was used as a measure of the intensity of aggregation of a species, and g-function was used to analyze spatial associations. Our results suggested that spatial aggregations were common, but the differences between spatial patterns were reduced at the genus level. Aggregation intensity clearly reduced at the genus level. Negative association frequencies decreased at the genus level, such that independent association was commonplace among all four genera. Relationships between more closely related species appeared to be more competitive at both the species and genus levels. The importance of competition on interactions is most likely influenced by similarity in lifestyle, and the habitat diversity within the species’ distribution areas. Relatives with different lifestyles likely produce different distribution patterns through different interaction process. In order to fully understand the mechanisms generating spatial distributions of coexisting siblings, further research is required to determine the spatial patterns and associations at other classification levels.
Citation:Li L, Ye WH, Wei SG, Lian JY, Huang ZL (2014) Spatial Patterns and Associations between Species Belonging to Four Genera of the Lauraceae Family. PLoS ONE 9(11): e111500. doi:10.1371/journal.pone.0111500
Editor:Helge T. Lumbsch, Field Museum of Natural History, United States of America ReceivedMay 27, 2014;AcceptedSeptember 30, 2014;PublishedNovember 3, 2014
Copyright:ß2014 Li et al. This is an open-access article distributed under the terms of the Creative Commons Attribution License, which permits unrestricted use, distribution, and reproduction in any medium, provided the original author and source are credited.
Data Availability:The authors confirm that, for approved reasons, some access restrictions apply to the data underlying the findings. The paper used Lauraceae data to research, these data are held by Headquarters of Chinese Forest Biodiversity Monitoring Network(third party), Beijin city. Researchers interested in this data should apply to ‘‘Chinese Forest Biodiversity Monitoring Network’’ for the Lauraceae data. The name of the individual that readers may contact to request the data: Xue H. Xu, email: [email protected], Chinese Forest Biodiversity Monitoring Network, website: www.cncdiversitas.org.
Funding:This work was funded by the National Nature Science Foundation of China (31200326, 31200412, 31460155), The Project of Scientific Research and Technological Development of GuangXi (No.gkg1140002-2-4), and the Knowledge Innovation Project of the Chinese Academy of Sciences (KSCX2-EW-Z). The funders had no role in study design, data collection and analysis, decision to publish, or preparation of the manuscript.
Competing Interests:The authors have declared that no competing interests exist. * Email: [email protected] (WHY); [email protected] (SGW)
Introduction
The spatial distribution of species and inter-species interactions provide fundamental information for understanding species structures and coexistence in communities. One major focus of ecological research is to reveal the outcome of the interactions of biological and ecological processes by analyzing spatial distribu-tion patterns and associadistribu-tions [1–5]. For instance, a recent study [6], which simulated spatial processes of seed dispersal and habitat association found that niche- and neutral-based interactive operations may have important roles in generating spatial patterns. Furthermore, spatial distribution of species can essen-tially be used to understand and model biodiversity patterns over space [7–13]. For example, Pofessor He and Legendre [11] and Green and Ostling [14] interpreted relationships based on the spatial patterns of individuals within their distribution and endemic-range, respectively. Most studies have utilized statistical analyses of species data to reveal processes and phenomena
explaining species coexistence mechanisms. Gotelliet al.[15] used
a general simulation model to explain the patterns and causes of
species richness. The simulation approach offers new insights into the origin and maintenance of species richness patterns, combined with contemporary climate, evolutionary history and geometric
constraints on global biodiversity gradients [15]. Rahbeket al.[16]
found correlative climatic models substantially underestimate the importance of historical factors and small-scale niche-driven assembly processes in shaping contemporary species-richness patterns.
light requirements with life-form differences may contribute to the coexistence of the Acer species in old-growth forests [21]. Partitioning of the topographic and light environments was verified may double or treble the number of species able to coexist, but no evidence that partitioning of physical habitats can explain the coexistence of these closely related species [22].
Many ecologist and evolutionary biologists devote themselves to addressing the following questions: One is what factors drive the relative distribution of congeneric trees within the same commu-nity. Competitive ability is known to influence distribution patterns of species. Species with stronger competitive ability may retain more individuals than others species, a species’ relative abundance is positively related to its competitive ability modeled by Du [23]. Also competition and facilitation can structure plant distribution and assemblages [24]. Additionally, the distributions of two strongly repulsed species within the same community usually differ. A second question is why does the abundance of coexisting sibling trees tend to differ? The literature on plant rarity often speculates that rare species are poor competitors [25,26], resulting in their reduced abundance. Though some rare species may have low competitive ability, it should not be assumed as the cause of rarity for all rare species [27]. In fact, other studies have attributed superior competitive ability to rare species [28,29]. The conclu-sions of these studies were based on a consensus that competition exists between congeneric trees and that competitive ability and action differ with spatial distribution patterns and abundance. Furthermore, habitat is most likely another important factor influencing congener distributions [30]. Large plots provide the basic element for the study of congener coexistence. A study of a 52 ha tropical rain forest plot in Borneo found habitat heteroge-neity (light, established micro sites, and soil textural properties) lead to differences in tree distribution patterns, and played important roles in their species coexistence [31]. However, another 50 ha tropical plot revealed no strong evidence of a relationship between partitioning of physical habitat and 16 coexisting sibling species belonging to the family Myristicaceae [22].
Most previous research on spatial patterns and associations of related species has been performed at the species level, but biological function is influenced at multiple levels. Therefore, studies on species interactions at different levels are required. While there are little is known about species interactions at multiple levels so far. Study in tropical of Myristicaceae tree seedlings in two separate taxonomic level (species and genus) analyses were hinted that different mechanisms of coexistence among tropical tree taxa may function at different taxonomic or phylogenetic scales [32]. Here, we studied the family Lauraceae which is made up of a large number of genetically-related species. Lauraceae is also a family with a long history in East Asia. We compared the population structure, spatial patterns and associa-tions of eight congeneric species within a large (20 ha) subtropical forest. Our objectives involved answering the following questions: (1) Do genetic relationships at the species or genus level influence the population structure of coexisting species? (2) What mecha-nisms control spatial distributions and associations and how do they change with scale, genetic relationship or habitat heteroge-neity? (3) Do patterns in aggregation intensity response to Diameter at Breast Height (DBH) differ at the species and genus level? Finally we discuss mechanisms of coexistence among genetically related species at different relationship levels, and in different forests. This analysis will contribute to the understanding of congeneric species coexistence and diversity maintenance in subtropical forests.
Methods
Ethics Statement
No specific permits were required for the described field studies. The study site Dinghusan plot (DHS plot) is owned by the Chinese government and the Chinese Forest Biodiversity Monitoring Network, DHS plot is managed by South China Botanical Garden, Chinese Academy of Sciences. We can do our research works freely in these plots under the Regulations of the People’s Republic of China on Nature Reserves. Our field studies did not involve endangered or protected species.
Study Site
The study area was located in the Dinghushan Mountain
(112u309390–112u339410E, 23u099210–23u119300N) in Guangdong
Province. Dinghushan was the first Nature Reserve established in China in 1956 and has been significantly important to the conservation of forest ecosystems over the past 50 years [33]. The reserve is covered by tropical-subtropical forests and is comprised of low mountains and hilly landscapes. Its total area is 1155 ha, with an altitude of 14.1–1000.3 m. Dinghushan has a south subtropical monsoon climate with a mean annual temperature of
20.9uC, and a mean monthly temperature of 12.6uC in January
and 28.0uC in July. Average annual precipitation is 1929 mm,
with most of the precipitation occurring between April and September. Annual evaporation is 1115 mm and relative humidity 82%.
A permanent 20 ha (4006500 m) plot called the Dinghushan
plot (DHS plot) was established in the Dinghushan reserve in November 2004. Mapping of the plot mainly took place from January to March, but was completed in October 2005. Following the field protocols of the Center for Tropical Forest Science (CTFS), to identify, measure and map the trees, including all free standing trees and shrubs of at least 1 cm in DBH, we used the same methodology as in [34],The plot features rough terrain with a steep hillside in the southeast corner. Topography varies with ridge and valley in the plot and the elevation ranges from 240 to 470 meters. There were 56 families, 119 genera, 210 species and 71617 individuals counted in the first census. Thirty of the identified species were composed of solitary individuals and 110 species were made up of fewer than 20 individuals. The most
abundant speciesAidia canthioidesowned 5996 individuals. Mean
stand density was 3580.85 living trees and shrubs per hectare.
Mean basal area was 28.24 cm2per ha [33].
Study Species
The Lauraceae family is made up of about 45 genera and 2000 to 2500 species. Almost all of these species are native to tropical and subtropical regions, with the distribution centers in Southeast Asia and Brazil. As a typical subtropical forest plot, the DHS plot has 19 species of Lauraceae belonging to 5 genera. Considering the species abundance and genetic relationship distance, eight
focus species (abundance .200 each species) belonging to 4
genera, were chosen for comparisons of population structure and spatial patterns in this study. The selected species were
Cryptocarya concinna (CRCO), Cryptocarya chinensis (CRCH),
Lindera metcalfiana (LIME), Lindera chunii (LICH), Machilus breviflora (MABR), Machilus chinensis (MACH), Neolitsea um-brosa(NEUM) andNeolitsea membranaceum(NEME).
Data Analysis
We used the relative neighborhood density index Vr to
characterize the distribution of eight Lauraceae species found in
species evaluated, and is calculated asVr~Dr=l[8],lis the mean density of a given species across the whole plot. Where
Dr~PNr=PAr, Ar is the area of annulus at distance r and
Nris the number of conspecifics within the annulus. In this study
the annulus width is 10 m. Therefore, Dr is the density of
conspecifics as a function of distancer,lis the mean density of a
given species across the whole plot. A Monte Carlo simulation (999 iterations) was used to test the hypothesis that a distribution is
not significantly different from a random distribution, i.e.,Vr = 1.
If the observed Vr fell within the 2.5th (bottom dash-line) and
97.5th (top dash-line) quartiles, the null hypothesis was not rejected, and the species distribution within the DHS plot was concluded to be significant randomly distribution [35]. If the
observed Vr located above the top dash-line, it indicates the
significant aggregation distribution. If the observed Vr located
below the bottom dash-line, it indicates the significant regular distribution.
We used DNA test results to perform cluster analysis, to quantify the genetic relationships among the species examined and accordingly group the species. DNA sequences were generated for 1–2 tagged individuals located within the DHS plot. Genomic DNA was extracted from leaf and/or bark tissue using a standard CTAB protocol [36]. We used the relative neighborhood density
Vr to assess spatial patterns and V0–10, the mean conspecific
density within 10 m of a tree, as a measure of the intensity of aggregation of a species [8]. And then we compared spatial intensity of aggregations of trees of different DBH classes at species and genus levels. The DBH classes were binned at 2 cm intervals. Growth type, shade tolerance and life history traits rooted in empirical data from field investigation personnel with long-term experience.
Finally we used bivariate pair-correlation function (g12(r)) to
analyze spatial associations among and between species (within the
four genera). The bivariate pair-correlation function g12(r) is the
analogy to Ripley’sK12(r) [37], but it replaced the circles of radius
rby rings with radiusr. The functiong12(r) quantifies the type of
spatial association between species 1 species 2:
g12(r)~ dK12(r)
2prdr
For a bivariate pattern of two objective species, g12(r) = 1
indicates non-association (independence), at distance r, and
g12(r).1 indicates a positive association between the two species
at given distance r, whereasg12(r),1 indicates a negative spatial
interaction (spatial repulsion or segregation) between the two
species at distancesr[38]. Here the annulus width r is 10 meters.
Results
Population Structure
The abundance of the eight study species ranged from 223 individuals of NEME to 4478 of CRCO (Table 1). Total numbers
of individuals were 13362. Two Cryptocaryaspecies were much
more abundant than theLindera,MachilusandNeolitseaspecies.
The total abundance ofCryptocaryawas also much greater than
for the other three genera. The basal areas of CRCH and MACH were much larger than for the other species.
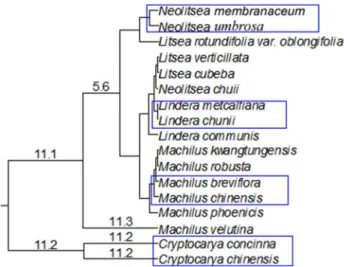
Cluster analysis for DNA test results showed the closest relative of each of the eight species was within the same genus (Fig. 1). However, the degree of within genus species relatedness differed
among the four genera. Relatedness was greatest forLinderaand
Machilus, thenNeolitsea, followed byCryptocarya. Table
At the species level, eight species showed different size class distributions (Fig. 2). Using a DBH of 2 cm to compare individual’s structure of congeneric species, we found CRCO and CRCH were distinctly different. Individuals of CRCO tended to have DBH less than 4 cm and mostly were aggregated within the range of 1 to 2 cm DBH. CRCH, MABA and MACH were liked a reversed DBH J-shaped distribution. LIME, LICH, NEUM and NEME were liked a DBH L-shaped distribution. At
the genera level,Cryptocarya,LinderaandNeolitseahad a distinct
L-shaped DBH distribution (Fig. 3). Machilus had a larger
number of big trees than the other three genera, and showed like a reversed J-shaped DBH distribution.
Spatial Patterns
The eight study species showed aggregation patterns in the DHS plot (Fig. 4), especially at small scales. CRCO, CRCH, LIME and LICH showed patterns of aggregation at scales 0– 200 m, then became random, and then regular patterns as scale increased (Fig. 4). MABR and MACH showed significant aggre-gated patterns at scales of 0–150 m, which then became random, then regular with increasing spatial scale. NEUM and NEME were clumped at scales less than 175 m, then NEUM became
random and quickly showed regular patterns at scales .180 m.
NEME, on the other hand, had a random distribution at scales of 175–200 m, then became regular as scale increased (Fig. 4).
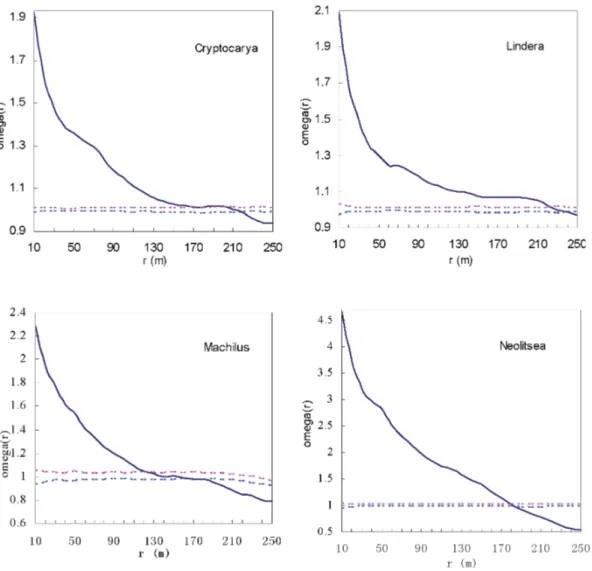
When examined at the genera level, the differences in spatial patterns were reduced. The four genera showed similar tendencies (Fig. 5). Aggregation patterns were at small and middle scales (Cryptocarya,200 m, Lindera,220 m, Machilus,160 m and
Neolitsea,180 m), then random and then regular at larger scales, corresponding to their spatial pattern in the plot (Fig. 5).
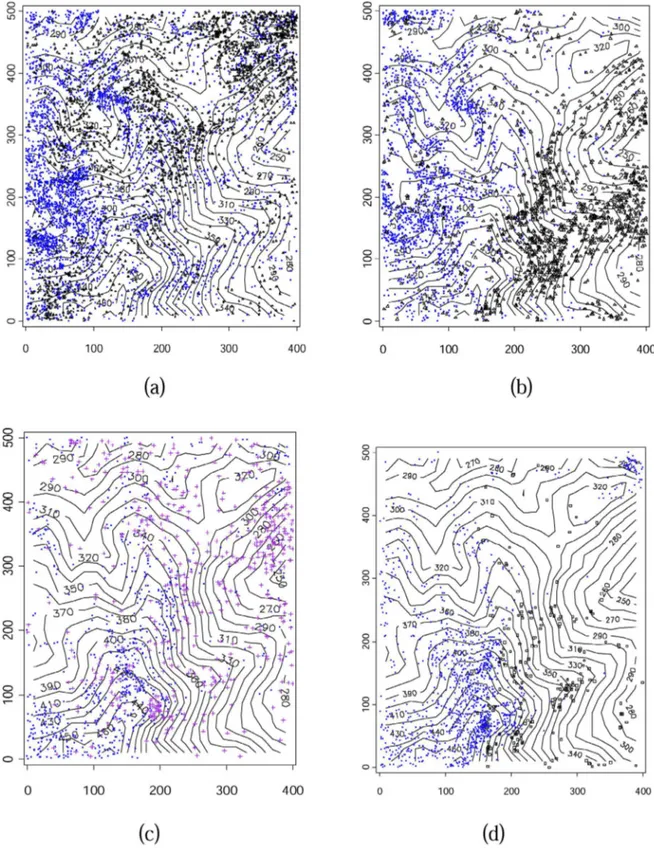
Each species’ spatial distribution corresponded with its spatial patterns within the plot (Fig. 6). CRCO and CRCH were relatively widely distributed throughout entire plot, and, though their distributions did not overlap at small spatial scale, the distribution of each complemented the other at middle to large spatial scales. LIME was located mainly in the western part of the plot, whereas LICH was in the eastern part, and thus spatially not overlapping. MABR and MACH were mosaicly distributed at small to middle spatial scales. MABR was abundant at the top of mountain, located in the southwest corner of plot, and small
Figure 1. Genetic relationships of Lauraceae species. The numbers related clustering coefficient. The eight species enclosed within rectangles are the same species in Table 1.
doi:10.1371/journal.pone.0111500.g001
Figure 2. Size (DBH) class of the eight Lauraceae species belonging to four genera.
doi:10.1371/journal.pone.0111500.g002
Figure 3. Size (DBH) class of the four genera including species from Table 1.
numbers of MACH existed in complement space with MABR. NEUM was concentrated in the southwest whereas NEME was in the southeast corner, and thus the distribution of both was nearly
distinct. Cryptocarya and Lindera were distributed widely
throughout the plot, whereas Machilus and Neolitsea were
relatively concentrated in the southern part of the plot,Neolitsea
was especially rare in the northern part of the plot.
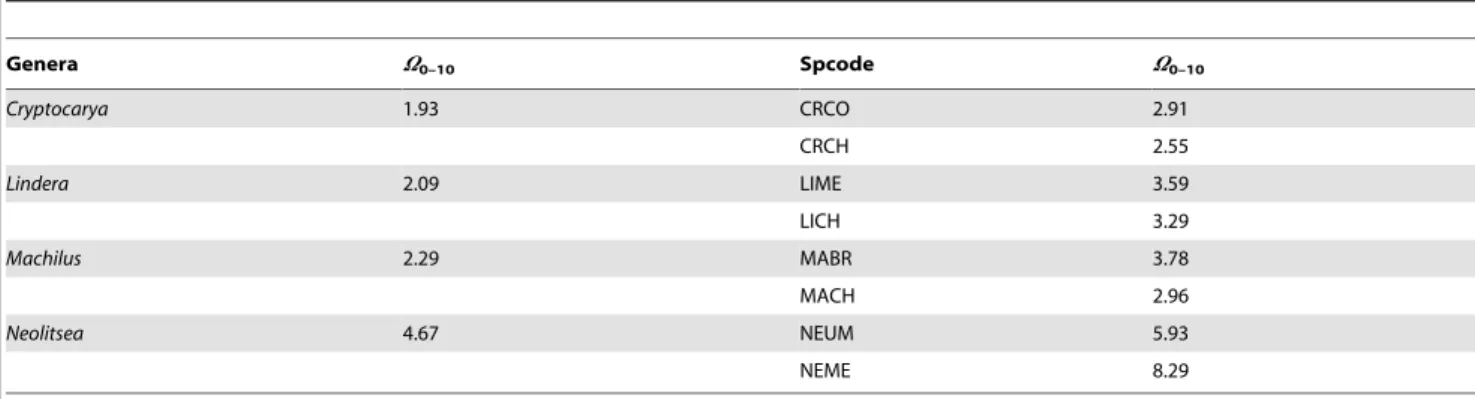
Aggregation Intensity at Species and Genera Levels
The aggregation intensity as measured by V0–10 clearly
decreased from the species to the genus level (Table 2). For
example,Cryptocarya(V0–10= 1.93) was lower than that of species
CRCO (V0–10= 2.91) and CRCH (V0–10= 2.55). The other three
genera displayed similar trends.Cryptocaryahad the lowestV0–10
and Neolitsea (V0–10= 4.67) had the highest V0–10 of the four
genera. Species of all four genera showed tendencies of congeneric species aggregations within parts of the plot. Though the locations of the aggregates differed with species, individuals from different
species inside congeners were fewer overlapped distribution (Fig. 6).
Relationship between Aggregation Intensity and DBH at the Genera Level
Where more than 50 individuals made up a DBH class,V0–10
was examined (Fig. 7). Results showed differences in the change in
V0–10 with DBH group between Cryptocarya and Machilus.
Although aggregation intensity of these two genera similarly tended to decrease from small to large DBH, the curves differed.
Cryptocaryashowed a wavelike decrease, compared toMachilus, appeared to linearly decrease with increasing DBH.
Spatial Associations
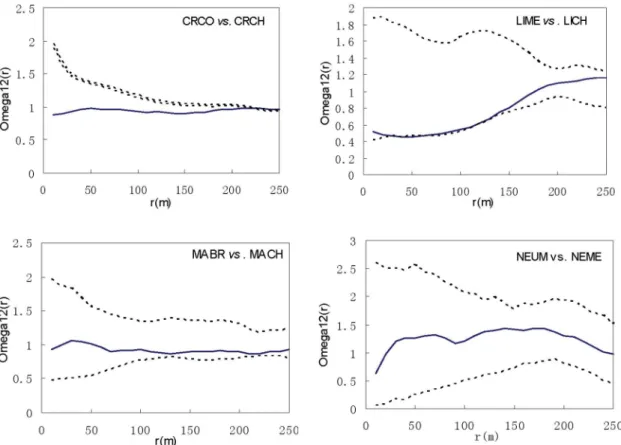
Spatial associations of the four pairs of closely relative species showed no positive associations (Fig. 8). CRCO and CRCH were exceptionally negatively associated until scales greater than 210 m. LIME and LICH showed a negative association at scales of
Figure 4. Spatial patterns of eight Lauraceae species.The solid line curve is theVrvalue. Dashed lines correspond to the confidence intervals
generated from 999 Monte Carlo simulations under the null hypothesis of complete spatial randomness. See Table 1 for Species codes. doi:10.1371/journal.pone.0111500.g004
Figure 5. Spatial patterns of the four genera of Lauraceae species.The solid line curve is theVrvalue. Dashed lines correspond to the confidence intervals generated from 999 Monte Carlo simulations under the null hypothesis of complete spatial randomness.
20–140 m. The other two pairs were independently distributed within the plot at every spatial scale.
Independent association was commonplace among four genera (Fig. 9). Genera pairs were showed independent association,
except forCryptocaryaandLinderawere positively distributed at
scale,40 m, andMachilusandNeolitseawere showed positively
association at scale,60 m.
Figure 6. Spatial distribution of the eight species belonging to four genera in relation to the topography of the DHS plot.(a)
Cryptocarya, dots represent CRCO and triangles represent CRCH; (b)Lindera, dots represent LIME and triangles represent LICH; (c)Machilus, circles represent MABR, crosses represent MACH. (d)Neolitsea, dots represent NEUM and triangles represent NEME.
Discussion
The spatial distribution patterns of closely related congeneric trees in subtropical forests have important implications for how species interact with each other and their performance at different genetic levels. Closely related congeneric species originate from a common ancestor and, because they share many similar pheno-typic and ecological traits, they tend to utilize a similar set of resources in similar ways. Therefore, they may exhibit relatively intense interspecific competition that limits their coexistence [23,29]. The spatial distributions of and associations between the four closely relative pairs studied here suggested that closer related species would repel each other when resources are limited. The degree of competition between species pairs, would be dependent on the similarities in their lifestyles [15], and also be subject to the diversity of habitat and small-scale niche-driven assembly processes in shaping contemporary species-richness patterns within their distribution area [16]. Relatives with different lifestyles would produce different distribution patterns through different
interac-tion processes.CRCO and CRCH, and LIME and LICH were
showed a negative association at most scales within the sampled plot (Fig. 8). These two closely relative pairs showed inter-specific competition in that they had different spatial distribution patterns (Fig. 6).
Long term natural selection may have driven relative trees to develop different, but mutually beneficial lifestyles resulting in mutual attraction. Congeneric trees are commonly found to
coexist within different communities [21,22]. There is evidence that congeneric species can coexist if traits have diverged within the genus. When traits have diverged within the genus, the niche overlap is reduced and competition relaxed, thus allowing the coexistence of congeneric species [39]. Also, genetic differences at the subspecies level might lead to genetic subgroups taking advantage of environmental specialization, affecting spatial distribution above the species level [40]. Habitat is most likely another important factor influencing congener distributions [30]. Light, established micro sites, and soil textural properties played important roles in tree distribution patterns, and in their coexistence [31]. Habitat specialization plays an important role in maintaining the diversity of this species-rich subtropical forest. Former study found 83% of the species were related to topographic variables [41].
Inter-specific differences and ontogenetic shifts led to the law of spatial patterns and associations changed from genus level to species level. Aggregated distributions of species is a widespread pattern in nature, observed in both tropical plant communities with diverse species and temperate plant communities with relatively few species [10,42,43,44]. Four genera provided further evidence of clumped patterns both at species and genera levels in a subtropical forest. Eight species showed significant aggregation patterns, especially at small scales (Fig. 4 and Fig. 6). At the genus level, differences in spatial patterns were reduced, and significant aggregation patterns existed at small and middle spatial scales (Fig. 5). The aggregation intensity varied among species (or
Table 2.StatisticV0–10of eight Lauraceae species at the species and genus level (Mixed congeneric species individuals).
Genera V0–10 Spcode V0–10
Cryptocarya 1.93 CRCO 2.91
CRCH 2.55
Lindera 2.09 LIME 3.59
LICH 3.29
Machilus 2.29 MABR 3.78
MACH 2.96
Neolitsea 4.67 NEUM 5.93
NEME 8.29
doi:10.1371/journal.pone.0111500.t002
genera), and reduced at the genus level. Furthermore, aggregation intensity of congeneric individuals was much lower than for species within genera. Though the four congeneric species pairs displayed different biotic or abiotic processes to enhance or attenuate their drive to repulse each other, then formed current pattern. Repulsive interactions among relatives were seen through decreased aggregation intensity at the genera level (Table 2).
The mechanisms behind species coexistence has been explored at the species level and rarely above or below species level. Indeed the genetic influences at the species level produced a qualitative change in species distribution. However, the genetic influence was not restricted to the species level. From individual, to species, to genera and even to higher levels, genetic influences and variation from natural selection must affect species coexistence. Results differed at different levels. Therefore, information from more levels is required to understand species coexistence mechanisms. For example, a sub-species level analysis found genetic subgroups ofCastanopsis chinensisthat showed environmental specialization; a species level analysis would not have detected this association [40].
To our knowledge, the present study is the first to trace interactions between and distributions of congeneric species at both the species and genus levels, with the aim of explaining their coexistence through examining the similarities and difference at these two levels. In our study, this was specifically achieved through comparisons of DBH classes, aggregation intensities and spatial patterns, associations and distributions of eight Lauraceae species at both the species and genus levels. DBH structure was more stable at the genus than species level. Individuals at both levels were aggregated, while aggregation intensity at the genus
level was lower than for species within genera. Previous studies have found aggregation intensity to clearly decrease with DBH in DHS plot [35]. Here we also found aggregation intensity at the genus level tended to decrease from small to large DBH. Spatial associations within genera showed no positive associations, with two pairs (CRCO and CRCH, LIME and LICH) possessing negative associations. Associations among genera were almost never negative, often independent, but sometimes positive (e.g.,
CryptocaryaandLinderaandMachilusandNeolitsea) at the same spatial scales. As the level of examination increases from species to genus level, the negative associations become less common due to increasingly distant relationships between the compared groups.
Former studies of congeneric species interactions focused on testing and verifying whether or not interspecific competition existed. The conditions, such as resource availability and number of potential competitors, required to produce competitive relationship have been neglected up to now. Perhaps competition appeared more frequently in high than low diversity communities because a large number competitors for single resource units lead to significant competition. Studies in tropical forest communities showed interspecific competition should be much stronger among congeneric species, especially at small scales [20,45]. In subtropical forest no positive spatial associations within genera and two pairs of negative associations were found. In the central Aegean archipelago strong evidence for widespread competition among congeneric species were not found, and most communities investigated show no significant patterns of species associations [46]. Temperate plant communities with few species showed slightly negative associations at small scales, indicating interspecific competition, few species pairs showed positive associations [47].
Figure 8. Spatial associations between Lauraceae species within genera.Solid line curve represents theVrvalue. Dashed lines correspond
There maybe sufficient resources for the coexistence of congeneric species in low diversity communities with relatively homogeneous environmental conditions. Among general congeneric species pairs no negative associations occurred, and even some positive correlations were reported [47].
Conclusion
From the study of eight Lauraceae species at genus and species level, we compared DBH classes, aggregation intensities and spatial patterns, associations and distributions of four pairs of these related species at both the species and genus level, to reveal similarities and differences at the two levels of relatedness. In conclusion, spatial aggregations were common, and the differences in spatial patterns were reduced at genus, relative to species level. The aggregation intensity clearly reduced at the genus level, the
V0–10value of all four genera was lower than theV0–10value of
the species within each genera. Aggregation intensity decreased with increasing DBH both at the species and genus levels, but due to the differences in DBH structure and growth type, the pattern of aggregation intensity change with DBH differed between individ-uals of two genera. Spatial associations between the four pairs of closely relative species showed no positive associations, and two pairs showed significant negative associations at several scales. The frequency of negative associations decreased at genus relative to species level, and independent associations were common among the four genera. Negative association illustrated competitive effect were existed in these negatively correlated relative species, however, coexistence mechanism of relative species at different levels was really a very complicated question. It’s a good start, in order to fully understand the mechanisms generating distribution patterns of coexisting sibling trees, further investigation into
Figure 9. Spatial associations among genera of Lauraceae species.The Solid line curve represents theVrvalue. Dashed lines correspond to
interactions between coexisting relatives at scales ranging from subspecies to families is required, and even in combination with ecological and life-history data and experimental data.
Acknowledgments
We are grateful to many individuals who contributed to the field survey of the DHS plot.We thank the Chinese Forest Biodiversity Monitoring Network. We thank Professor Fangliang He of University of Alberta, Dr. I Fang Sun of National Dong Hwa University, Dr. Richard Condit of CTFS,
Dr. Pierre Legendre of University of Montreal for training of data analysis. We would also like to thank Dr. Christine Verhille at the University of California for her assistance with English language and grammatical editing of the manuscript.
Author Contributions
Conceived and designed the experiments: WHY. Performed the experi-ments: ZLH JYL. Analyzed the data: SGW. Contributed to the writing of the manuscript: LL.
References
1. He FL, Duncan RP (2000) Density-dependent effects on tree survival in an old-growth Douglas fir forest. J Ecol 88.
2. Janzen DH (1970) Herbivores and the number of tree species in tropical forests. Am Nat 104: 501–528.
3. Connell JH (1971) On the role of natural enemies in preventing competitive exclusion in some marine animals and in rain forest trees. In: Den Boer PJ, Gradwell GR, editors. Dynamics of Numbers in Populations. Wageningen: Center for Agricultural Publication and Documentation. pp. 298–312. 4. Sterner RW, Ribic CA, Schatz GE (1986) Testing for life historical changes in
spatial patterns of four tropical tree species. J Ecol 74: 621–633.
5. Kenkel NC (1988) Patten of self-thinning in jack pine: testing the random mortality hypothesis. Ecology 69: 1017–1024.
6. Lin YC, Chang LW, Yang KC, Wang HH, Sun IF (2011) Point patterns of tree distribution determined by habitat heterogeneity and dispersal limitation. Oecologia 165: 175–184.
7. Hubbell SP (1979) Tree dispersion, abundance, and diversity in a tropical dry forest. Science 203: 1299–1309.
8. Condit R, Ashton PS, Baker P, Bunyavejchewin S, Gunatilleke S, et al. (2000) Spatial patterns in the distribution of tropical tree species. Science 288: 1414– 1418.
9. Condit R, Pitman N, Leigh EG, Chave J, Terborgh J, et al. (2002) Beta-diversity in tropical forest trees. Science 295: 666–669.
10. Plotkin JB, Potts MD, Manokaran N, Lafrankie J, Ashton PS (2000) Species-area curves, spatial aggregation, and habitat specialization in tropical forests. J Theor Biol 207: 81–99.
11. He FL, Legendre P (2002) Species diversity patterns derived from species-area models. Ecology 83: 1185–1198.
12. Wright SJ (2002) Plant diversity in tropical forests:a review of mechanisms of species coexistence. Oecologia 130: 1–14.
13. Wills C, Harms KE, Condit R, King D, Thompson J (2006) Nonrandom processes maintain diversity in tropical forests. Science 311: 527–531. 14. Green JL, Ostling A (2003) Endemics-area relationships: the influence of species
dominance and spatial aggregation. Ecology 84: 3090–3097.
15. Chao A, Colwell RK, Lin C-W, Gotelli NJ (2009) Sufficient sampling for asymptotic minimum species richness estimators. Ecology 90: 1125–1133. 16. Rahbek C, Gotelli NJ, Colwell RK, Entsminger GL, Rangel TFLVB, et al.
(2007) Predicting continental-scale patterns of bird species richness with spatially explicit models. P ROY SOC LOND B BIO 274: 165–174.
17. Valiente-Banuet A, Verdu´ M (2008) Temporal shifts from facilitation to competition occur between closely related taxa. J Ecol 96: 489–494. 18. Helmus MR, Savage K, Diebel MW, Maxted JT, Ives AR (2007) Separating the
determinants of phylogenetic community structure. Ecol Lett 10: 917–925. 19. Swenson NG, Enquist BJ, Pither J, Thompson J, Zimmerman JK (2006) The
problem and promise of scale dependency in community phylogenetics. Ecology 87: 2418–2424.
20. Mooney KA, Jones P, Agrawal AA (2008) Coexisting congeners: demography, competition, and interactions with cardenolides for two milkweed-feeding aphids. Oikos 117: 450–458.
21. Tanaka H, Shibata M, Masaki T, Iida S, Niiyama K, et al. (2008) Comparative demography of three coexisting Acer species in gaps and under closed canopy. J Veg Sci 19: 127–138.
22. Queenborough SA, Burslem DFRP, Garwood NC, Valencia R (2007) Habitat niche partitioning by 16 species of Myristicaceae in Amazonian Ecuador. Plant Ecol 192: 193–207.
23. Du X, Zhou S, Etienne RS (2011) Negative density dependence can offset the effect of species competitive asymmetry: a niche-based mechanism for neutral-like patterns. J Theor Biol 278: 127–134.
24. Pellissier L, Brathen KA, Pottier J, Randin CF, Vittoz P, et al. (2010) Species distribution models reveal apparent competitive and facilitative effects of a dominant species on the distribution of tundra plants. Ecography 33: 1004– 1014.
25. Raven PH, Axelrod DI (1978) Origin and relationships of the California flora. Berkeley: University of California Press. 134 p.
26. Me´dail F, Verlaque R (1997) Ecological characteristics and rarity of endemic plants from southeast France and Corsica: implications for biodiversity conservation. Biol Conserv 80: 269–281.
27. Lloyd KM, Lee WG, Wilson JB (2002) Competitive abilities of rare and common plants: comparisons using Acaena (Rosaceae) and Chionochloa (Poaceae) from New Zealand. Conserv Biol 16: 975–985.
28. Snyder SW, Ladror US, Wade WS, Wang GT, Barrett LW, et al. (1994) Amyloid-beta aggregation: selective inhibition of aggregation in mixtures of amyloid with different chain lengths. Biophys J 67: 1216–1228.
29. Rabinowitz D, Rapp JK, Dixon PM (1984) Competitive abilities of sparse grass species: means of persistence or cause of abundance. Ecology: 1144–1154. 30. Debussche M, Thompson John D (2003) Habitat differentiation between two
closely related Mediterranean plant species, the endemic Cyclamen balearicum and the widespread C. repandum. Acta Oecologica 24: 35–45.
31. Davies SJ, Palmiotto PA, Ashton PS, Lee HS, Lafrankie JV (1998) Comparative ecology of 11 sympatric species of Macaranga in Borneo: tree distribution in relation to horizontal and vertical resource heterogeneity. J Ecol 86: 662–673. 32. Queenborough SA, Burslem DFRP, Garwood NC, Valencia R (2009)
Taxonomic scale-dependence of habitat niche partitioning and biotic neigh-bourhood on survival of tropical tree seedlings. 276: 4197–4205.
33. Li L, Wei SG, Huang ZL, Ye WH, Cao HL (2008) Spatial Patterns and Interspecific Associations of Three Canopy Species at Different Life Stages in a Subtropical Forest, China. J Integr Plant Biol 50: 1140–1150.
34. Harms KE, Condit R, Hubbell SP, Foster RB (2001) Habitat associations of trees and shrubs in a 50-ha neotropical forest plot. J Ecol 89: 947–959. 35. Li L, Huang Zl, Ye Wh, Cao Hl, Wei Sg, et al. (2009) Spatial distributions of
tree species in a subtropical forest of China. Oikos 118: 495–502.
36. Pei NC, Lian JY, Erickson DL, Swenson NG, Kress WJ, et al. (2011) Exploring Tree-Habitat Associations in a Chinese Subtropical Forest Plot Using a Molecular Phylogeny Generated from DNA Barcode Loci. Plos One 6: e21273. 37. Ripley BD (1977) Modeling spatial patterns. J Roy Stat Soc 39: 172–212. 38. Stoyan D, Stoyan H (1994) Fractals, random shapes, and point fields: Methods
of geometrical statistics. Chichester and New York: Wiley.
39. Beltra´n E, Valiente-Banuet A, Verdu´Verd M (2012) Trait divergence and indirect interactions allow facilitation of congeneric species. Ann Bot 110: 1369– 1376.
40. Wang ZF, Lian JY, Huang GM, Ye WH, Cao HL, et al. (2012) Genetic groups in the common plant species Castanopsis chinensis and their associations with topographic habitats. Oikos 121: 2044–2051.
41. Wang ZG, Ye WH, Cao HL, Huang ZL, Lian JY, et al. (2009) Species-topography association in a species-rich subtropical forest of China. Basic Appl Ecol 10: 648–655.
42. Manabe T, Nishimura N, Miura M, Yamamoto S (2000) Population structure and spatial patterns for trees in a temperate old-growth evergreen broad-leaved forest in Japan. Plant Ecol 151: 181–197.
43. Mitsui H, Kimura MT (2000) Coexistence of drosophilid flies: Aggregation, patch size diversity and parasitism. Ecol Res 15: 93–100.
44. Parrish JK, Edelstein-Keshet L (1999) Complexity, pattern, and evolutionary trade-offs in animal aggregation. Science 284: 99–101.
45. Garcia-Serrano H, Sans FX, Escarre´ J (2007) Interspecific competition between alien and native congeneric species. Acta Oecologica 31: 69–78.
46. Sfenthourakis S, Tzanatos E, Giokas S (2006) Species co-occurrence: the case of congeneric species and a causal approach to patterns of species association. Global Ecol Biogeogr 15: 39–49.