Cyclase and Selectively Modulates Expression of Splicing
Regulators in Human Cancer Cells
Gilbert J. Cote2, Wen Zhu2, Anthony Thomas1, Emil Martin1, Ferid Murad3, Iraida G. Sharina1*
1Department of Internal Medicine/Cardiology, University of Texas Medical School, UTHealth, Houston, Texas, United States of America,2Department of Endocrine Neoplasia and Hormonal Disorders, MD Anderson Cancer Center, Houston, Texas, United States of America,3Department of Biochemistry and Molecular Biology, George Washington University, Washington, DC, United States of America
Abstract
Background:Soluble guanylyl cyclase (sGC) plays a central role in nitric oxide (NO)-mediated signal transduction in the cardiovascular, nervous and gastrointestinal systems. Alternative RNA splicing has emerged as a potential mechanism to modulate sGC expression and activity. C-a1 sGC is an alternative splice form that is resistant to oxidation-induced protein degradation and demonstrates preferential subcellular distribution to the oxidized environment of endoplasmic reticulum (ER).
Methodology/Principal Findings:Here we report that splicing of C-a1 sGC can be modulated by H2O2treatment in BE2 neuroblastoma and MDA-MD-468 adenocarcinoma human cells. In addition, we show that the H2O2treatment of MDA-MD-468 cells selectively decreases protein levels of PTBP1 and hnRNP A2/B1 splice factors identified as potentiala1 gene splicing regulators byin silicoanalysis. We further demonstrate that down-regulation of PTBP1 by H2O2occurs at the protein level with variable regulation observed in different breast cancer cells.
Conclusions/Significance:Our data demonstrate that H2O2regulates RNA splicing to induce expression of the oxidation-resistant C-a1 sGC subunit. We also report that H2O2treatment selectively alters the expression of key splicing regulators. This process might play an important role in regulation of cellular adaptation to conditions of oxidative stress.
Citation:Cote GJ, Zhu W, Thomas A, Martin E, Murad F, et al. (2012) Hydrogen Peroxide Alters Splicing of Soluble Guanylyl Cyclase and Selectively Modulates Expression of Splicing Regulators in Human Cancer Cells. PLoS ONE 7(7): e41099. doi:10.1371/journal.pone.0041099
Editor:Marcelo G. Bonini, University of Illinois at Chicago, United States of America
ReceivedNovember 16, 2011;AcceptedJune 21, 2012;PublishedJuly 20, 2012
Copyright:ß2012 Cote et al. This is an open-access article distributed under the terms of the Creative Commons Attribution License, which permits unrestricted use, distribution, and reproduction in any medium, provided the original author and source are credited.
Funding:This work was supported by NIH grants RO1 HL088128 and 3R01HL088128 and AHA South Central Affiliate Grant-in-Aid 09GRNT2060182 to E.M. and departmental start-up funds to I.S. The funders had no role in study design, data collection and analysis, decision to publish, or preparation of the manuscript.
Competing Interests:The authors have declared that no competing interests exist.
* E-mail: [email protected]
Introduction
Alternative splicing expands transcriptome diversity [1,2] and allows cells to meet the requirements of an ever-changing extracellular environment. Common stressors such as heat-shock, amino acid starvation or ethanol toxicity have been demonstrated to regulate alternative splicing [3,4]. Oxidative stress often persists in cellular microenvironment when there is an imbalance in the production and elimination of reactive oxygen species (ROS). This imbalance is associated with a plethora of pathologic conditions including carcinogenesis, cardiovascular disorders and neurode-generation [5,6,7,8,9]. Recent evidence indicates that the alterna-tive splicing can be influenced by changes in oxidaalterna-tive balance. Hypoxic and hypoxia/reoxygenation conditions, which alter ROS homeostasis, have been demonstrated to modify splicing of a number of genes in normal tissues and cancer cell lines [10,11,12,13,14]. Moreover, emerging data indicate that ROS can also alter the abundance of splicing factors or modify their activity. Low concentrations of hydrogen peroxide (H2O2), an ubiquitous
ROS molecule, have been demonstrated to induce phosphoryla-tion of the splicing factor hnRNP C leading to modulaphosphoryla-tion of its RNA-binding affinity [15]. Increased hnRNP-C expression is also
found in intimal hyperplasia and atherosclerosis, which is pro-posed to be associated with increases in H2O2levels produced by
activated vascular endothelium [16].
cellular localization in differentiating stem cells than the canonical a1 sGC [20]. Recent studies by Kraehling et al. revealed that, unlike the canonical a1 sGC isoform, the C-a1 isoform tends to localize to the more oxidized environment of the endoplasmic reticulum (ER) inside the cell [21]. These observations have led us to propose that the expression of the alternative C-a1 protein isoform can be induced by oxidative stress as a part of adaptation mechanism to preserve sGC activity in oxidative conditions.
In present study, we examined if splicing ofa1 sGC gene can be modulated by ROS, specifically, by the treatment with H2O2. We
found that H2O2induces the expression of C-a1 transcript and C-a1 protein in human cancer cells expressinga1/b1 sGC. In an effort to gain insight into the regulatory mechanism, we examined the expression levels of several RNA binding proteins potentially involved in the splicing of C-a1 splice variant. Our studies show that H2O2 treatment selectively decreases the expression of
putativea1 sGC splicing regulators PTBP1 and hnRNP A2/B1. Furthermore, we demonstrate that H2O2-induced degradation of
PTBP1 differs in various breast cancer cell lines. To our knowledge, this is a first report demonstrating that H2O2-induced
oxidative stress affects alternative splicing of sGC and selectively modulates protein level of major splice factors.
Results
H2O2induces expression of C-a1 sGC splice variant To investigate if alternative splicing of GUCY1A3 (a1 sGC subunit gene) is regulated in response to oxidative stress, we treated human breast carcinoma MDA468 and human neuro-blastoma BE2 cell lines with 1 mM H2O2. MDA468 and BE2 cells
endogenously expressa1 and b1 sGC. The H2O2concentration
was chosen based on previous observations demonstrating that interaction with serum proteins in cell culture media, absorption by cellular membranes and neutralization by enzymatic compo-nents of cellular anti-oxidative defense consume a significant portion of exogenously added H2O2[22,23]. MDA468 and BE2
cells demonstrated a significant increase in C-a1 sGC alternative transcript expression upon H2O2 treatment (Fig. 1 A, B). The
relative increase of C-a1 isoform in comparison toa1 transcript was greater in BE2 cells, consistent with our previous studies [19]. The results indicated that GUCY1A3 splicing is altered to allow the recognition of C-a1 specific 39 splice site within exon 4 in response to H2O2 exposure. Although in some experiments the
level of C-a1 was increased by ODQ, neither cell line demonstrated statistically significant changes in C-a1 transcript level suggesting that ODQ treatment alone is not sufficient to affect splicing regulation.
Next, we evaluated the time-course of the changes in abundance of a1 and C-a1 sGC proteins in response to H2O2. Coincident
with increases in GUCY1A3 splicing we observed a time-de-pendent modulation ofa1 and C-a1 sGC protein levels. As shown in Fig. 1C and D, H2O2 increased the relative content of C-a1
protein in MDA468 cells. To assess the contribution of protea-some-dependent degradation in regulation of thea1 sGC splice forms, we performed the experiment in presence of MG132, a potent cell-permeable proteasome inhibitor. We found that pre-treatment with MG132 did not affect the rate of accumulation of C-a1 splice variant, or the level of the canonicala1 sGC subunit. These data suggest that the observed increase in C-a1 protein abundance (Fig. 1D) is likely due to an augmented C-a1 expression, and not to a selective degradation of canonical a1 sGC. Of note is that MG132 treatment also elevated levels of an unknown polypeptide recognized by anti-a1 antibodies with molecular weight lower than C-a1 sGC (Fig. 1D). As the identity
of this protein remains to be determined, its intensity was not included in the densitometry analysis.
Together our results suggested that H2O2 induces preferential
splicing and expression of C-a1 sGC splice form in our cell models.
In silicoanalysis identifies potentiala1 sGC (GUCY1A3) splicing regulators
To gain the initial insight into potential mechanisms ofa1 sGC splicing regulation, we performed in silico analysis using several bioinformatics tools [24]. The C-a1 splice variant is generated by the use of an alternative 39splice site 179 base pairs downstream of the constitutive site (Fig. 2A, Fig. S1). Constitutive and alternative splice sites for exon 4 ofa1 sGC were defined with the UCSC Genome Bioinformatics tool and their relative consensus value examined using Human Splicing Finder [25,26]. Alternative splicing of exon 4 plays a central role in GUCY1A3 transcript diversity; in addition to the constitutive site, the exon contains 2 alternative donor sites and 2 alternative acceptor sites (see Fig. 2A and Fig. S1). With the exception of the constitutive 59splice site donor, the relative consensus strength of all sites proved to be low (Fig. S1). This is a common feature of alternatively processed exons that is thought to facilitate regulation by the serine-arginine rich (SR) and heterogeneous nuclear ribonucleoprotein (hnRNP) proteins [2]. The ASD, Alternative Splicing/Splicing Rainbow tool from European Molecular Biology Laboratory [27], was used to analyze the relevant exon and proximal intron sequences for potential SR and hnRNP regulators of exon 4 splicing. We generated a composite overview of regulator binding sites using the derived values for individual SR and hnRNP proteins (Table S1). This analysis identified a relatively even distribution of SR binding sites throughout exon 4 and the flanking regions. At the same time, the constitutive 39 splice site intron region showed a dense peak of hnRNP binding sites (Fig. 2A). A closer examination identified in this sequence several overlapping binding sites for hnRNP 2A/B1, polypyrimidine-tract-binding protein 1 (hnRNP I, PTBP1), SRp20, SRp40 and Hu antigen R (HuR, ELAVL1) splicing regulators (Fig. S1). The location of these sites suggested that corresponding splice factors are likely to affect the use of both canonical and alternative splice sites, promoting the generation of the C-a1 sGC transcript.
H2O2selectively alters the expression of splicing factors It is well established that the expression levels and the relative stoichiometry of splice factors modulate alternative splicing [28]. Therefore, we investigated the effect of H2O2exposure on protein
levels of the splice factors identified by our in silico analysis as potential sGC regulators. As shown in Fig. 2B, the exposure of MDA468 cell to H2O2 selectively decreased the protein level of
PTBP1 and hnRNP A2/B1 splicing repressors. H2O2 did not
affect the level of HuR regulator and only slightly altered levels of SRp40 protein from SR family of splicing enhancers. Both PTBP1 and hnRNP A2/B1 proteins are decreased in a dose-dependent manner in MDA468 cells (Fig. 2 C, D and F). Our data indicate that the observed H2O2-dependent switch in splicing of
GU-CY1A3 gene coincides with the changes in the level of regulatory splice factors. However, the exact mechanism and the contribution of specific splice factors in the regulation of sGC splicing remains to be determined.
Insights into the mechanism of H2O2-induced PTBP1
protein degradation
Next we explored potential mechanisms of hnRNP regulation by H2O2. We chose to focus on PTBP1 since this extensively
studied RNA-binding protein plays an important role in various steps of cellular mRNA processing, including splicing, regulation of stability, localization and translation [29]. Moreover, PTBP1 has been demonstrated to be essential in the regulation of cell growth and cancer cells survival [30,31,32]. The ability of H2O2to
reduce PTBP1 levels suggested that, additionally, it may play a role in the regulation of cellular adaptation to oxidative conditions. However, the effect of elevated ROS levels on PTBP1 expression has never been examined previously.
We first investigated if H2O2alters PTBP1 mRNA steady-state
levels. RT-qPCR analysis performed with RNA samples isolated from MDA468 cells treated with different H2O2 concentrations
found no changes in PTBP1 mRNA levels (Fig. 3C) indicating that PTBP1 is likely to be controlled at the protein level. To examine the role of proteasomal degradation, we monitored the dynamics of changes in PTBP1 protein in response to H2O2treatment over
a 16 hours period in the presence or absence of proteasome inhibitor MG132. We found that PTBP1 protein was reduced in a time-dependent manner starting at 8 hours post-exposure (Fig. 3 A, B). Interestingly, the protein degradation was not prevented, but rather enhanced, by MG132 treatment. This was particularly evident at the 16-hour and later time points (Fig. 3A and data not shown). Thus, while MG132 treatment showed that the protea-some had no direct effect on PTBP1 degradation, the fact that its
inhibition accelerates degradation implies an indirect role in regulation, most likely through stabilization of an unknown protease or protein cofactor. The pre-treatment of MDA468 cells with cycloheximide (CHX, the inhibitor of de novo protein synthesis) also did not prevent PTBP1 decrease, indicating that H2O2was inducing a pre-existing protein degradation pathway
(Fig. 3D). It has been previously demonstrated that cellular apoptosis leads to PTBP1 degradation through Capase-3 activa-tion [33]. Thus, we explored the possibility that Caspase-3 might play a role in H2O2-induced PTBP1 decreases. However, we
found that the addition of Caspase-3 inhibitor IV (Ac-DMQD-CHO, Calbiochem) did not prevent H2O2–induced PTBP1
degradation (results are not shown), indicating that Caspase-3 is not involved in this process. To determine whether other exogenous sources, besides direct addition of H2O2 solution,
might affect the stability of PTB1, we applied glucose oxidase (GO) to the cell culture media. Consistent with the direct role of H2O2
in the induction of PTBP1 degradation, steady-state production of H2O2by GO treatment reproduced the effect.
H2O2 induces post-translational protein modifications such as
oxidation of intracellular thiols and thiolate anions. These modifications are an integral part of H2O2 signaling affecting
a variety of cellular processes [34]. It has been previously demonstrated that in oxidative conditions PTBP1 may form dimers due to the formation of intermolecular disulfide bridges [35]. Indeed, in our experiments we also detected the formation of a high molecular weight protein band recognized by PTB1 Figure 1. H2O2exposure induces the expression of oxidation-resistant C-a1 sGC splice form in MDA468 and BE2 cells. A: RT-PCR
detection ofa1 (top) and C-a1 (bottom band) sGC transcripts following treatment with H2O2(1 mM) or ODQ (20mM), as indicated. RT-PCR products
are separated on 3% agarose gel and stained with Ethidium Bromide. Upper band represents the message encoding canonicala1 protein (Transcripts 1–4, 270 bp); middle band is a non-specific product; bottom band indicates the C-a1 sGC transcript (Transcript 5, 94 bp). Biological triplicates representative of three independent experiments are shown.B: Ratio (mean6SD) of the relative abundance of C-a1 anda1 transcripts quantified by densitometry. *p,0.05 by Student’s t-test.C: Western blot detection ofa1 (top) and C-a1 (bottom) proteins. MDA468 cells were treated with 1 mM H2O2as indicated in presence or absence of MG132 (10mM). Shown blots are representative of four independent experiments with similar results.D:
Ratio of the relative abundance of C-a1 and a1 proteins quantified by densitometry. Data are shown as mean6 SD from four independent experiments.
antibodies following the treatment of MDA468 cells with H2O2
(results are not shown).
To evaluate the contribution of thiol oxidation to PTBP1 degradation, we exposed MDA468 cells to two different compounds altering cellular thiol metabolism. Treatment with 2-hydroxyethyl disulphide (HEDS), an agent that acts as thiol-specific oxidant, significantly decreased PTBP1 levels (Fig. 3D), indicating that direct thiol oxidation might play an important role in PTBP1 degradation response. To further test if PTBP1 degradation is induced by diminished cellular thiol-reducing activity in response to H2O2, we also treated the cells with
L-buthionine-S,R-sulfoximine (BSO). BSO is an irreversible in-hibitor of glutathione biosynthesis, decreasing intracellular gluta-thione pool. We observed no significant degradation of PTBP1 in response to BSO, suggesting that a decreased level of GSH is not sufficient to induce PTBP1 (Fig. 3D) degradation. These results may also be related to the intrinsic ability of MDA468 cells to compensate for the GSH loss induced by BSO, as has been previously reported for cell lines with high SOD expression [36]. Thus, oxidation of Cys thiols by H2O2could initiate the formation
of the PTBP1 dimers and contribute to subsequent protein degradation.
H2O2effect on PTBP1 protein levels varies in different
breast cancer cell lines
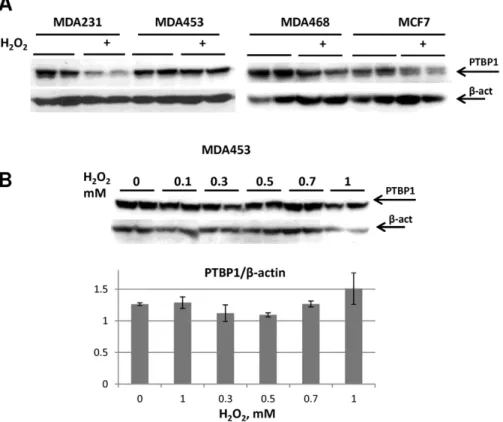
To determine the generality of H2O2-induced PTBP1
degra-dation, we tested additional breast cancer lines, including: MDA-MD-453, MDA-MD-231 and MCF7. Western blot analysis of H2O2-treated cells demonstrated various degrees of PTBP1
reduction in MDA468, MCF7 and MDA231 cells, but no change in MDA453 cells (Fig. 4A). The failure to induce PTBP1 degradation in MDA453 cells was observed at H2O2
concentra-tions that readily elicited significant decreases in MDA468 cells (compare Fig. 4B to Fig. 2B and C). These data suggested that the extent of H2O2-induced degradation of PTBP1, thought
preva-lent, is still rather cell line specific. To explore if the resistance to PTBP1 protein degradation is associated with increased ability of cells to survive oxidative stress, we compared H2O2-induced
cytotoxicity in MDA468 and MDA453 cells. MDA468 cells were less resistant to H2O2-induced cytotoxicity (IC50= 450660mM)
compared with MDA453 cells (IC50= 66062mM) (Fig. 5). In an
attempt to directly link a reduction in PTBP1 levels to H2O2
-induced cytotoxicity we performed siRNA-mediated PTBP1 knockdown in MDA453 cells. Despite a greater than 50% reduction in PTBP1 mRNA (as detected by RT-qPCR), cell viability measurements revealed only a small insignificant decline in resistance to H2O2treatment (Fig. S2). These data suggest that
the level of PTBP1 expression alone is not critically important to support oxidative resistance in MDA435 cells.
Discussion
In this report we demonstrate that the oxidative stress induced by H2O2influences splicing of thea1 sGC gene (GUCY1A3) and
selectively decreases protein level of PTBP1 and hnRNP A2/B1 splicing factors. We previously established that GUCY1A3 transcripts undergo alternative splicing and that the C-a1 sGC splice isoform encodes a protein that is resistant to ODQ-induced Figure 2. H2O2exposure selectively alters the expression of splice factors predicted to regulate sGC splicing in MDA468 cells. A: Schematic representation of GUCY1A3 alternative splicing to generate C-a1. The relative distribution of predicted SR and hnRNP binding sites is shown.B: Western analysis of PTBP1, hnRNP2A/1B, HuR and SR proteins expression in control and H2O2-treated (1 mM, 24 hours) MDA468 cells.C:
H2O2dose-dependent assessment of PTBP1 and hnRNP A2/B1 protein levels in MDA468 cells. Shown Western blots are representative of at least
three independent experiments with similar results.D, F: Densitometry analysis of PTBP1 and hnRNP A2/B1 protein levels normalized onb-actin. Data are shown as mean6SD from three independent experiments.
doi:10.1371/journal.pone.0041099.g002
degradation [19,37]. ODQ induces degradation through oxidation of the sGC prosthetic heme group, which destabilizes the protein. A similar process has been proposed to occur in conditions of oxidative stress and to be responsible for decreased level of sGC protein in vascular inflammation [23]. In this study we in-vestigated if sGC splicing can be modulated by ROS as a potential mechanism to favor of the expression of oxidation resistant C-a1 splice form.
H2O2is an ubiquitous ROS molecule that is produced in cells
by superoxide dismutases as a metabolite of superoxide anion (O22). H2O2 is a relatively stable and neutrally charged which
enables it to readily cross cell membranes. These properties have led to the proposal that H2O2 may be involved in paracrine
oxidative stress signaling [38,39]. Thus, we chose to examine H2O2as a mediator of oxidative stress in our studies performed on
human BE2 neuroblastoma and MDA468 breast adenocarcinoma cell lines. Our data demonstrated for the first time that an exposure to H2O2increases the relative amount of C-a1 mRNA
and protein in these cell lines (Fig. 1). This result establishes that C-a1 splicing can be modulated by physiologically relevant ROS compound, and suggests that splicing may play an important role in modulating sGC enzymatic properties in response to changes in oxidative balance of the microenvironment. An additional study in support of this idea has recently been reported by Kraehling et al. [21]. This report independently confirmed our previous findings that C-a1 sGC forms highly stable and fully active heterodimers with b1 sGC . Furthermore, the difference in subcellular distribution of C-a1 and canonical a1 sGC subunits has been demonstrated using fluorescently tagged protein; the C-a1 isoform was localized to the more oxidized environment of endoplasmic reticulum. Together these data suggest that alternative splicing of
GUCY1A3 gene might participate in adaptive cell response to preserve sGC function in oxidative stress. Further studies to evaluate the physiological importance of such adaptation are necessary.
To gain an insight into potential mechanisms involved in alternative splicing ofa1 sGC, we performed anin silicoanalysis of relevant GUCY1A3 intronic and exonic sequences to identify potential regulatory elements [40,41]. The distribution of pre-dicted cis-regulatory sequences was consistent with a model whereby SR proteins would favor canonical splice site use, while binding of hnRNPs, specifically PTBP1 and hnRNP A2/B1, would block recognition of the exon 4 constitutive 39splice site to promote C-a1 isoform production (Fig. 2A and Fig. S1). To test our model we examined the expression of splice factors before and after exposure to H2O2. While splicing regulation is commonly
achieved by modulating the expression level of regulatory factors [28], the impact of oxidative stress on this process has not been characterized previously. Contrary to our expectations, the data showed that H2O2 exposure induced a selective reduction of
PTBP1 and hnRNP A2/B1, and had no effect on HuR and SR protein expression (Fig. 2). Our experimental results indicate a more complex regulation of sGC splicing than that predicted by in silicomodel. Further investigations are needed to explain this difference. On another hand, the specific and dramatic reduction of two key RNA splicing factors suggested that selective down-regulation of splice regulators could be one of the mechanisms underlying the changes in alternative splicing in response to oxidative stress.
PTBP1 plays a crucial role in a number of post-transcriptional regulatory processes, and its activity has been linked to cellular proliferation, apoptosis, tumorigenesis and response to hypoxia Figure 3. Insights into the mechanism of H2O2-induced PTBP1 down-regulation. A: PTBP1 degradation occurs in time-dependent manner and is not prevented by proteasome inhibitor MG132. MDA468 cells were treated as in Fig. 1C with 1 mM H2O2in the presence or absence of MG132
(10mM). Western blot analysis was performed to visualize the expression of PTBP1.b-actin served as a loading control. Biological duplicates for each treatment are shown; blots are representative of three independent experiments with similar results.B: Densitometry analysis of PTBP1 protein levels normalized onb-actin. Averages for representative biological duplicates for each treatment are shown.C: H2O2exposure does not affect PTBP1
mRNA levels. MDA468 cells were treated with indicated concentrations of H2O2for 24 hours. Relative abundance of PTBP1 mRNA in samples was
analyzed by RT-qPCR analysis. AverageDCt6SD for biological triplicates are shown.D: PTBP1 degradation depends on thiol oxidation and is not rescued by inhibition ofde novoprotein synthesis. Western blot analysis performed on MDA468 cell lysates treated for 24 hours with inhibitor of protein synthesis cycloxemide (2mg/ml) and different factors inducing oxidative stress: 1 mM BSO (GSH depletion inducer); 1 mM HEDS (thiol oxidation inducer) and 0.01 units/ml of Glucose Oxidase (increases production of ROS). Shown Western blots are representative of three independent experiments with similar results.
Figure 4. PTBP1 response to H2O2-induced degradation varies in different breast cancer cell lines. A: Western blot analysis examining PTBP1 expression in MDA231, MDA453, MDA468 and MCF7 cells treated with 1 mM H2O2for 18 hours. Representative biological duplicates are
shown.B: MDA453 cells are resistant to H2O2-induced PTBP1 degradation.Top panel: MDA453 cell were treated with different concentration of H2O2
and cell lysates were subjected to Western blot analysis with antibodies towards PTBP1 and b-actin. Shown blots are representative of four independent experiments with similar results.Bottom panel: densitometry analysis of PTBP1 protein levels normalized onb-actin levels. Averages for representative biological duplicates for each treatment are shown.
doi:10.1371/journal.pone.0041099.g004
Figure 5. H2O2cytotoxicity analysis in MDA468 and MDA453 cells.Survival curve was generated in response to H2O2dosage using trypan
exclusion method and expressed as % of survival to untreated controls. Mean6SD of three independent passages performed in triplicates are shown, *- p,0.05 by Student’s t-test in comparison to control.
doi:10.1371/journal.pone.0041099.g005
[30,42,43,44]. Therefore, we chose to further explore the effect of H2O2 treatment on the PTBP1 expression. Our results
demon-strated that H2O2 decreases PTBP1 expression in a dose- and
time-dependent manner (Fig. 2C, F and Fig. 3A, B). No change in PTBP1 mRNA level was observed, indicating that the down-regulation occurs post-transcriptionally (Fig. 3C). Furthermore, the several hours delay in response to H2O2treatment suggests an
indirect mechanism of PTBP1 down-regulation. This conclusion is supported by the observation that proteasome inhibitor MG132 facilitated, and not inhibited, the H2O2-induced decline in PTBP1
protein (Fig. 3A, B). Because PTBP1 degradation did not require new protein synthesis (it was not blocked by cycloheximide treatment) our findings indicate that H2O2 may potentially
enhance proteasomal degradation of some unknown factor responsible for PTBP1 stabilization. Given that H2O2exposure
is known to induce apoptosis [45], we considered a caspase-mediated degradation of PTBP1. Previous studies have demon-strated that PTBP1 is targeted by Capase-3 during apoptotic response [33]. However, Inhibitor IV failed to prevent H2O2
-mediated reduction in PTBP1 protein levels (data not shown). Thus, we conclude that H2O2probably induces PTBP1
degrada-tion by a different from previously described mechanisms. It is also important to point out that PTBP1 degradation was not limited to the direct addition of H2O2 solution to cells.
Application of extracellular glucose oxidase (GO), which catalyzes the conversion of glucose into H2O2 and D-glucono-d-lactone,
also induced a significant decline of PTBP1 protein in MDA468 cells (Fig. 3D).
The reaction of H2O2 with protein thiols (R-SH) and thiolate
anions (R-S2) is known to generate sulfenic acids (RSOH) modifications and promote disulfide bond formation. These proteins were implicated in a wide variety of biochemical effects mediating ROS signaling [34,46]. Interestingly, dimerization of PTBP1 molecules via intermolecular Cys bridge formation was previously observed in oxidative conditions [35]. We explored the possibility that down-regulation of PTBP1 protein by H2O2 is
mediated by thiol oxidation. Indeed, non-specific thiol oxidizing compound HEDS elicited a significant decline of PTBP1 levels, similar to a direct H2O2exposure (Fig. 3D). Thus, dimerization
through cysteine oxidation might target PTBP1 protein to subsequent degradation. Delineation of an exact mechanism responsible for selective ROS-induced degradation of this impor-tant regulator may offer additional imporimpor-tant insights into cellular oxidative response.
Previously, PTBP1 expression has been correlated with increases in proliferation and metastatic potential of cancer cells; however, this effect varies in different cell lines [31,32,47,48]. In addition, elevated PTBP1 levels have been shown to support aerobic glycolysis and enhance translation of hypoxia-inducible factor 1a(HIF-1a), which enables cancer cells to survive hypoxic conditions associated with altered ROS homeostasis [42,49,50,51]. We employed several breast cancer lines to investigate if the effect of H2O2on PTBP1 levels has a general nature. We observed that
similar concentrations of H2O2-induced PTBP1 degradation in
three out of four investigated breast cancer lines (Fig. 4A). The highest difference was observed between MDA468 and MDA453 lines. Similar range of H2O2 concentrations induced significant
decreases in the level of PTBP1 in MDA468 cells, but did not affect PTBP1 level in MDA453 cells (compare Fig. 2C, D vs Fig. 4B). Thus, we can conclude that although the majority of breast cancer cell lines we tested (3 out of 4) responded to H2O2
treatment by down-regulation PTBP1 levels, the response is not universal. This raised the obvious question of whether a failure to degrade PTBP1 is associated with changes in cytotoxic response to
H2O2. Indeed, we found that MDA453 cells were significantly less
sensitive to cytotoxic concentrations of H2O2 than MDA468
(Fig. 5). This observation is in agreement with previous reports suggesting that preserving PTBP1 expression is beneficial to cancer cells survival in oxidative stress [30,31]. However, we were unable to demonstrate a direct role for PTBP1 in MDA453 cells response to H2O2, as siRNA-mediated knockdown had no effect
on cytotoxicity (Fig. S2). Additional studies are necessary to uncover the precise role of PTBP1 in H2O2–mediated cytotoxicity
and determine if the lack of PTBP1 degradation in response to a treatment with oxidants may serve as a marker for resistance to oxidative stress in individual cancer cell lines.
In summary, our data demonstrate that the oxidative stress induced by H2O2 promotes splicing of oxidation-resistant C-a1
sGC splice variant and selectively alters protein levels of major splice factors.
Materials and Methods
Cell Culture and Preparation of Protein Lysates
BE2 human neuroblastoma cell line (American Type Culture Collection) was cultured in DMEM/F12K media supplemented with 10% FBS, 0.1 mM MEM nonessential amino acids, penicillin-streptomycin mixture (50 units/ml and 50mg/ml), 10 mM Hepes (pH 7.4), 1 mM sodium pyruvate, 2 mM L-glutamine (all from Gibco/Invitrogen) and maintained at 37uC and 5% CO2. Human adenocarcinomas MDA-MD-468, MCF7,
MDA-MD-231 and ductal carcinoma MDA-MD-453 cells (gen-erous gift of Dr. Hesham Amin, MD Anderson Cancer Center) were cultured in RPMI supplemented with 10% FBS, 0.1 mM MEM nonessential amino acids and penicillin-streptomycin mixture (50 units/ml and 50mg/ml) and maintained at 37uC and 5% CO2. For treatments, 70–80% confluent cell cultures were
exposed with different agents up to 24 hours. To prepare lysates, the cells were collected by trypsinolysis, washed twice with PBS, re-suspended in 50 mM TEA (pH 7.4) containing protease inhibitor cocktail (Sigma-Aldrich, St. Louis, MO) and disrupted by sonication. The lysates were centrifuged at 15,0006 g for 30 min to prepare the cleared supernatant fractions, which were used for Western blotting.
Reverse Transcriptase-Polymerase Chain Reaction (RT-PCR)
Total RNA from cells was isolated using UltraSpec total RNA isolation reagent (Biotecx, Houston, TX). cDNA was prepared using a high-capacity cDNA kit (Applied Biosystems, Foster City, CA). The semi-quantitative RT-PCR assay for detection of C-a1 sGC mRNA (Transcript 5, NCBI, Accession N NM_001130685) was performed as described previously [19]. A set of specific primers flanking the deletion ina1 sGC Transcript 5 was used to perform PCR amplification. Primer sequences were as follows: Forward Primer 59-cagccccgaggtgtgcgaag-39; Reverse Primer 59 -ggcacggttgctttgcagct-39. PCR products representing canonicala1 sGC mRNA (270 bp, encoding full size protein) and Transcript 5 mRNA (94 bp, encoding C-a1 sGC splice variant), were separated on agarose gel and visualized by Ethidium Bromide staining. Obtained picture was inverted and the band intensity was quantified by densitometry using QuantityOne software (BioRad). We determined PTBP1 mRNA expression levels with the TaqMan assay (Hs00259176-m1), which specifically measures the presence of exon 2. Ribosomal RNA (18S) (4308329) was used as an endogenous control to perform the comparative DCT
Western Blot Analysis
Western blot analysis was performed as described previously [19]. Cleared supernatant fractions of protein lysates (20mg) were loaded on 8% polyacrylamide gels, separated by electrophoresis and transferred on PVDF membranes. Membranes were blocked with 5% non-fat milk, incubated with primary antibodies for 1 h and with secondary horseradish peroxidase-conjugated antibodies (Sigma) in DPBS buffer for 45 min at room temperature. The signal was visualized by enhanced chemiluminescence (ECL Plus, Amersham). Densitometry analysis was performed using Quanti-tyOne software (BioRad). The following primary antibodies were used: custom made rabbit polyclonal anti-a1 sGC antibodies raised against human C-terminal peptide FTPRSREELPPNFP (1:1000 dilution); anti-b-actin (Sigma-Aldrich; 1:7000 dilution); PTBP1 (IMG-3559, IMGENEX, CA, 1:2000 dilution); anti-HuR (3A2, Santa Cruz Biotechnology, 1:200 dilution): pan-SR (1H4, Santa Cruz Biotechnology, 1:200 dilution); anti-hnRNP A2/B1(G-16, Santa Cruz Biotechnology, 1:200 dilution).
H2O2Cytotoxicity Assay
Cells grown on 96-well plates (16105cells/ml) were treated with different concentrations of H2O2. After 24 hours, viable cells were
visualized with trypan blue exclusion (Life Technologies/Invitro-gen) to determine the cell number and viability by hemocytometer count. Knock-down of PTBP1 expression was performed using siRNA gene silencing (Santa Cruz Biotechnology) according to manufacturer’s instructions.
In Silicoand Statistical Analysis
Calculation of relative splice site strengths was performed using the Human Splicing Finder version 2.4.1 online tool (www.umd. be/HSF/) [25,26]. Mapping of hnRNP and SR regulatory sequences was performed using the ASD–Alternative Splicing/ Splicing Rainbow tool from European Molecular Biology Laboratory (http://www.ebi.ac.uk/asd-srv/wb.cgi?method = 8) [27]. The GUCY1A3 genomic sequences used for this analysis were directed from the human GRCh37/hg19 assembly and included: Exon 2 region (150 bp) chr4:156588521–156588670, Exon 4 region (568 bp) chr4:156617808–156618375) and Exon 5 region (150 bp) chr4:156624983–156625132. All data are pre-sented as mean 6 standard deviation. The Splicing Rainbow tabular output file was used to generate a predicted binding score based on the output score for individual nucleotide positions (see Table S1 for an example). Statistical comparisons between groups were performed by Student’s t-test using Excel software with a p,0.05 considered statistically significant. Nonlinear regression
and calculations of IC50were performed using Graph Pad Prism
3.0 software (GraphPad Software).
Supporting Information
Figure S1 Distribution of Predicted Splicing Factor Binding Sites. Shown is 294 bp of GUCY1A3 genomic sequence (GRCh37/hg19 assembly Chr4:156617821– 156618114) spanning the intron 3 (low case)/exon 4 (upper case) junction. The position of alternative splice sites along with their predicted strength is shown. The C-a1 39SS1splice site is used to
generate C-a1 mRNA isoform. Details regarding the use of other splice sites is reviewed in (Sharina, I.G., et al., RNA splicing in regulation of nitric oxide receptor soluble guanylyl cyclase. Nitric Oxide, 2011). The location of predicted regulatory sites for splicing factors examined in Figure 2B is shown. This information was derived using the ASD–Alternative Splicing/Splicing Rainbow tool with a detailed output of this analysis provided in Table S1.
(TIF)
Figure S2 MDA453 cells response to H2O2after
siRNA-mediated knockdown of PTBP1. A. Cytotoxicity analysis. MDA453 cells were plated on 24 well plates at 50% confluence in complete RPMI media. Next day, the transfection with siRNA has been performed according to manufacturer’s recommenda-tions (Santa Cruz Biotech., Inc). Cells were allowed to recover for 24 hours and treated with indicated concentrations of H2O2 in serum-free media. After 24 hours of incubation, the cells were lifted with Trypsin and total numbers of viable cells were counted with Vi-Cell XR Cell Viability Analyzer (Beckman Coulter). Data are shown as mean6SD from three independent experiments.B. Q-PCR analysis of PTBP1 mRNA levels in MDA453 cells transfected with scrambled control or PTBP1 siRNA. At the time of cytotoxicity analysis, the cells were collected for RNA purification (RiboPure, Ambion) and Q-PCR analysis. Data are shown as mean 6SD from three independent experiments. PTB1 k/d – PTB1 knock down.
(PPTX)
Table S1 ASD Splicing Rainbow Output for GUCY1A3 Predicted Splicing Factor Binding Sites.
(DOC)
Author Contributions
Conceived and designed the experiments: IGS GJC ESM FM. Performed the experiments: IGS WZ AT ESM. Analyzed the data: GJC IGS. Contributed reagents/materials/analysis tools: GJC ESM FM. Wrote the paper: IGS GJC.
References
1. Keene JD (2007) RNA regulons: coordination of post-transcriptional events. Nat Rev Genet 8: 533–543.
2. Shin C, Manley JL (2004) Cell signalling and the control of pre-mRNA splicing. Nat Rev Mol Cell Biol 5: 727–738.
3. Pleiss JA, Whitworth GB, Bergkessel M, Guthrie C (2007) Rapid, transcript-specific changes in splicing in response to environmental stress. Mol Cell 27: 928–937.
4. Shi Y, Manley JL (2007) A complex signaling pathway regulates SRp38 phosphorylation and pre-mRNA splicing in response to heat shock. Mol Cell 28: 79–90.
5. Irani K, Xia Y, Zweier JL, Sollott SJ, Der CJ, et al. (1997) Mitogenic signaling mediated by oxidants in Ras-transformed fibroblasts. Science 275: 1649–1652. 6. Klein JA, Ackerman SL (2003) Oxidative stress, cell cycle, and
neurodegenera-tion. J Clin Invest 111: 785–793.
7. Nienhuis HL, Westra J, Smit AJ, Limburg PC, Kallenberg CG, et al. (2009) AGE and their receptor RAGE in systemic autoimmune diseases: an inflammation propagating factor contributing to accelerated atherosclerosis. Autoimmunity 42: 302–304.
8. Sugamura K, Keaney JF Jr (2011) Reactive oxygen species in cardiovascular disease. Free Radic Biol Med 51: 978–992.
9. Vafa O, Wade M, Kern S, Beeche M, Pandita TK, et al. (2002) c-Myc can induce DNA damage, increase reactive oxygen species, and mitigate p53 function: a mechanism for oncogene-induced genetic instability. Mol Cell 9: 1031–1044.
10. Ashibe B, Hirai T, Higashi K, Sekimizu K, Motojima K (2007) Dual subcellular localization in the endoplasmic reticulum and peroxisomes and a vital role in protecting against oxidative stress of fatty aldehyde dehydrogenase are achieved by alternative splicing. J Biol Chem 282: 20763–20773.
11. Hang X, Li P, Li Z, Qu W, Yu Y, et al. (2009) Transcription and splicing regulation in human umbilical vein endothelial cells under hypoxic stress conditions by exon array. BMC Genomics 10: 126.
12. Hirschfeld M, zur Hausen A, Bettendorf H, Jager M, Stickeler E (2009) Alternative splicing of Cyr61 is regulated by hypoxia and significantly changed in breast cancer. Cancer Res 69: 2082–2090.
13. Matsuo N, Ogawa S, Imai Y, Takagi T, Tohyama M, et al. (1995) Cloning of a novel RNA binding polypeptide (RA301) induced by hypoxia/reoxygenation. J Biol Chem 270: 28216–28222.
14. Takeo K, Kawai T, Nishida K, Masuda K, Teshima-Kondo S, et al. (2009) Oxidative stress-induced alternative splicing of transformer 2beta (SFRS10) and CD44 pre-mRNAs in gastric epithelial cells. Am J Physiol Cell Physiol 297: C330–338.
15. Kattapuram T, Yang S, Maki JL, Stone JR (2005) Protein kinase CK1alpha regulates mRNA binding by heterogeneous nuclear ribonucleoprotein C in response to physiologic levels of hydrogen peroxide. J Biol Chem 280: 15340– 15347.
16. Panchenko MP, Silva N, Stone JR (2009) Up-regulation of a hydrogen peroxide-responsive pre-mRNA binding protein in atherosclerosis and intimal hyperpla-sia. Cardiovasc Pathol 18: 167–172.
17. Murad F (2006) Shattuck Lecture. Nitric oxide and cyclic GMP in cell signaling and drug development. N Engl J Med 355: 2003–2011.
18. Meurer S, Pioch S, Pabst T, Opitz N, Schmidt PM, et al. (2009) Nitric oxide-independent vasodilator rescues heme-oxidized soluble guanylate cyclase from proteasomal degradation. Circ Res 105: 33–41.
19. Sharina IG, Jelen F, Bogatenkova EP, Thomas A, Martin E, et al. (2008) Alpha1 soluble guanylyl cyclase (sGC) splice forms as potential regulators of human sGC activity. J Biol Chem 283: 15104–15113.
20. Sharin VG, Mujoo K, Kots AY, Martin E, Murad F, et al. (2010) Nitric Oxide Receptor Soluble Guanylyl Cyclase Undergoes Splicing Regulation in Differentiating Human Embryonic Cells. Stem Cells Dev.
21. Kraehling JR, Busker M, Haase T, Haase N, Koglin M, et al. (2011) The Amino-Terminus of Nitric Oxide Sensitive Guanylyl Cyclase alpha(1) Does Not Affect Dimerization but Influences Subcellular Localization. PLoS One 6: e25772.
22. Gulden M, Jess A, Kammann J, Maser E, Seibert H (2010) Cytotoxic potency of H2O2 in cell cultures: impact of cell concentration and exposure time. Free Radic Biol Med 49: 1298–1305.
23. Stasch JP, Schmidt PM, Nedvetsky PI, Nedvetskaya TY, H S AK, et al. (2006) Targeting the heme-oxidized nitric oxide receptor for selective vasodilatation of diseased blood vessels. J Clin Invest 116: 2552–2561.
24. Baralle D, Lucassen A, Buratti E (2009) Missed threads. The impact of pre-mRNA splicing defects on clinical practice. EMBO Rep 10: 810–816. 25. Desmet FO, Hamroun D, Lalande M, Collod-Beroud G, Claustres M, et al.
(2009) Human Splicing Finder: an online bioinformatics tool to predict splicing signals. Nucleic Acids Res 37: e67.
26. Kent WJ, Sugnet CW, Furey TS, Roskin KM, Pringle TH, et al. (2002) The human genome browser at UCSC. Genome Res 12: 996–1006.
27. Koscielny G, Le Texier V, Gopalakrishnan C, Kumanduri V, Riethoven JJ, et al. (2009) ASTD: The Alternative Splicing and Transcript Diversity database. Genomics 93: 213–220.
28. Caceres JF, Kornblihtt AR (2002) Alternative splicing: multiple control mechanisms and involvement in human disease. Trends Genet 18: 186–193. 29. Sawicka K, Bushell M, Spriggs KA, Willis AE (2008)
Polypyrimidine-tract-binding protein: a multifunctional RNA-Polypyrimidine-tract-binding protein. Biochem Soc Trans 36: 641–647.
30. Cheung HC, Hai T, Zhu W, Baggerly KA, Tsavachidis S, et al. (2009) Splicing factors PTBP1 and PTBP2 promote proliferation and migration of glioma cell lines. Brain 132: 2277–2288.
31. He X, Pool M, Darcy KM, Lim SB, Auersperg N, et al. (2007) Knockdown of polypyrimidine tract-binding protein suppresses ovarian tumor cell growth and invasiveness in vitro. Oncogene 26: 4961–4968.
32. Wang C, Norton JT, Ghosh S, Kim J, Fushimi K, et al. (2008) Polypyrimidine tract-binding protein (PTB) differentially affects malignancy in a cell line-dependent manner. J Biol Chem 283: 20277–20287.
33. Back SH, Shin S, Jang SK (2002) Polypyrimidine tract-binding proteins are cleaved by caspase-3 during apoptosis. J Biol Chem 277: 27200–27209. 34. Reddie KG, Carroll KS (2008) Expanding the functional diversity of proteins
through cysteine oxidation. Curr Opin Chem Biol 12: 746–754.
35. Monie TP, Hernandez H, Robinson CV, Simpson P, Matthews S, et al. (2005) The polypyrimidine tract binding protein is a monomer. RNA 11: 1803–1808. 36. Marengo B, De Ciucis C, Verzola D, Pistoia V, Raffaghello L, et al. (2008) Mechanisms of BSO (L-buthionine-S,R-sulfoximine)-induced cytotoxic effects in neuroblastoma. Free Radic Biol Med 44: 474–482.
37. Sharina IG, Cote GJ, Martin E, Doursout MF, Murad F (2011) RNA splicing in regulation of nitric oxide receptor soluble guanylyl cyclase. Nitric Oxide. 38. Ardanaz N, Pagano PJ (2006) Hydrogen peroxide as a paracrine vascular
mediator: regulation and signaling leading to dysfunction. Exp Biol Med (Maywood) 231: 237–251.
39. Stone JR, Yang S (2006) Hydrogen peroxide: a signaling messenger. Antioxid Redox Signal 8: 243–270.
40. Witten JT, Ule J (2011) Understanding splicing regulation through RNA splicing maps. Trends Genet 27: 89–97.
41. Xue Y, Zhou Y, Wu T, Zhu T, Ji X, et al. (2009) Genome-wide analysis of PTB-RNA interactions reveals a strategy used by the general splicing repressor to modulate exon inclusion or skipping. Mol Cell 36: 996–1006.
42. Galban S, Kuwano Y, Pullmann R Jr, Martindale JL, Kim HH, et al. (2008) RNA-binding proteins HuR and PTB promote the translation of hypoxia-inducible factor 1alpha. Mol Cell Biol 28: 93–107.
43. Shibayama M, Ohno S, Osaka T, Sakamoto R, Tokunaga A, et al. (2009) Polypyrimidine tract-binding protein is essential for early mouse development and embryonic stem cell proliferation. FEBS J 276: 6658–6668.
44. Zhang J, Bahi N, Llovera M, Comella JX, Sanchis D (2009) Polypyrimidine tract binding proteins (PTB) regulate the expression of apoptotic genes and susceptibility to caspase-dependent apoptosis in differentiating cardiomyocytes. Cell Death Differ 16: 1460–1468.
45. Pierce GB, Parchment RE, Lewellyn AL (1991) Hydrogen peroxide as a mediator of programmed cell death in the blastocyst. Differentiation 46: 181–186.
46. Poole LB, Nelson KJ (2008) Discovering mechanisms of signaling-mediated cysteine oxidation. Curr Opin Chem Biol 12: 18–24.
47. Jin W, Bruno IG, Xie TX, Sanger LJ, Cote GJ (2003) Polypyrimidine tract-binding protein down-regulates fibroblast growth factor receptor 1 alpha-exon inclusion. Cancer Res 63: 6154–6157.
48. Jin W, McCutcheon IE, Fuller GN, Huang ES, Cote GJ (2000) Fibroblast growth factor receptor-1 alpha-exon exclusion and polypyrimidine tract-binding protein in glioblastoma multiforme tumors. Cancer Res 60: 1221–1224. 49. Clower CV, Chatterjee D, Wang Z, Cantley LC, Vander Heiden MG, et al.
(2010) The alternative splicing repressors hnRNP A1/A2 and PTB influence pyruvate kinase isoform expression and cell metabolism. Proc Natl Acad Sci U S A 107: 1894–1899.
50. Grover R, Ray PS, Das S (2008) Polypyrimidine tract binding protein regulates IRES-mediated translation of p53 isoforms. Cell Cycle 7: 2189–2198. 51. Schepens B, Tinton SA, Bruynooghe Y, Beyaert R, Cornelis S (2005) The