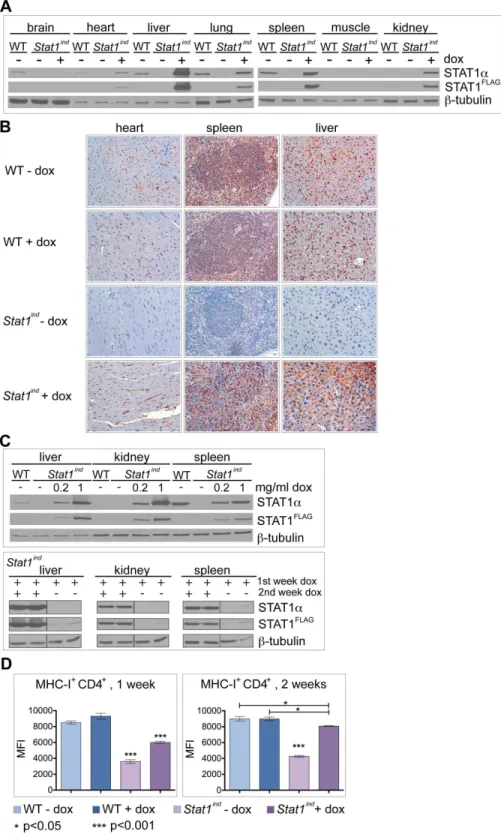
Inducible, dose-adjustable and time-restricted reconstitution of STAT1 deficiency in vivo.
Texto
Imagem

Documentos relacionados
Shown are the intracellular cAMP levels after 2 hrs of treatment (T2h) compared to that in untreated cells at zero hour time point (T0). B) Validation of differential expression
Purified cells of the STAT1 -deficient LSK and LS − K cells (1 × 10 3 ) were further stimulated by IL-27 and SCF for more 1 week and the cell number of expanded cells was counted
Concomitant assessment of pre-treatment STAT1- nuclear translocation in hepatocytes and IL28B rs8099917 favorable genotype improves the prediction of SVR in HCV genotype
As shown in Figure 2B, the mRNA expression levels of Oct4, Nanog and Sox2 were similar in both shHP1 c cells and control cells, indicating that the decrease in HP1 c expression did
Specifically, IFN- α induced the phosphorylation of STAT1 and USP18 silencing enhanced the STAT1 activation and phosphorylation for a longer periods of time compared to the
IFN α stimulation of HeLa cells was performed by incubating cells with 3 ng/mL rhIFN α 2a (ImmunoTools) for either 30 minutes (Western blot analysis of STAT1 and STAT2
Upon overexpression of miR-124 in Daoy cells, Nur77 mRNA and protein levels and the mRNA levels of Nur77 target genes decreased, showing that miR-124 affects not only Nur77
To determine whether the Ube1l − / − sub-populations with distinct surface H-2Kb expression exhibit distinct STAT1 activity, each sub-population was separately sorted according to
