Adv. Geosci., 25, 135–141, 2010 www.adv-geosci.net/25/135/2010/ doi:10.5194/adgeo-25-135-2010
© Author(s) 2010. CC Attribution 3.0 License.
Advances in
Geosciences
Evaluating the improvements of the BOLAM model of the ISPRA
Sistema Idro-Meteo-Mare on the December 2008 flood event in
Rome
M. Casaioli, B. Lastoria, S. Mariani, and M. Bussettini
ISPRA – Institute for Environmental Protection and Research, Rome, Italy
Received: 30 October 2009 – Revised: 21 March 2010 – Accepted: 29 March 2010 – Published: 8 June 2010
Abstract. The Sistema Idro-Meteo-Mare is an integrated meteo-marine forecasting chain for the Mediterranean basin. The recent update of the meteorological segment, based on the hydrostatic BOlogna Limited Area Model (BOLAM), gives the opportunity for a comparative verification study on a Mediterranean cyclone. The 10–12 December 2008 flood event in Rome has been chosen as case study. This disas-trous event was claimed to be an extreme one by mass-media; however, its return time is shown here to be about 5 years. The Mediterranean cyclone responsible for the flood offers a tough case study in order to verify the model’s ability in reproducing the evolution of meso-synoptic features in the Mediterranean environment. A qualitative comparison, em-ploying satellite data and derived products, is performed. Re-sults suggest that the upgraded model provides a more real-istic representation of the cyclone warm sector – where the main rainfall peak took place – whereas the error in the cy-clone trajectory and shape evolution is less affected by the BOLAM improvement.
1 Introduction
Mediterranean weather is characterized by a complex phe-nomenology, involving the interaction of synoptic-scale pat-terns with local forcing, including orography, moist pro-cesses, and sea/land distribution. From an operational point of view, a correct prediction of all these interconnected phe-nomena is needed in order to face a wide class of natural haz-ards, including windstorms, sea surges and high tide events (the famousacqua altain Venice) and the hydrological cycle extremes at different timescales (such as floods and drought events) and their consequences (landslides, forest fires, etc).
Correspondence to:M. Casaioli ([email protected])
These motivations drove in the late nineties the develop-ment of an integrated meteo-marine forecasting chain (Spe-ranza et al., 2004, 2007), named Sistema Idro-Meteo-Mare (Hydro-Meteo-Marine Forecasting System – here-inafter SIMM), at the formerDipartimento dei Servizi Tec-nici NazionaliofPresidenza del Consiglio dei Ministri (De-partment of National Technical Services of the Italian Cab-inet Presidency), now part of theIstituto Superiore per la Protezione e la Ricerca Ambientale (ISPRA – Institute for Environmental Protection and Research).
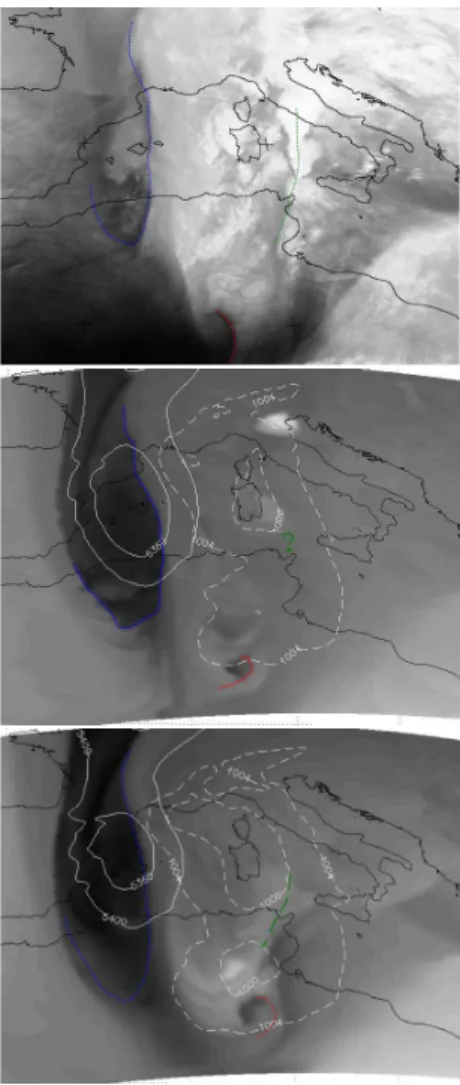
Fig. 1.500-hPa (top row, courtesy of Berliner Wetterkarte) and surface (bottom row, courtesy of UK MetOffice) weather charts at 00:00 UTC for 10 December 2008 (left), 11 December 2008 (middle), and 12 December 2008 (right).
flood event in Rome has been analyzed. This event caused the death of one person and relevant damages and received a wide media coverage; thus, to determine whether it was been properly labelled as “extreme” or not, as media addressed it, we calculated rainfall and discharge return period. More-over, since the weather system responsible of the event – a Mediterranean cyclone – is a quite difficult target for LAM forecasting, this event has been chosen as a verification case study, aimed at a first evaluation of the added value of the BOLAM update with respect to the SIMM forecast quality.
In such an approach, the ability of the model in reproduc-ing the rainfall time series over the event area has been as-sumed as an indicator of the forecast quality. In order to explain the different model versions’ performances, an inter-comparison against satellite products – including EUMET-SAT’s Multisensor Precipitation Estimate (MPE) and ME-TEOSAT second generation (MSG) 6.2 µm WV channel im-agery – has been performed. A simple Pseudo-Water Vapor (PWV) image generation technique has been used for MSG WV vs. model comparison.
Section 2 describes the event and its effects and it presents results about the return period estimated using rain gauge and stream gauge data. Section 3 includes a brief description of the competing model versions, and the other employed ob-servation data used in the study, along with methodological issues. In Sect. 4, verification results are presented. Finally, conclusions are drawn in Sect. 5.
2 The December 2008 Tiber flood
On 10–12 December 2008, intense precipitation struck the Tyrrhenian Sea side of the Italian peninsula, inducing a flood event over the Tiber river and its tributary, the Aniene river, which captured the attention of national and international media.
The relevance of the event was caused by the actual dam-ages occurred in several zones over the area of Rome, by dis-rupting flight and train services, by blocking off major roads leading to Rome, by flooding underpasses and by sealing off industrial activities sited in the flooded areas, in particular nearby the confluence of the Aniene river with the Tiber river. In addition, about 500 people were evacuated and a woman died in her car which was submerged by a wave of water and mud in an underpass.
2.1 Synoptic analysis
M. Casaioli et al.: Evaluating the improvements of the BOLAM model 137 a meridional range of surface minima from Genoa Gulf to
Tunisia aligned with the trough aloft, southernly elongated (Fig. 1, top center panel). Such a synoptic pattern, forced by the Omega-blocking, can be favourable for the development of convection in the warm sector (i.e., over the Tyrrhenian Sea), through upper divergent flow on the leading side of the trough. The last day (Fig. 1, left side panels) the structure rotated, staying over the Italian Peninsula and getting more compact. It must be noted that, on days 15 and 16, a big-ger, synoptic-scale cyclone induced later heavy rainfall on the same area (not shown). This provided further alert about the Tiber river level.
2.2 The return period estimate
The event captured the attention of national and international media – in particular due to the downpours and to the dam-ages which would have occurred if Tiber river had over-flowed its banks – being labelled as an “extreme” one by several sources. In order to substantiate such a statement, a frequency analysis of the event has been performed from both a pluviometric and a hydrometric point of view.
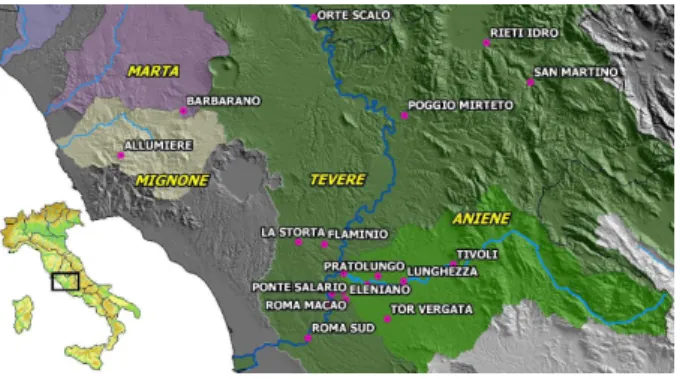
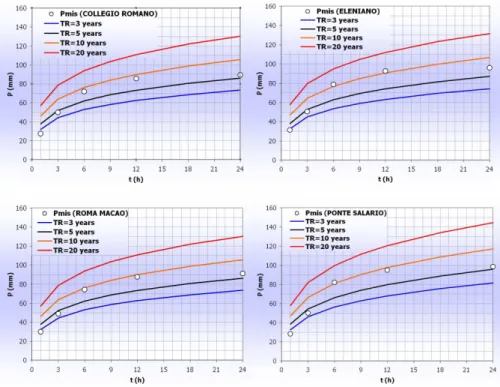
First, time series from 18 rain gauges located in Rome and its surroundings (Fig. 2) have been employed to calcu-late the precipitation return period (TR) for several time du-rations, employing the regionalization of intense precipita-tion provided by Calenda et al. (1994). Staprecipita-tions located in the central Rome urban area provide a return period of about 10 years for the 6-h and 12-h accumulated precipitation se-ries (Fig. 3), whereas the return period for the stations located in the Aniene river basin is generally about less than 5 years for all considered durations (not shown).
Concerning discharge, the Tiber reached the peak water level of 12.55 m at the Ripetta station, in the centre of Rome, on 13 December at 00:30 UTC (1:30 a.m. local time). This level was higher than those observed during the last ten years (which reached 11.41 m in December 2005 at the utmost), but it was by far under the historical maximum of 16.90 m observed in 1937. According to the historical classification by Frosini (1977), this is below the threshold for “extraor-dinary” flood (13 m, corresponding to flooding due to sewer backwater effect) and far below the “exceptional flood” level (16 m, as the Tiber river overcomes the embankments in the city centre).
Using the Kolmogorov-Smirnov test, it has been deter-mined that the probabilistic distribution representing the an-nual maxima peak flow series is the normal distribution (Fig. 4, top panel). The TR value corresponding to the ob-served peak discharge value (Qc=1676.12 m3s−1) is equal
to 5 years (Fig. 4, bottom panel). Finally, a Two Component Extreme Value (TCEV) distribution (Calenda et al., 2003) has been used to determine the return period of the peak flow reached at the Lunghezza stream gauge (Aniene river). The observed peak discharge value (Qc=261 m3s−1) is
associ-ated with a return period of 4.5 years (not shown).
Fig. 2. Map of rain gauge stations in the low Tiber Valley, with indication of its geographic position in Central Italy.
After these results, the event cannot be defined as an ex-treme one. This is also coherent with the fact that, after the building of the Corbara dam (in the high Tiber valley) in 1965, the peak discharge value observed in December 2008 at Ripetta was reached at least 3 other times (not shown).
3 Models, data sets and methodology
The two BOLAM versions compared here are the one op-erational from late 2000 on the massively parallel super-computer QUADRICS (thus, named QBOLAM; Speranza et al., 2004) and subsequently ported on a SGI ALTIX parallel platform, and an updated version of the model acquired in 2007 (hereinafter BOLAM 2007). This latter version, with some modifications, has been recently parallelized and im-plemented into the operational SIMM forecasting chain.
Due to limitations of the QUADRICS architecture, QBO-LAM employed simplified parameterization schemes for convection (based on Kuo scheme) and radiation, together with the Louis scheme for turbulence and a three-layer soil model. BOLAM 2007 employs instead Kain-Fritsch convec-tion parameterizaconvec-tion, a combined Geleyn-Morcrette scheme for radiation, the E-l turbulence scheme and a four-layer soil model. Hybrid vertical coordinate in place of the former sigma one, a more precise advection scheme (the Weighted Average Flux scheme in place of the Forward-Backward Ad-vection Scheme) and explicit adAd-vection of five hydrometeors are also present in BOLAM 2007. Both the model versions employ ECMWF analysis and forecast as initial and bound-ary conditions respectively, starting daily at 12:00 UTC.
Fig. 3.Precipitation return periods for four rain gauges in the Rome urban area, as a function of the accumulation time.
a 3-h basis) have been considered for the comparison. Be-sides, to obtain a continuous forecast time series for each model version, the first valid day of each daily run (with lead time from from +12 h to +36 h) has been joined in sequence. The time series comparison is shown in Fig. 5, whilst results are fully discussed in the next section.
EUMETSAT’s Multi-sensor Precipitation Estimate (MPE) is employed for space-time rainfall pattern verification. MPE is obtained as an adaptive regression from 10.8 IR MSG data, calibrated in quasi-realtime using co-located mi-crowave (SSM/I) rainfall observations to build up look-up tables valid for a limited space-time extent. Although not suitable for quantitative verification, this product provides a valid qualitative reference for diagnosis and forecast verifi-cation of space-time rainfall patterns, at least for convective precipitation (Heinemann and Ker´enyi, 2003).
PWV images, suitable to be compared with MSG WV im-agery, are calculated as the temperature on the 75 mg kg−1
specific humidity surface, ranking from the top. This tech-nique, developed for METEOSAT-7 WV (Fehlmann and Davies, 1997), is still valid for MSG channel 6.2 since the images are qualitatively identical, as it can be seen in the two satellites’ overlap period. The PWV technique (Santurette and Georgiev, 2005) is powerful, since it allows identifying and tracking structural elements of the evolving weather sys-tems both in the observations and in the models’ forecasts, thus providing hints on the origin of the possible forecast er-ror.
M. Casaioli et al.: Evaluating the improvements of the BOLAM model 139
4 Results
4.1 QPF verification
Ground based observations (black line in Fig. 5) identify, for the 10–12 December episode, a main rainfall peak over the area (marked with B) in the morning of day 10, and two mi-nor peaks on day 10 (marked with A) and 12 (marked with D), respectively. While A and D peaks are clearly due to frontal passages (a warm front for peak A – see Fig. 1, left column; and an occlusion for peak D – see Fig. 1, right col-umn), the main peak B is connected, instead, with the de-velopment of convection into the warm sector, rather than to frontal passages (see middle top panel of Fig. 1). Thus, it is interesting to note that both model versions poorly forecast the B peak, whereas the forecast of the “frontal” peaks A and D is quite satisfying. Moreover, both model versions display a good ability in forecasting the subsequent 14–15 December episode, connected with a big synoptic cyclone (not shown). Concerning the main peak B, it is heavily underestimated in the QBOLAM forecast (red curve), which predicts a “fake” peak 12 h later (marked with C). The BOLAM 2007 version (blue curve) produce a better forecast, since it reduces the underestimate of peak B and halves peak C (although it does not eliminate completely the peaks’ error).
4.2 Qualitative verification against METEOSAT products
METEOSAT imagery displays as convection develops dur-ing the night of 10 December, east of a meridional line at the centre of the warm sector, evolving in V-shaped MCSs on the Tyrrhenian Sea (not shown); such a convective devel-opment in the middle of the warm sector is not rare over the Tyrrhenian Sea and can be connected, along with synoptic forcing, with convergence forced by a low-level jet along the flank of the Italian Peninsula (Buzzi, 2009, personal commu-nication). In correspondence to peak B, MPE displays a big squall line over Central Italy (Fig. 6, top panel) and very light precipitation over the fronts – however, the ability of MPE in estimating stratiform precipitation is questionable (Heine-mann and Ker´enyi, 2003). QBOLAM predicts only a single, elliptical cell shifted northwards, and (seemingly) overesti-mates frontal precipitation (Fig. 6, middle panel and Fig. 1, central column). In the BOLAM 2007 forecast (Fig. 6, bot-tom panel), frontal precipitation is less intense than in QBO-LAM. The squall line is clearly visible, although underesti-mated in intensity and slightly rotated clockwise with respect to the observed one.
In the MSG WV image for peak B, a high PV anomaly is visible as a dark tongue over the Balearic Islands (Fig. 7, top panel) and can be used to identify the position and the devel-opment stage of the cyclone (see blue dotted line in Fig. 7). For both model versions, the dark tongue shows an exces-sive concavity on its eastern flank (over the Gulf of Lion).
Fig. 5. Time series comparison during the December 2008 event between the observed precipitation values averaged over the low Tiber valley and the corresponding average values predicted by the two BOLAM’s versions.
Fig. 6. 3 h-accumulated precipitation at 03:00 UTC 11 December 2008. Top: MPE; middle: QBOLAM; bottom: BOLAM 2007.
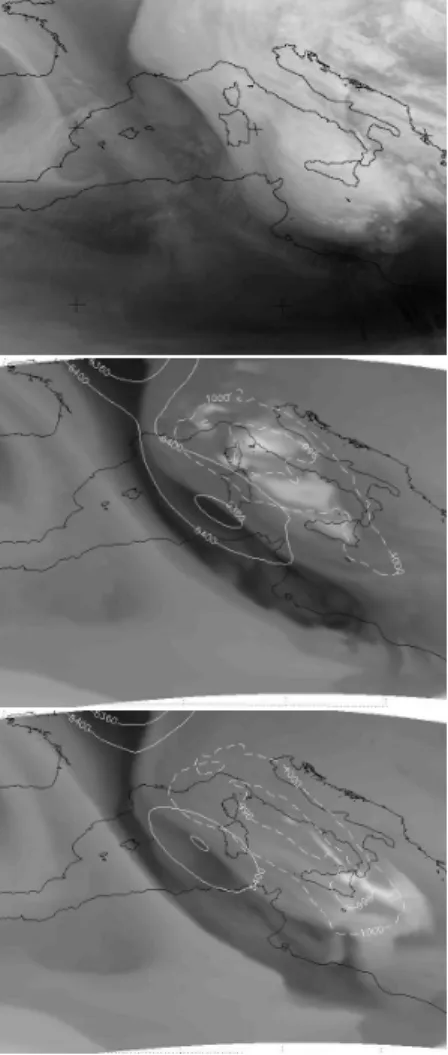
Fig. 7.PWV analysis at 00:00 UTC 11 December 2008. Top: MSG 6.2 WV image; middle: QBOLAM PWV image; bottom: BO-LAM 2007 PWV image. Selected GPH 500 hPa isolines (white solid lines) and surface isobars (white dashed lines) are included, for reference, on forecast plots.
This is not the case for the mesoscale features: in fact, a light grey band – indicating moist, ascending air – is present over the Tyrrhenian Sea in the BOLAM 2007 PWV image (Fig. 7, bottom panel, green dashed line) in correspondence with the observed rain band (Fig. 7, top panel, green dotted line), but not in the QBOLAM one (Fig. 7, middle panel).
To interpret this result we can argue that, whereas the oc-currence of convection in the warm sector is forced by the synoptic pattern, the actual distribution of convective struc-tures results from the mesoscale circulation downstream of the African cyclone during the previous 24 h. This point is evidenced by a thorough inspection of the upper-level circu-lation in the two models’ runs, well exemplified by the final 300-hPa potential vorticity pattern. In the QBOLAM fore-cast (Fig. 8, top panel), a chaotic PV pattern has been ad-vected over the Tyrrhenian Sea, disrupting – just north of the
Fig. 8. 300-hPa PV, GPH, and wind at 00:00 UTC 11 Decem-ber 2008. Top: QBOLAM; bottom: BOLAM 2007.
Tunisian coast – the leading jet structure. Such quite unreal-istic turbulent pattern originates downstream of the African cyclone about 12 h earlier and evidences the poor ability of the old model in representing the convection-driven cyclone development over complex terrain. On the contrary, PV fil-aments visible in the BOLAM 2007 forecast (Fig. 8, bottom panel) are more realistic, as a results of the improvement in wet processes treatment; so that a positive PV streak propa-gates towards the Thyrrenian Sea.
This can explain why the squall line associated to peak B is at least partly reproduced. However, it is not clear whether the residual forecast error (which results in a precipitation underestimation) is due to the shift error on synoptic fea-tures or to a still incorrect representation of the warm sector structures arising from convection downstream the African cyclone.
M. Casaioli et al.: Evaluating the improvements of the BOLAM model 141
Fig. 9.PWV analysis at 15:00 UTC 11 December 2008. Top: MSG 6.2 WV image; middle: QBOLAM PWV image; bottom: BOLAM 2007 PWV image.
deep convection, have no observational counterpart; how-ever, this feature is less pronounced in the new model’s fore-cast (Fig. 9, bottom panel) which, in addition, displays a more realistic behaviour in the south-west of Sicily.
5 Conclusions
Far from being an extreme event, the 10–12 December 2008 cyclone is nevertheless a hard task for quantitative precipi-tation forecast, especially when aiming at flood prediction, which is particularly demanding for adequate precision both in space and time, so results are encouraging. In particular, by comparing the state-of-the-art BOLAM version with the older one (QBOLAM), no evidence is found that the model upgrade is able to reduce the forecasting error about the posi-tion and the shape of the cyclone. Anyway, BOLAM 2007 is able to improve, at least partly, the poor description of the in-ner details of the cyclone given by QBOLAM. This includes
the formation of the rain band responsible for the main pre-cipitation peak over the Tiber valley. To determine whether these results presents some kind of generality, more extensive verification studies will be needed; such studies are already scheduled in connection with the system development activ-ity ongoing at ISPRA.
Acknowledgements. Authors would to thank for their support and help Christophe Accadia (EUMETSAT, Germany), Alexandre Lan-ciani (ISPRA, Italy), Simona Flavoni (LOCEAN-IPSL-CNRS, France), Nazario Tartaglione (University College Dublin, Ire-land), Andrea Buzzi (ISAC-CNR, Italy) and Antonio Speranza (University of Camerino, Italy). MSG images and MPE data are courtesy of EUMETSAT. Weather charts are courtesy of Berliner Wetterkarte and UK MetOffice.
Edited by: S. C. Michaelides
Reviewed by: two anonymous referees
References
Accadia, C., Mariani, S., Casaioli, M., Lavagnini, A., and Speranza, A.: Verification of precipitation forecasts from two Limited Area Models over Italy and comparison with ECMWF forecasts using a resampling technique, Weather Forecast, 20, 276–300, 2005. Calenda, G., Campolo, F., Cosentino, C., and Guercio, R.:
Va-lutazione delle piene nei bacini delle sezioni idrografiche di Roma e Pescara, in La valutazione delle piene in Italia-Rapporto Nazionale di Sintesi, Bozza, CNR-GNDCI, Allegato F, 1994. Calenda, G., Mancini, C. P., Cappelli, A., Gaudenzi, R.,
Lasto-ria, B., Merloni, G., Bianchini, A., and Federici, U.: Studi per l’aggiornamento del Piano Stralcio per l’assetto idrogeologico, Rapporto Finale, 2003.
Fehlmann, R., and Davies, H. C.: Misforecast of synoptic systems: Diagnosis via PV retrodiction, Mon. Weather Rev., 125, 2247– 2264, 1997.
Frosini, P.: Il Tevere, le inondazioni di Roma e i provvedimenti presi dal governo italiano per evitarle, Accademia Nazionale dei Lincei, Roma, 1977.
Heinemann, T. and Ker´enyi, J.: The EUMETSAT Multi Sensor Pre-cipitation Estimate (MPE): Concept and validation, Proceedings of the EUMETSAT users conference, Weimar, Germany, 2003. Santurette, P. and Georgiev, C. G.: Weather Analysis and
Forecast-ing: Applying Satellite Water Vapor Imagery and Potential Vor-ticity Analysis, Academic Press, London, 179 pp., 2005. Speranza, A., Accadia, C., Casaioli, M., Mariani, S., Monacelli, G.,
Inghilesi, R., Tartaglione, N., Ruti, P. M., Carillo, A., Bargagli, A., Pisacane, G., Valentinotti, F., and Lavagnini, A.: POSEI-DON: An integrated system for analysis and forecast of hydro-logical, meteorological and surface marine fields in the Mediter-ranean area, Nuovo Cimento, 27 C, 329–345, 2004.