Security Risk Assessment of Cloud Computing
Services in a Networked Environment
Eli WEINTRAUB
Department of Industrial Engineering and Management Afeka Tel Aviv Academic College of Engineering
Tel Aviv, Israel
Yuval COHEN
Department of Industrial Engineering and Management Afeka Tel Aviv Academic College of Engineering
Tel Aviv, Israel
Abstract—Different cloud computing service providers offer their customers' services with different risk levels. The customers wish to minimize their risks for a given expenditure or investment. This paper concentrates on consumers' point of view. Cloud computing services are composed of services organized according to a hierarchy of software application services, beneath them platform services which also use infrastructure services. Providers currently offer software services as bundles which include the software, platform and infrastructure services. Providers also offer platform services bundled with infrastructure services. Bundling services prevent customers from splitting their service purchases between a provider of software and a different provider of the underlying platform or infrastructure. In this paper the underlying assumption is the existence of a free competitive market, in which consumers are free to switch their services among providers. The proposed model is aimed at the potential customer who wishes to compare the risks of cloud service bundles offered by providers. The article identifies the major components of risk in each level of cloud computing services. A computational scheme is offered to assess the overall risk on a common scale.
Keywords—Cloud Computing; Risk Management; Information Security; Cloud Risks; Software as a service; Platform as a service; Infrastructure as a service
I. INTRODUCTION
Traditionally, organizations base their computing facilities on server farms located inside the organization in geographical central sites. In the last years organizations began to shift parts of their computing infrastructures outside the geographic organizational borders to the cloud, where the facilities are owned and managed by other organizations. Reference [1] states that shifting computing infrastructure outside the geographic borders enforces performing changes in production processes and technological changes. Those organizations have to establish new processes of production control, service level monitoring, and resolve security and privacy issues.
Cloud Computing (CC) typically deals with organizations using computing services, communication and web applications. Most definitions state that CC technology enables on-demand services, scalability, and flexibility, in enlarging or downgrading computing consumption ([2] [3]). The National Institute of Standards and Technology (NIST) defines CC as a model for enabling convenient, on-demand network access to a shared pool of configurable computing resources (for example, networks, servers, storage,
applications and services) that can be rapidly provisioned and released with minimal management effort or service-provider interaction [4]. Reference [5] argues that occasionally cloud providers suffer outages, thus using a multi-cloud broker is a preferred solution to remove single point of failures. Reference [6] introduces an Inter-Cloud Computing additional layer on top of CC systems which enables shifting resources among the participating cloud systems in occasions of high-load levels.
Cloud computing targets four main groups of organizational customers: private, public, community and hybrid [7]. For private customers, cloud model computing infrastructure services are typically located outside the organization’s sites at a cloud service provider. A public customer typically chooses cloud service providers through a bidding process, issuing request for proposal, choosing the best proposal, and contracting for the best bidder having the best proposal. The cloud computing provider may use the same computing infrastructure for supplying the needs of other companies. In a community model, infrastructure services are shared by a group of customers. In a hybrid model, an organization can use infrastructure services supplied by public, private or as part of a community. Reference [8] researched the emerging themes in financial services technologies and found that cloud computing seems to be a cost-effective infrastructure affording capital efficiency for financial services providers.
This article reviews the main motivations and obstacles to adopting the cloud technology by companies. Information security has been found as a barrier to CC adoption, and is an issue dealt intensively in CC research [9]. Reference [10] researched CC trends, claims that security will not be a barrier for cloud adoption, since it will be implemented by centralized automated processes.
II. CLOUD COMPUTING ARCHITECTURE
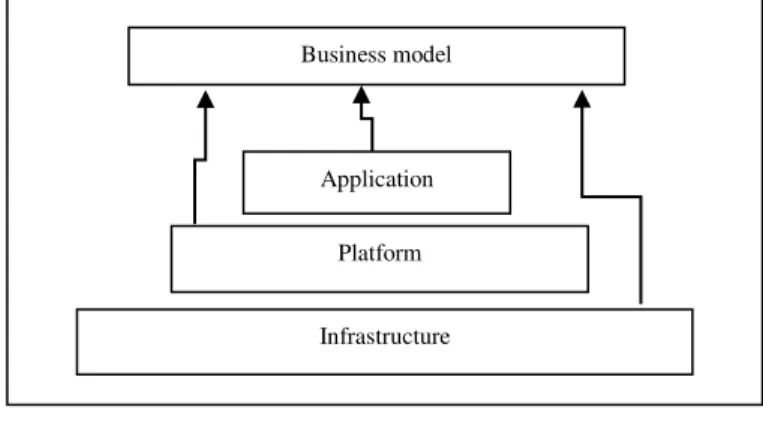
Cloud computing architecture is described in literature as consisting of three layers: IaaS, PaaS and SaaS. Each layer performs certain functions, serving consumers' requests and also supporting functions requested by upper layers. This separation to layers also fits current services offered by CC providers. Reference [7] defines a framework of CC architecture composing three layers of functions supporting cloud computing services. Fig. I describes architectures' components. Rectangles describe computing services. The business buys all cloud services from one SP.
Following the functions performed by each layer.
Infrastructure layer – This layer focuses on providing technologies as basic hardware components for software services. There are two kinds of infrastructures: storage capabilities and computing power.
Platform layer - includes services which are using cloud infrastructures needed for their functioning. There are two kinds of platform services: development and business platforms. Development platforms are aimed for usage by developers who write programs before transferring them to production and usage by organizations' users. Business platforms enable organizational developers make adaptations of software packages for deployment in their organizations.
Application layer - consists of the programs and human interfaces used by the organizations' end-users. Applications are running on cloud assets, making use of platform and infrastructure layers. There are two kinds of services in this layer: applications and on-demand services. Application services are software packages ready for end-users such as Microsoft Office, while on-demand services are software applications which are used by the organizations' customers. Those services are used according to on-demand needs, and used on a pay-per-use or fixed-price pricing model.
Service Providers (SP) offer their customers three kinds of services: IaaS, PaaS and SaaS. Each SP manages all underlying infrastructure for the offered service. For example a SP suggesting a SaaS product is also bundling into the product the PaaS and IaaS layers. Reference [11] states that according to cloud computing architecture a certain provider may run an application using another provider’s infrastructure, but in practice both providers are parts of the same organization. Current practice is that when a provider suggests selling a PaaS service he also bundles the IaaS layer in the deal. Such bundling by service providers limit free market forces from entering the competition, forcing customers pay for components they may buy cheaper from other providers. For example a customer may buy a SaaS service from SP1, but buy the underlying PaaS service from SP2 which sells the appropriate platform service cheaper than SP1. Reference [12] claims that in the future, developers will plan their cloud applications which will enable migration of services among clouds of multiple clouds. According to [11] cloud computing architecture is more modular compared to traditional hosting architectures based in server farms, and programs running on different layers are loosely coupled, thus enabling the development of a wide range of applications. Reference [2]
also claims that it is possible that applications belonging to different layers will be run on separate geographical locations even in different countries. Reference [13] claims that virtual machine migration allows transfer of a running application from one virtual machine to another, which may be provided by a different IaaS provider. Reference [14] proposes to make use of multiple distinct clouds simultaneously thus achieving security merits by making use of multiple distinct clouds simultaneously. This article continues the research direction proposed in [15] basing CC services on a dynamic business model which enables implementing functionalities of a service provider interfacing the underlying platform or infrastructure service by other service providers according to consumers' preferences. References [16] [15] demonstrate added values achieved in aspects of consumers' cost optimization and consumers' utility optimization. This research is aimed at suggesting a new technique for risk assessment which minimizes risks, utilizing the dynamic CC architecture. Implementing this required functionality puts two requirements on cloud architecture. The architecture should be based on open standards which will enable interfacing between many components among all providers in all three layers. Second, the architectures' building blocks should be loosely coupled. Implementation of those two functionalities should enable connectivity among vertical and horizontal services, thus eliminating the bundling phenomena. Figure II describes the dynamic CC architecture. Arrows describe services supplied by underlying layers. Rectangles describe cloud computing services. The business consumes its CC services from many SP's choosing the best combination of service providers.
Fig. 1. Current Cloud business model Architecture – One SP
Fig. 2. A Dynamic Architecture for Cloud Computing – Many SP's Business model
Application
Platform
Infrastructure
Business model
Application
Platform
III. CLOUD COMPUTING SECURITY RISKS
Researchers state that security challenges are among the biggest obstacles to adoption cloud services [14]. Reference [17] states that CC as the most prevalent IT outsourcing paradigm still entails serious IT security risks, and also states that researchers still are not able to fully capture the complex nature of IT security risks and how to measure it. Industry research and advisory company IDC analysts report that 87.5% of their members indicate that cloud security is their number 1 challenge [18]. Reference [19] States that managing security risks to business systems is getting more and more complex and time consuming, and many publications include proposals targeting the various cloud security threats. Following, an overview of research published in the cloud computing security risks domain.
Cloud security covers several categories. Reference [20] surveyed the research publications on cloud security issues, addressing vulnerabilities, threats, and attacks. In order to understand security risks, the authors identify the basic concepts underlying vulnerabilities and threats, and classify them as follows: virtualization elements, multi-tenancy, cloud platform and software, data outsourcing, data storage security and standardization and trust. The authors then address the security risks and topics involved in managing risks of each category. Reference [21] states that cloud threats are due to the complex virtualized infrastructure and dynamic nature of the cloud and they can be categorized to three kinds: (1) Multiple Users – A virtualized cloud layer such as IaaS can hold up various virtual machines and can provide multiple access to different users from around the globe, this kind of sharing is responsible for information leakage. (2) Minimal Control – Users of the cloud are not aware of the location of the physical server, as all these physical servers belong to the data centers of the providers hence the users are not aware of the location of their VMs and the provider is not aware of the contents of the VM or its applications hence giving a way to the security threats. (3) Single Point of control - All the virtualized servers are connected to one or limited number of network interface cards (NIC). This in turn causes more vulnerabilities in the virtual environment, any compromise to the security of the VMs or the physical server will lead to the compromise of either the VM or the physical server and will enable the hacker to gain access to either physical server. Reference [22] presents the results of a case study identifying real-world information security documentation issues for a Global Fortune 500 organization, should the organization decide to implement cloud computing services in the future. According to [22] security risks can be categorized to the following domains: Governance and Enterprise Risk Management; Legal Issues; Compliance and Audit Management; Information Management and Data Security; Interoperability and Portability; Traditional Security, Business Continuity and Disaster Recovery; Data Centre Operations; Incident Response; Application Security; Encryption and Key Management; Identity, Entitlement and Access Management; Virtualization. CSA's experts identified nine critical threats, ranked in descending order of severity: Data Breaches, Data Loss, Account Hijacking, Insecure APIs, Denial of Service, Malicious Insiders, Abuse of Cloud Services, Insufficient Due Diligence, and Shared Technology Issues. This list of threats
could serve as a guide to help users and providers make decisions about risk mitigation in their organizations [23]. Reference[17] proposes a comprehensive conceptualization of Perceived IT Security Risks in the CC context that is based on six distinct risk dimensions grounded on an extensive literature review, Q-sorting, and expert interviews. Second, a multiple-indicators and multiple-causes analysis of data collected from 356 organizations is found to support the proposed conceptualization as a second-order aggregate construct. The final set of six security risk dimensions is: Confidentiality, Integrity, Availability, Performance, Accountability and Maintainability risks. Each risk dimension is further categorized to risk items, in total 31 risk items. For example performance risk is categorized to network risks, scalability risks, underperformance risks and internal performance risks. Reference [19] presents a method to assess security risks including a cohesive set of steps to identify a complete set of security risks and also to assess them. The method is based on the integration of qualitative and quantitative models that focus on formal evaluation and assessment. In order to assess risks, risks are categorized to Six-View Perspectives: Threat view, Resource View, Process View, Risk Assessment View, Management View, and Legal View. To summarize, there is no one single framework describing all CC risk factors.
This paper follows ISACA's framework defined in [24]. The framework is designed to present practical guidance and facilitate the decision process for IT and business professionals concerning the decision to move to the cloud. The guide provides checklists outlining the security factors to be considered when evaluating the cloud as a potential solution. Evaluating cloud-related risks raises the need to define the information assets needing protection. Assets can be categorized to data, applications and processes. The impact of a migration to the cloud depends on the cloud service model and deployment model being considered. The combination of service model and deployment model can help identify an appropriate balance for organizational assets.
These assets are commonly subject to the following risk events:
Unavailability—The asset is unavailable and cannot be used or accessed by the enterprise.
Loss—The asset is lost or destroyed.
Theft—The asset has been intentionally stolen and is now in possession of another individual/enterprise. Theft is a deliberate action that can involve data loss.
Disclosure—The asset has been released to unauthorized staff/enterprises/organizations or to the public. This also includes the undesired, but legal, access to data due to different regulations across international borders.
IV. RISK MODELING
disclosure. It is therefore important to map the implications of these relationships as shown in figures III for applications and
processes, and figure IV for data.
Fig. 3. Qualitative characterization of applications and process risks
In terms of policy, in some cases the damage of temporary unavailability (of process or application) is so minor as to ignore it altogether. In case of process or application the theft damage is usually too small to justify insurance.
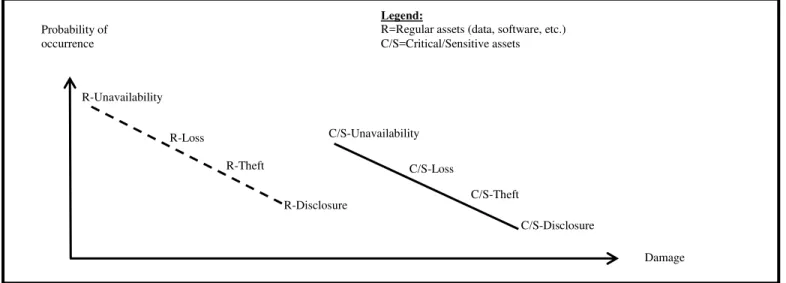
As to data: it its risk is mainly depends on the data’s criticality as shown in figure IV.
Fig. 4. Typical qualitative characterization of regular and critical organizational data risks
Naturally, the damage due to critical data risks is larger than the damage to regular data risks. The critical data are typically more protected and therefore its failure probabilities in figure IV are lower than those of the regular data. Note that disclosure of regular data has low risk, while the disclosure of critical data has higher risk. Also, temporary unavailability of regular data may be tolerated due to low damage. On the other hand, theft of critical data is typically insured.
The following discussion will lead to the assessment of risks that stem from possible damages and the occurrence probabilities/rates. The result is a set of weights according to which comparison of risks could be made.
Next, [24] published a list of CC risk factors. Common risk factors that are not linked solely to cloud infrastructures, but apply to all types of infrastructure, are not covered in the list. Examples of such risk factors include external hacking,
malicious insiders, mobile computing vulnerabilities, virus and malicious code and business impact due to provider inability. Following the list of risks, categorized to the three cloud layers, each risk includes an indication for either risk increasing (RI) or risk decreasing (RD). Additionally the description includes the types of risks and their severity level. From figure IV it is clear that the risk level increases from Unavailability to Loss, from Loss to Theft, and from Theft to Disclosure. While assigning values to severity levels may be an open issue, the following example is an arbitrary scheme where these values are increasing as mentioned above.
Example: IaaS Risk Grade Computations and SPs comparison
The proposed model intentionally takes a generalization approach to bypasses the details of the effects of each combination of: (1) factor, (2) risk-type, and (3) supplier.
Damage Loss
Temporary Unavailability
Theft Probability of
occurrence
Damage R-Loss
R-Unavailability
R-Theft Probability of
occurrence
C/S-Unavailability Legend:
R=Regular assets (data, software, etc.) C/S=Critical/Sensitive assets
C/S-Loss
C/S-Theft
C/S-Disclosure R-Disclosure
Instead, for each of the three layers (IaaS/PaaS/SaaS) two aggregated risk grades are computed: (1) Risk Increasing (RI) and (2) Risk Decreasing (RD). RI is related to a factor group that is partly oriented to exposure factors, whereas RD is more related to protection factors.
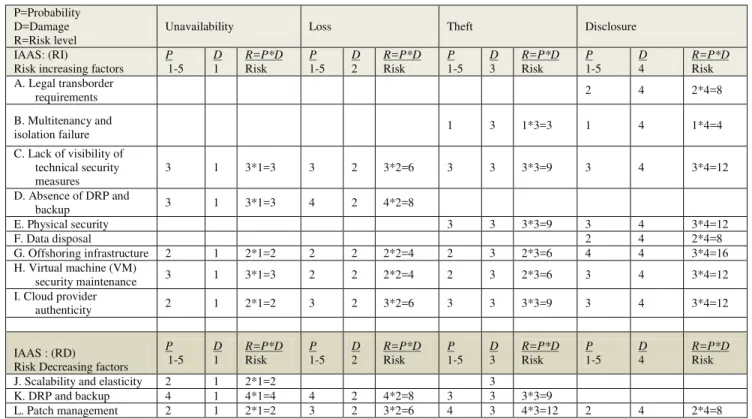
Table I not only differentiate between the RI/RD factors, it also depicts the probability and damage of each factor to the four risk types (Unavailability, Loss, Theft, and Disclosure). The risk level of each risk type is a measure of both the probability of occurrence and the expected damage of the risk realization. In the example, the probability and the damage are ranked on a 5 point scale (1 to 5) and the risk is the
multiplication of the probability rank and the damage rank. For each factor, each risk type is evaluated through such a multiplication yielding a scale of 1 through 25. In this way the risk level of each risk factor is computed by summing the relevant risk values over the 4 risk types (Unavailability, Loss, Theft, and Disclosure). For example, in Table I: the first factor ―Legal transcoder requirements‖ affects only the disclosure risk type having a probability rank of 2 and a damage of 4 which reflects risk level of 8. On the other hand the second risk factor“Multitenancy and isolation failure‖ is relevant to both theft (risk=3) and disclosure (risk=4) and therefore its risk level is 3+4=7.
TABLE I. EXAMPLE OF COMPUTING IMPORTANCE WEIGHTS FOR IAAS RISK FACTORS (VALUES ARE ARBITRARY-FOR ILLUSTRATION ONLY)
P=Probability D=Damage R=Risk level
Unavailability Loss Theft Disclosure
IAAS: (RI)
Risk increasing factors P 1-5
D 1
R=P*D Risk
P 1-5
D 2
R=P*D Risk
P 1-5
D 3
R=P*D Risk
P 1-5
D 4
R=P*D Risk A. Legal transborder
requirements 2 4 2*4=8
B. Multitenancy and
isolation failure 1 3 1*3=3 1 4 1*4=4
C. Lack of visibility of technical security measures
3 1 3*1=3 3 2 3*2=6 3 3 3*3=9 3 4 3*4=12
D. Absence of DRP and
backup 3 1 3*1=3 4 2 4*2=8
E. Physical security 3 3 3*3=9 3 4 3*4=12
F. Data disposal 2 4 2*4=8
G. Offshoring infrastructure 2 1 2*1=2 2 2 2*2=4 2 3 2*3=6 4 4 3*4=16
H. Virtual machine (VM)
security maintenance 3 1 3*1=3 2 2 2*2=4 2 3 2*3=6 3 4 3*4=12
I. Cloud provider
authenticity 2 1 2*1=2 3 2 3*2=6 3 3 3*3=9 3 4 3*4=12
IAAS : (RD)
Risk Decreasing factors P 1-5
D 1
R=P*D Risk
P 1-5
D 2
R=P*D Risk
P 1-5
D 3
R=P*D Risk
P 1-5
D 4
R=P*D Risk
J. Scalability and elasticity 2 1 2*1=2 3
K. DRP and backup 4 1 4*1=4 4 2 4*2=8 3 3 3*3=9
L. Patch management 2 1 2*1=2 3 2 3*2=6 4 3 4*3=12 2 4 2*4=8
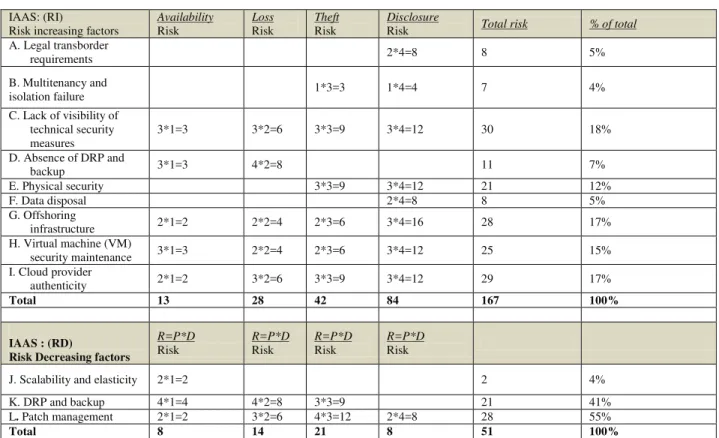
The risks of Table I are summarized in table II. Table II aggregates the risks of each risk factor and gives them weights proportional to their contribution to the total risk of the category (Category is defined by one of I/P/S and one of RI/RD). Once all the risk levels of a category (RI, or RD) are
TABLE III. SUMMARY OF IAAS RISK FACTORS FROM TABLE I.
IAAS: (RI)
Risk increasing factors
Availability Risk
Loss Risk
Theft Risk
Disclosure
Risk Total risk % of total
A. Legal transborder
requirements 2*4=8 8 5%
B. Multitenancy and
isolation failure 1*3=3 1*4=4 7 4%
C. Lack of visibility of technical security measures
3*1=3 3*2=6 3*3=9 3*4=12 30 18%
D. Absence of DRP and
backup 3*1=3 4*2=8 11 7%
E. Physical security 3*3=9 3*4=12 21 12%
F. Data disposal 2*4=8 8 5%
G. Offshoring
infrastructure 2*1=2 2*2=4 2*3=6 3*4=16 28 17%
H. Virtual machine (VM)
security maintenance 3*1=3 2*2=4 2*3=6 3*4=12 25 15%
I. Cloud provider
authenticity 2*1=2 3*2=6 3*3=9 3*4=12 29 17%
Total 13 28 42 84 167 100%
IAAS : (RD)
Risk Decreasing factors
R=P*D Risk
R=P*D Risk
R=P*D Risk
R=P*D Risk
J. Scalability and elasticity 2*1=2 2 4%
K. DRP and backup 4*1=4 4*2=8 3*3=9 21 41%
L. Patch management 2*1=2 3*2=6 4*3=12 2*4=8 28 55%
Total 8 14 21 8 51 100%
Thus, the IaaS importance weights appear on the right hand side of table II.
The next step is to grade the factor list of the alternative SPs. The grades are based on a 0 to 100 quality scale for each factor: where the best (minimum risk) =100 and the worst
(maximum risk) =0. This is kept consistent in grading of both RI factors and RD factors. Therefore, it is desirable to get high grades in both RI and RD factors.
TABLE IV. EXAMPLE OF IAAS RISK COMPARISON OF 3CCSPS
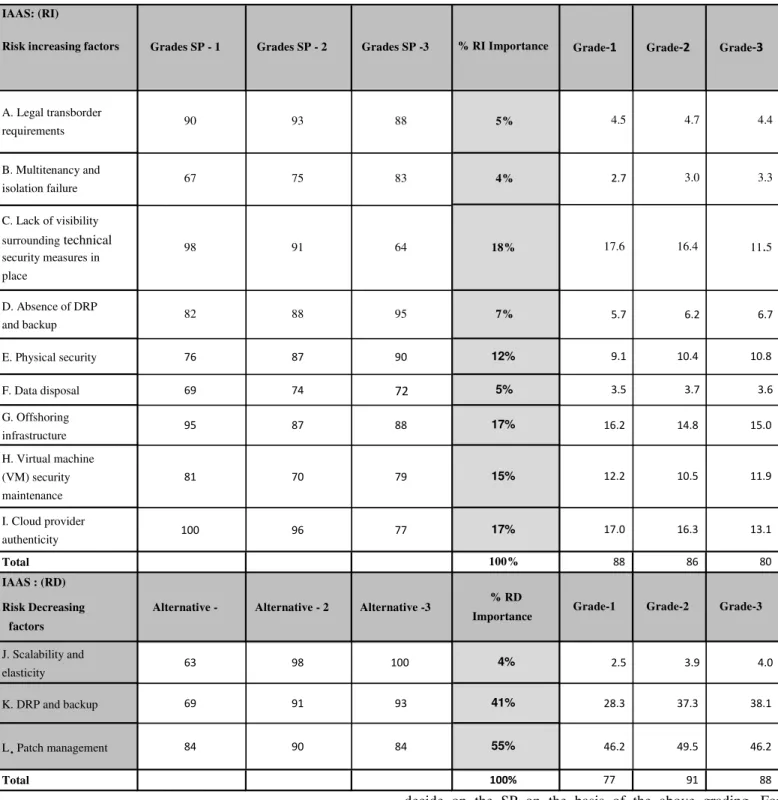
Thus, each SP has two graded components for the IaaS risk: (RI, RD)
SP1: (88, 77); SP2: (86, 91); SP3: (80, 88);
In cases where selecting a SP to a certain layer would be independent of the selection of SP to other layers we could
decide on the SP on the basis of the above grading. For example, a comparison shows that SP2 dominates SP3 (86>80, 91>88), and has a trade-off of (RI= -2, RD=14). Therefore, SP2 is the better choice as long as: (importance (RI)/importance (RD)) ≤7.
Continued example: PaaS and SaaS SP comparisons
The same procedure illustrated on IaaS is performed on the factors of PaaS and SaaS. To continue the example Tables IV and V show only the last part of comparing the three different IAAS: (RI)
Risk increasing factors
A. Legal transborder
requirements 90 93 88 5% 4.5 4.7 4.4
B. Multitenancy and
isolation failure 67 75 83 4%
2.7 3.0 3.3
C. Lack of visibility
surrounding technical security measures in
place
98 91 64 18% 17.6 16.4 11.5
D. Absence of DRP
and backup 82 88 95 7%
5.7 6.2 6.7
E. Physical security 76 87 90 12% 9.1 10.4 10.8
F. Data disposal 69 74 72 5% 3.5 3.7 3.6
G. Offshoring
infrastructure
95 87 88 17% 16.2 14.8 15.0
H. Virtual machine (VM) security
maintenance
81 70 79 15% 12.2 10.5 11.9
I. Cloud provider
authenticity
100 96 77 17% 17.0 16.3 13.1
Total 100% 88 86 80
IAAS : (RD)
Risk Decreasing
factors
J. Scalability and elasticity
63 98 100 4% 2.5 3.9 4.0
K. DRP and backup 69 91 93 41% 28.3 37.3 38.1
L . Patch management 84 90 84 55% 46.2 49.5 46.2
Total 100% 77 91 88
Alternative - Alternative - 2 Alternative -3 % RD
alternative SPs in each of the layers. Platform risks are weighted separately TABLE V. EXAMPLE OF PAAS RISK COMPARISON OF 3CCSPS
Thus each SP has two graded components for the PaaS risk: (RI (Increasing), RD (Decreasing)):
SP1: (65, 95); SP2: (75, 86);
SP3: (87, 90);
Considering PaaS grades, SP3 dominates SP2 (87>75 and 90>86), so SP2 is not a relevant candidate. The comparing SP3 to SP1 gives a trade-off: (18,-5) which favors SP3 as long as (importance (RD)/(importance(RI)≤3.4).
PAAS: (RI) Risk increasing factors
A. Application
mapping 63 63 82
29%
18.3
18.3
23.8
B. SOA-related
vulnerabilities 61 82 84
42%
25.6
34.4
35.3
C. Application
disposal 74 76 97
29%
21.5
22.0
28.1
Total 100%
65 75 87
PAAS : (RD)
Risk Decreasing
factors Alternative-1
D. Short
development time 94 93 86
46%
43.2
42.8
39.6
E. Platform security
features 95 80 94
54%
51.3
43.2
50.8
Total
100%
95 86 90
Grades SP - 2 Grades SP - 2 Grades SP -3 % RI
Importance Grade-1 Grade-2 Grade-3
Alternative - 2 Alternative -3 % RD
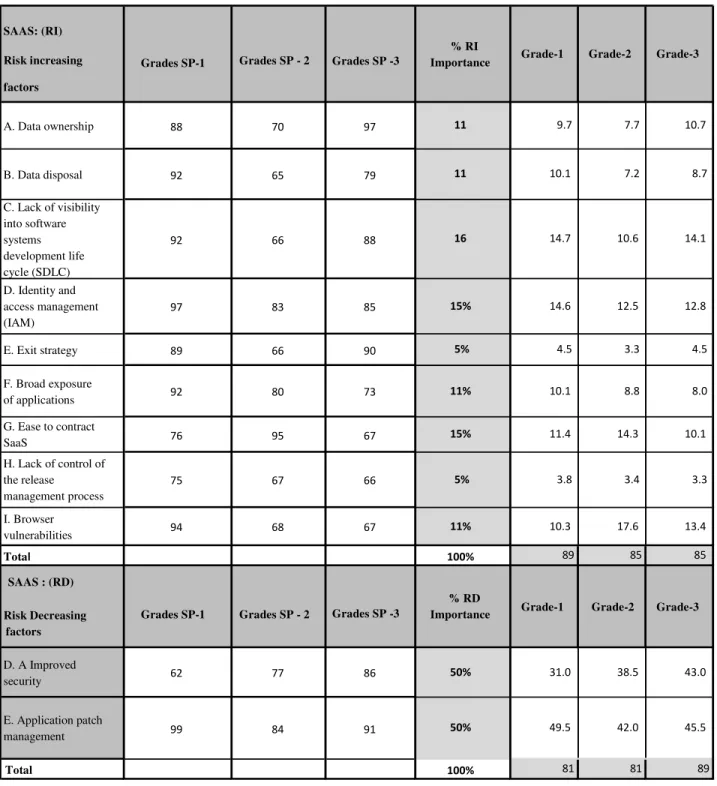
TABLE VII. EXAMPLE OF SAAS RISK COMPARISON OF 3CCSPS
Thus each SP has two graded components for the SaaS risk: (RI, RD):
SP1: (89, 81); SP2: (85, 81); SP3: (85, 89);
Considering SaaS grades, SP2 is dominated by both SP3 (85=85 but 89>81), and by SP1 (89>85 and 81=81) so SP2 is not a relevant candidate. However, the trade-off between SP3 and SP1 is: (-4, 8) so SP3 would be preferred as long as the
importance of RD is more than half the importance of RI. Else, SP1 would be selected.
Risk assessment in two Cloud Computing Architectures: One SP versus Many SP's.
In this section we compare two different scenarios: The first scenario is where SP's bundle their offerings in the three layers, consequently a choice of a single SP must be made. This scenario is implemented on the Current Cloud business model Architecture – One SP described in Fig. I. This scenario will lead to choose the least risky SP. The second scenario is SAAS: (RI)
Risk increasing
factors
Grades SP-1
A. Data ownership 88 70 97 11 9.7 7.7 10.7
B. Data disposal 92 65 79 11 10.1 7.2 8.7
C. Lack of visibility into software systems development life cycle (SDLC)
92 66 88 16 14.7 10.6 14.1
D. Identity and access management (IAM)
97 83 85 15% 14.6 12.5 12.8
E. Exit strategy 89 66 90 5% 4.5 3.3 4.5
F. Broad exposure
of applications 92 80 73 11%
10.1 8.8 8.0
G. Ease to contract
SaaS 76 95 67 15%
11.4 14.3 10.1
H. Lack of control of the release management process
75 67 66 5% 3.8 3.4 3.3
I. Browser
vulnerabilities 94 68 67 11% 10.3 17.6 13.4
Total 100% 89 85 85
SAAS : (RD)
Risk Decreasing factors
Grades SP-1
D. A Improved
security 62 77 86 50% 31.0 38.5 43.0
E. Application patch
management 99 84 91 50% 49.5 42.0 45.5
Total 100% 81 81 89
Grades SP - 2 Grades SP -3
% RD
Importance Grade-1 Grade-2 Grade-3 Grades SP - 2 Grades SP -3
% RI
where the competition and free market forces are leading so that services could be purchased independently for each of the three CC layers (infrastructure, platform and software). This scenario is implemented on the Dynamic Architecture for Cloud Computing – Many SP's, described in Fig. II.
For the case where SPs bundle their services (as in current practices) the assumption would be different. In such a case, each SP has the full chain of three layers to offer. Since the risk of any chain is reflected by the chain's most vulnerable
point, it is conceivable to grade the SPs by their minimum risk levels.
For example, SP1 risk grades are: IaaS (88, 77), PaaS (65, 95) SaaS (89, 81).
Therefore the grades for SP1 are: RI = Min{88, 65, 89) = 65; RD = Min{77, 95, 81) = 77, yieldingSP1 grade = (65,77). Computations for the bundling case in table IV. So the overall SP grades would be:
TABLE VIII. RISK COMPUTATIONS FOR THE BUNDLING EXAMPLE
Thus, under the assumptions of layers bundling and a single SP selection it is clear that SP3 dominates S2 which dominates SP1.
This is true for both the RI grades: 80>75>65, and the RD grades: 88>81>77.
So SP3 is selected with SP3 grade = (80, 88).
Under convergence to the free market competition, each layer would be independently selected. In this case customers choose the best SP for each layer independent of their decisions in other layers. Computations for the free market example in table VII.
TABLE IX. RISK COMPUTATIONS FOR THE FREE MARKET EXAMPLE
Thus, the maximal risk management solution leads to choosing SP2 for IaaS, and SP3 for PaaS and SaaS.
For this selection RI = Min{86,87,85} = 85; RD = Min{91,90,89} = 89
Thus, the overall grade is: (85, 89) which is better and dominates the single SP3 grade = (80, 88)
To conclude the first example, it has been demonstrated that the Dynamic proposed CC architecture enables achieving higher risk scores then the traditional one-SP model by choosing a combination of services offered by several CC SP's.
Second Example
It should be clear that once the importance percentages of various service items were set (as in tables I, II) they will stay constant for quite a while, and change only when overall revision is needed. On the other hand, the grades for these service items may change in time for certain suppliers and some new suppliers may join the competition.
Let us assume that two years after the grades above were computed a new decision point comes along and the new grades along with those of two new suppliers are now summarized in table VIII.
TABLE X. RISK COMPUTATIONS FOR THE SECOND BUNDLING EXAMPLE
Thus, under the assumptions of layers bundling and a single SP selection it is clear that SP5 dominates all the other SPs.
This is true for both the RI grades: 85>80>75>70, and the RD grades: 85>80>75.
So SP5 is selected at this point in time with SP5 grade = (80, 85).
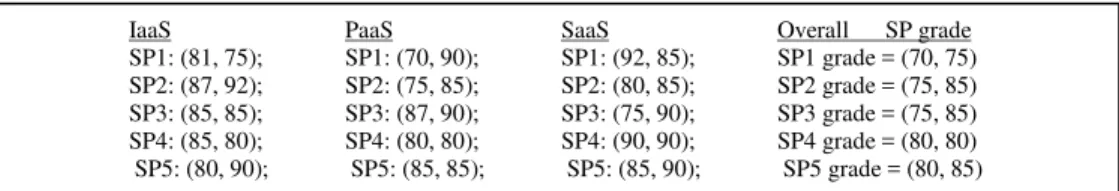
Under convergence to the free market competition, each layer would be independently selected. In this case customers choose the best SP for each layer independent of their decisions in other layers. Computations for the free market example in table IX.
IaaS PaaS SaaS Overall SP grade
SP1: (88, 77); SP1: (65, 95); SP1: (89, 81); SP1 grade = (65, 77)
SP2: (86, 91); SP2: (75, 86); SP2: (85, 81); SP2 grade = (75, 81)
SP3: (80, 88); SP3: (87, 90); SP3: (85, 89); SP3 grade = (80, 88)
IaaS PaaS SaaS
SP1: (88, 77); SP1: (65, 95); SP1: (89, 81);
SP2: (86, 91); SP2: (75, 86); SP2: (85, 81);
SP3: (80, 88); SP3: (87, 90); SP3: (85, 89);
Selected SP(grade): SP2 (86, 91); SP3 (87, 90); SP3 (85, 89);
IaaS PaaS SaaS Overall SP grade
TABLE XI. RISK COMPUTATIONS FOR THE SECOND FREE MARKET EXAMPLE
Thus, the maximal risk management solution leads to choosing SP2 for IaaS, SP3 for PaaS, and SP4 for SaaS.
For this selection RI = Min{87,87,90} = 87; RD = Min{92,90,90} = 90
Thus, the overall grade is: (87, 90) which is better and dominates the single SP5 grade = (80, 85).
This example shows that organizations should follow the decision process finding the best solution each time new SP enters the market, improving their risk grades. In addition, the dynamic model enables achieving improved risk grades over the traditional One-SP model.
V. CONCLUSIONS
This paper proposes a technique for evaluating and comparing risks between different service providers in the three CC layers. The technique is illustrated through a numeric example which also shows the advantage of free market competition, where purchasing services independently for each layer leads to a superior choice with least risk exposure.
Two preconditions are required for effective competition, and for our risk assessment models to be effective. We claim market forces are bound to cause these conditions to materialize in the long run. First, suppliers have to offer standard features of their services since comparing risk probabilities/damages has to relate to similar functionalities. This will be the ground for a comparison of dimensional risk scores relating to similar services. Second, software suppliers should build their services according to open standards, (which nowadays are not the case), thus enabling connectivity among different services offered by suppliers.
Future research directions may span the following directions: 1. Calculating risk according to specific proportional weights assigned to risk increasing versus risk decreasing factors up to consumers' risk appetite. 2. Enhancing the proposed technique to compute the optimized solutions by finding the risk increasing/decreasing proportion which bring the minimal risk. 3. Add deployment risk factors to risk computations as suggested by [24].
The proposed risk assessment model could be elaborated to incorporate the connectivity costs among different SP's. Interfacing a specific service between two SP's needs budget investments in the first establishing of the interface and in the ongoing budgetary expenses depending on service consumption. This raises the need for a multi-objective risk assessment model which takes into consideration optimizing risk assessment under budget costs.
REFERENCES
[1] T. Pueschel, A. Anandasivam, S. Buschek, and D. Neumann, "Making money with clouds: Revenue optimization through automated policy decisions". ECIS - European Conference on Information Systems 17, 2009.
[2] A. Velte, R. Elsenpeter, and T. J. Velte, "Cloud Computing: A practical approach". Tata McGraw-Hill Education Pvt. Ltd, 2009.
[3] L. Vaquero, L. Rodero-Merino, J. Caceres, and M. Lindner, "A Break in the Clouds: Towards a Cloud Definition. Editorial note". ACM SIGCOMM (2009). Computer Communication Review 50 Volume 39, Number 1, January 2009.
[4] P. Mell, and T. Grance, ―The NIST definition of cloud computing‖, National Institute of Standards and Technology, NIST, Vol. 53 No. 6, p. 50, 2009.
[5] Y. Mansouri, A. N. Toosi, and R. Buyya, "Brokering Algorithms for Optimizing the Availability and Cost of Cloud Storage Services", IEEE International Conference on Cloud Computing Technology and Science, 2013.
[6] T. Aoyama, and H. Sakai, "Inter-Cloud Computing", Business Information Systems Engineering, March 2013.
[7] C. Weinhardt, B. Blau, and J. Stößer, "Cloud Computing – A Classification, Business Models, and Research Directions". Business & Information Systems Engineering, May 2009.
[8] A. Gill, D. Banker, and P. Seltsika, "Moving Forward: Emerging Themes in Financial Services Technologies Adoption", Communications of the Association for Information Systems: Vol. 36, Article 12, 2015. [9] Z. Chen, F. Han, J. Cao, X. Jiang, and S. Chen, "Cloud
Computing-Based Forensic Analysis for Collaborative Network Security Management System", Tsinghua science and technology, Vol 18/1, February 2013.
[10] J. Staten, "Forrester, Cloud predictions for 2014: Cloud joins the IT portfolio", http://blogs.forrester.com/james_staten/13-12-04-cloud_computing_predictions_for_2014_cloud_joins_the_formal_it_por tfolio, accessed 02 March 2014.
[11] Q. Zhang, L. Cheng, and R. Bautaba, "Cloud computing: State-of-the-art and Research challenges", J Internet Serv Appl 1:7-18, 2010.
[12] F. Paraiso, N. Haderer, P. Merle, R. Rouvoy, and L. Seinturier, "A Federated Multi-Cloud PaaS Infrastructure", IEEE Fifth International Conference on Cloud Computing, 2012.
[13] U. Z. Rehman, F. K. Hussain, and O. K. Hussain, "Towards Multi-Criteria Cloud Service Selection", Fifth International Conference on Innovative Mobile and Internet Services in Ubiquitous Computing, 2011.
[14] J. Bohli, N. Gruschka, M. Jensen, L.L. Iacono, and N. Marnau, "Security and Privacy-Enhancing Multi cloud Architectures", IEEE Transactions on Dependable and Secure Computing, Vol. 10, No' 4, 2013.
[15] E. Weintraub and Y. Cohen, "Cost Optimization of Cloud Computing Services in a Networked Environment", (IJACSA) International Journal of Advanced Computer Science and Applications ,Vol. 6, No. 4, pp. 148-157, 2015.
[16] E. Weintraub and Y. Cohen, "Optimizing User's Utility from Cloud Computing Services in a Networked Environment", (IJACSA) International Journal of Advanced Computer Science and Applications, Vol. 6, No. 10, pp. 153-163, 2015.
[17] T. Ackermann, T. Widjaja, A. Benlian, and P. Buzmann, "Percieved IT Security Risks of Cloud Computing: Conceptualization and Scale
IaaS PaaS SaaS
SP1: (81, 75); SP1: (70, 90); SP1: (92, 85); SP2: (87, 92); SP2: (75, 85); SP2: (80, 85); SP3: (85, 85); SP3: (87, 90); SP3: (75, 90); SP4: (85, 80); SP4: (80, 80); SP4: (90, 90); SP5: (80, 90); SP5: (85, 85); SP5: (85, 90);
Development, Thirty Third International Conference on Information Systems, Orlando USA, 2012.
[18] C. A. Christiansen, C. J. Kolodgy, S. Hudson, and G. Pintal, IDC – White paper – "Identity and Access Management for Approaching Clouds", May 2010.
[19] S. B. Yadav, and D. Tianxi, "A Comprehensive Method to Assess Work System Security Risk," Communications of the Association for Information Systems: Vol. 34, Article 8, 2014.
[20] D. A. B. Fernandes, L. F. B. Soares, J. V. Gomes, M. M Freire and P. R. M. Inácio, "Security issues in cloud environments: a survey", Int. J. Inf. Secur. 13:113–170, 2014.
[21] B. Mansukhani and T. A. Zia, "The Security Challemges and Countermeasures of Virtual Cloud", Australian Information Security Management Confference, 2012.
[22] G. Grispos, W. Glisson, and T. Storer, "Cloud Security Challenges: Investigating Policies, Standards, and Guidelines in A Fortune 500 Organization", ECIS, 2013.
[23] CSA - Cloud Security Alliance, "The Notorious Nine Cloud Computing Top Threats in 2013", USA, 2013.