Lifestyle Behaviors in Metabolically Healthy
and Unhealthy Overweight and Obese
Women: A Preliminary Study
Sarah M. Camhi1*, Scott E. Crouter2, Laura L. Hayman3, Aviva Must4, Alice H. Lichtenstein5
1Exercise and Health Sciences Department, University of Massachusetts Boston, Boston, Massachusetts, United States of America,2Department of Kinesiology, Recreation, and Sport Studies, The University of Tennessee, Knoxville, Tennessee, United States of America,3Office of Vice Provost for Research, University of Massachusetts Boston, Boston, Massachusetts, United States of America,4Department of Public Health and Community Medicine, Tufts University School of Medicine, Boston, Massachusetts, United States of America,5JM USDA Human Nutrition Research Center on Aging, Tufts University, Boston, Massachusetts, United States of America
*sarah.camhi@umb.edu
Abstract
Background
Few studies have examined dietary data or objective measures of physical activity (PA) and sedentary behavior among metabolically healthy overweight/obese (MHO) and metaboli-cally unhealthy overweight/obese (MUO). Thus, the purpose is to determine whether PA, sedentary behavior and/or diet differ between MHO and MUO in a sample of young women.
Methods
Forty-six overweight/obese (BMI25 kg/m2) African American and Caucasian women 19–
35 years were classified by cardiometabolic risk factors, including elevated blood pressure, triglyceride, glucose and C-reactive protein, low high density lipoprotein, and insulin resis-tance (MUO2; MHO,<2). Time (mins/day) in light, moderate, vigorous PA, and sedentary behavior were estimated using an accelerometer (3 days;8 hrs wear time). Question-naires were used to quantify sitting time, TV/computer use and usual daily activity. The Block Food Frequency Questionnaire assessed dietary food intake. Differences between MHO and MUO for lifestyle behaviors were tested with linear regression (continuous data) or logistic regression (categorical data) after adjusting for age, race, BMI, smoking and accelerometer wear and/or total kilocalories, as appropriate.
Results
Women were 26.7±4.7 years, with a mean BMI of 31.1±3.7 kg/m2, and 61% were African
American. Compared to MUO (n = 9), MHO (n = 37; 80%) spent less mins/day in sedentary behavior (difference: -58.1±25.5, p = 0.02), more mins/day in light PA (difference: 38.2±
16.1, p = 0.02), and had higher daily METs (difference: 0.21±0.09, p = 0.03). MHO had
OPEN ACCESS
Citation:Camhi SM, Crouter SE, Hayman LL, Must
A, Lichtenstein AH (2015) Lifestyle Behaviors in Metabolically Healthy and Unhealthy Overweight and Obese Women: A Preliminary Study. PLoS ONE 10 (9): e0138548. doi:10.1371/journal.pone.0138548
Editor:Delphine Sophie Courvoisier, University of Geneva, SWITZERLAND
Received:July 10, 2015
Accepted:September 1, 2015
Published:September 18, 2015
Copyright:© 2015 Camhi et al. This is an open access article distributed under the terms of the
Creative Commons Attribution License, which permits unrestricted use, distribution, and reproduction in any medium, provided the original author and source are credited.
Data Availability Statement:All relevant data are within the paper and its Supporting Information file.
Funding:Funding support was provided by the University of Massachusetts Boston Proposal Development Grant (no grant number available) and the Boston Nutrition Obesity Research Center DK46200.
Competing Interests:The authors have declared
higher fiber intakes (g/day of total fiber, soluble fiber, fruit/vegetable fiber, bean fiber) and daily servings of vegetables; but lower daily dairy servings, saturated fat, monounsaturated fat andtransfats (g/day) compared to MUO.
Conclusion
Compared to MUO, MHO young women demonstrate healthier lifestyle habits with less sed-entary behavior, more time in light PA, and healthier dietary quality for fat type and fiber. Future studies are needed to replicate findings with larger samples that include men and women of diverse race/ethnic groups.
Introduction
Obesity is a complex and heterogeneous condition with considerable phenotypic variation.
One recent subgroup of interest is the metabolically“healthy”obese (MHO). These individuals
have more favorable lipid profiles [1], higher insulin sensitivity [2], and lower risks for
cardio-vascular disease [3] compared to their metabolically”unhealthy”obese (MUO) counterparts.
Lifestyle behaviors, such as physical activity (PA), diet and sedentary behaviors may differ-entiate MHO and MUO phenotypes, and suggest possible targets for intervention strategies to modify and lower cardiometabolic risk in individuals with excess body weight. Previous research has shown conflicting results concerning PA levels between MHO and MUO: some
studies have reported significantly greater levels of moderate-to-vigorous PA (MVPA) [4–6]
whereas others have reported no significant differences [1,2,7–10]. However, most research
utilized subjective methods such as questionnaires to estimate PA. Objective measures of physical activity levels have been estimated by overall energy expenditure (kcals/day) between MHO and MUO, however, these studies have been performed in primarily sedentary
postmen-opausal women, limiting the generalizability of the data and results to other populations [1,2,
9]. Other limitations in existing research which compare MHO and MUO are measures for
various PA types or domains, such as flexibility or strength training, which have been
associ-ated with lower body weight and more favorable cardiometabolic risk factors [11,12].
Few studies have examined sedentary behavior between MHO and MUO groups. No differ-ences have been reported between MHO and MUO for television time, a subjective measure of
one type of sedentary behavior [7,13]; however, other types of sedentary behavior measures
and/or assessments of sedentary time such as computer use, sitting time or objective assess-ment have not yet been evaluated.
Recent data suggest that higher overall dietary quality is associated with the MHO profile
[10,14], but other studies have not identified significant differences between MHO and MUO
for specific food groups [7] or macronutrient or micronutrient intakes [8]. However, these data
were reported from studies of middle aged adults [7], Koreans [8] and Irish adults [10],
pre-cluding generalizability to a young sample of African American and Caucasian women. The aim of this study was to compare PA, sedentary behavior and diet between MHO and MUO in a group of young African American and Caucasian women. MHO phenotypes track
from childhood to adulthood [15], and MHO is more likely to occur in African American
women [6] making this age, gender and race/ethnicity group a critical subgroup to include. We
Methods
Women were recruited from the student, staff and faculty members at the University of Massa-chusetts, Boston, and also from the surrounding city and suburbs. Criteria for inclusion were
African American and Caucasian females, U.S. born, 19–35 years of age and a body mass index
(BMI) of 25–39.9 kg/m2. Women were excluded if they were pregnant (currently or within past
6 months), breastfeeding, reported a body weight change of5kg (11 lbs) or major change in
dietary or exercise habits in past 6 months, reported a diagnosis of cardiovascular disease, dia-betes (type I or II), thyroid disease or HIV/AIDS, use of medications to treat elevated choles-terol, blood pressure or glucose, or taking any dietary supplements with known effects on cardiometabolic risk factors (ie., antioxidants, vitamin E, aspirin, fish oil). All methods and procedures were approved by the University of Massachusetts Boston Institutional Review Board, and all participants signed an informed consent prior to measurement.
Women self-reported demographic information, personal health history, family health his-tory, age, race/ethnicity, and smoking status (never, former or current). All measures were taken by certified technicians. Height was measured using a stadiometer after removing shoes, rounding up to the nearest 0.1 centimeter. Weight was measured to the nearest 0.1 kilogram with a digital scale Seca (Chino, CA) after all outer clothing, heavy pocket items and shoes were removed. Both height and weight were taken twice, with a third measurement obtained if
the first two measures were>0.5 cm or 0.5 kg, apart. BMI was calculated by dividing weight
(kg) by height squared (m2). Waist circumference (WC) was measured in duplicate at the level
of the iliac crest [16], and hip circumference was measured in duplicate at the maximal
circum-ference when viewed from the side. Waist-to-hip ratio (WHR) was calculated by dividing waist circumference by hip circumference. Means of the height, weight and waist circumference val-ues were used in all analyses.
Blood pressure was determined using an aneroid sphygmomanometer (American Diagnostic Corporation, Hauppauge, NY) using the right arm after a 5 minute rest. Mid-upper-arm circumference was used to determine the proper cuff size for accurately measuring
the participant’s blood pressure. A second measure was taken 1–2 minutes later, and the
aver-age systolic and diastolic measurements were used in all analyses.
All women fasted for a minimum of 10 hours prior to the venipuncture. After a 30 minute clotting period at room temperature, approximately 5 mL of blood were centrifuged at 3500 rpm for 15 minutes. Immediately following centrifugation, samples were aliquoted and frozen at -80°C until biochemical analyses. All biochemical assays were conducted by the Nutrition Evaluation Laboratory at the Jean Mayer USDA Human Nutrition Research Center on Aging at Tufts University (Boston, MA). Serum was analyzed for fasting glucose, total cholesterol, tri-glyceride, and high density lipoprotein cholesterol (HDL), low and very-low density lipopro-tein cholesterol (LDL and VLDL), glucose, insulin, C-reactive prolipopro-tein (hs-CRP). Lipid and glucose concentrations were measured on an automated chemistry analyzer (Olympus AU400) using reagents and calibrator from Beckman-Coulter. Insulin concentrations were measured using a radioimmunoassay (Human Insulin Specific RIA Kit; Linco Research Inc, St Charles, MO). Serum hs-CRP was measured immunoturbidimetrically (DiaSorin, Inc., Stillwater, MN) using a Roche Cobas Fara centrifugal clinical chemistry analyzer (Roche Diagnostics, Indianap-olis, IN). The homeostasis model of insulin resistance (HOMA-IR) was calculated as [(fasting
glucose (mmol/L)
fasting insulin(μU/ml)]/22.5[17].
MHO was defined as presence of overweight or obesity (25 to 39.9 kg/m2) and2 abnormal
cardiometabolic risk factors including elevated blood pressure (130 or85 mmHg),
(HOMA-IR>90thpercentile 5.49), and systemic inflammation (hs-CRP>90thpercentile
14.4 mg/L) [6].
Physical Activity and Sedentary Behavior Assessment
Participants wore an ActiGraph GT3X+ accelerometer (Pensacola, FL) for a minimum of 7 days around their waist fixed with an elastic belt during all waking hours, except during
water activities. The accelerometer data was used to estimate time spent in sedentary (<100
counts per minute (cpm) [18], light (100–759 cpm), moderate (760–5998 cpm), and vigorous
(5999 cpm) PA [19,20], steps per day [21] and metabolic equivalents (METS) [22]. Wear
time was set at a minimum of 8 hours per day on a minimum of 3 days, with non-wear time
defined as 60 minutes of continuous zeroes with a 2 minute interruption [23]. MVPA bouts of
activity were deduced into a minimum of 10 minutes with allowance for a 2 minute interrup-tion with a minimum of 760 cpm.
The 7-Day Physical Activity Recall [24] was interviewer administered to participants after
completion of accelerometer wear to estimate minutes per day and/or hours spent in moderate, hard and/or very hard PA, sleep, resistance training and flexibility training. Hours of sleep was calculated as the time between the participant reporting going to bed the previous day and waking up the next morning for the previous 7 days. Time spent in sleep (1 MET), light (1.5 METs), moderate (4 METs), hard (6 METs), and very hard (10 METs) activities for the past 7
days are multiplied by their respective MET values and then summed [25]. An estimate of total
kilocalories of energy expenditure per day was calculated. This instrument has been shown to
be reliable and valid in young women [26].
Women were also asked questions which estimated time spent watching TV/videos and
computer use with“Over the past 30 days, outside of work and school (as applicable), on
aver-age, how many hours per day did you 1) sit and watch television or videos and 2) use a com-puter (or iPad/iPhone/smart phone) to play games, surf the internet, view social media, or
message others.”[27] We also asked women to pick a category which best describes their
“usual daily activity”such as employment, housework, going to/attending classes/school.
Cate-gories were 1) sitting during the day without much walking; 2) standing or walking during the day, but do not have to carry or lift things very often; 3) lifting light loads or climbing stairs or
hills often; 4) heavy work or carrying heavy loads. [27] Finally, we asked about time spent
sit-ting or reclining at work, home or school during a typical weekday and typical weekend day. Weekdays and weekend day were deduced to sitting time (mins/week) by averaging with the
following equation: (weekday value5 and the weekend value2)/7 [28].
Dietary Assessment
The 2005 Block Food Frequency Questionnaire (FFQ) was used to estimate habitual dietary
intake [29]. Participants self-reported consumption of food intake over the past year from a
110 item questionnaire and data was reduced into estimates food groups and macro- and micronutrients at NutritionQuest (Berkeley, CA).
Statistical Methods
All analyses were tested with SAS, version 9.3 (Cary, NC) with a p-value of<0.05 considered
BMI, smoking status and accelerometer wear time (as applicable for accelerometer data). All dietary linear analyses adjusted for age, race, BMI and/or total calories.
The total sample size of eligible overweight/obese African American and Caucasian women was n = 55. Women were not included in the analyses if they had less than 3 days of 8 hours of wear or incomplete or missing accelerometer data (n = 6), or missing cardiometabolic data (n = 3), resulting in a final sample size of n = 46.
Results
Approximately 61% of the sample was African American, and 80% were classified as MHO.
Average age was (mean ± SD) 26.7 ±4.7 years with an average BMI of 31.1 ± 3.7 kg/m2. On
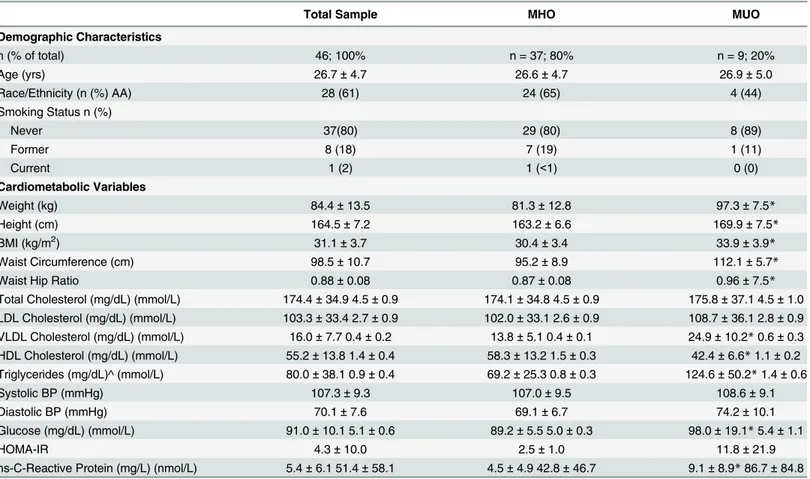
average, the accelerometer was worn 832.6 ± 103.5 minutes per day for 7.0 ± 2.0 days. There were no significant differences between the MHO and MUO groups for age, race distribution, smoking status, accelerometer wear time or valid days of accelerometer wear. Women who were classified as MUO had significantly higher weight, height, BMI, waist circumference, WHR, and VLDL, HDL, triglyceride, glucose and CRP concentrations compared with MHO. Women in MHO and MUO had similar levels of total cholesterol, low-density lipoprotein cho-lesterol, systolic and diastolic blood pressure, and HOMA-IR values. Demographic and
cardio-metabolic risk factors are presented inTable 1.
MHO women had significantly higher levels of light PA compared to MUO (difference between MHO and MUO; 38. ± 16.1 mins/day, p = 0.02) when measured using accelerometry. MHO also had greater average daily METs (per minute) compared with MUO (difference:
0.21 ± 0.09 METS, p = 0.03) (Table 2). Other accelerometer measures, including moderate PA,
vigorous PA, MVPA bouts, total activity counts, and steps per day, were similar between MHO and MUO women. Measures from the 7-day self-reported physical activity recall questionnaire did not show any significant differences between MUO and MHO for any intensity of activity,
strength training or flexibility training (Table 2).
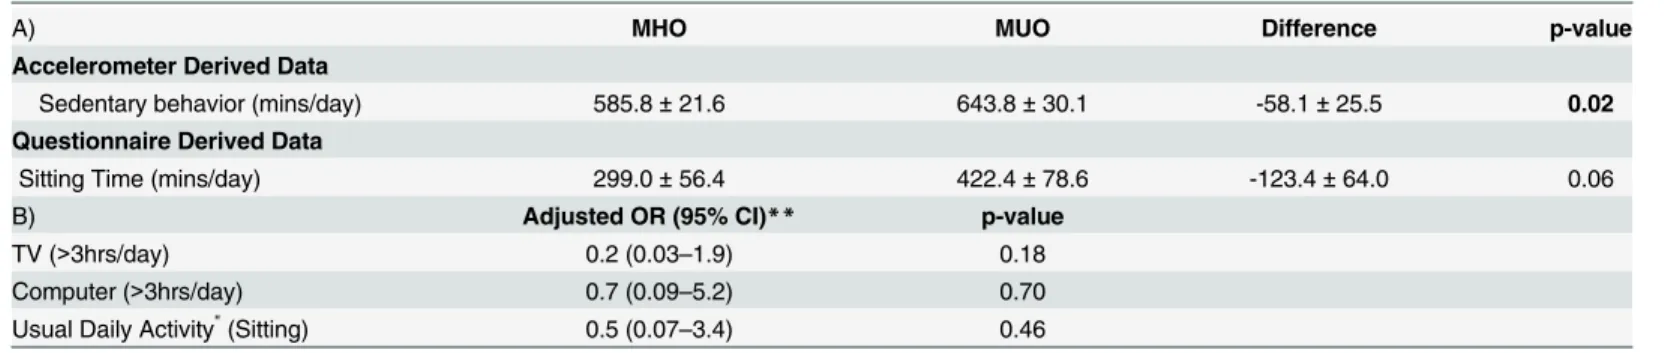
MHO women spent significantly less time in sedentary behaviors, measured via accelerome-try, than MUO (difference between MHO and MUO: -58.1 ± 25.5 mins/day p = 0.02)
(Table 3). Questionnaire data for sitting time, TV time, computer use, or usual daily activity
were similar for MHO and MUO (Table 3).
MHO women reported higher fiber intakes than MUO women (difference between MHO and MUO: 6.3 ± 2.8 g, p = 0.03), soluble fiber intake (difference: 1.8 ± 0.7 g, p = 0.02), and lower intakes of saturated fat (difference: -4.0 ± 1.9 g, p = 0.04), monounsaturated fat
(differ-ence: -4.0 ± 1.9 g, p = 0.04),transfat (difference: -0.8 ± 0.4 g, p = 0.03) (Table 4).
MHO women, compared to MUO women, reported consuming higher daily servings for vegetables (difference: 1.9 ± 0.8 servings, p = 0.03), fiber from vegetables (difference: 4.7 ± 2.1 g, p = 0.03), and fiber from beans (difference: 1.7 ± 0.8 g, p = 0.03), and lower daily servings of
dairy (difference: -0.7 ± 0.3 servings, p = 0.04) (Table 4). Further analysis of the dairy intake
showed that servings of milk was significantly lower in MHO women compared to MUO women (MHO: 0.4 ± 0.1 vs. MUO: 1.0 ± 0.2 cups; p = 0.02) with no significant difference for yogurt or cheese intake (data not shown).
Discussion
Key differences in physical activity and sedentary behavior were found using objective and rigorous assessment, and to our knowledge, this is the first objective assessment of sedentary behavior comparing MHO and MUO phentoypes. The accelerometry data show that time spent per day in sedentary behaviors was significantly lower in MHO women. MHO women in our study spent approximately 58 minutes less in sedentary behavior per day compared to MUO, and this caused displacement of both light PA (addition of approximately 38 minutes per day, p = 0.02) and MVPA (addition of approximately 20 minutes per day, p = 0.19). Light PA has been associated with lower glucose concentrations indicating effects of lower
intensity activity on cardiometabolic health [30], and research in young adults has shown that
simply replacing sitting with either standing or walking can improve insulin sensitivity [31].
Substituting 30 mins/day of sedentary time with equal amounts of light PA was associated with
improvements in overall physical health in older adults [32]. Even substituting 10 minutes of
sedentary time for MVPA has been reported to be positively associated with cardiometabolic
risk factors also in older adults [33]. The overall lower levels of sedentary behavior and higher
levels of light PA or MVPA could suggest a physiological mechanism to explain the healthier profile within obesity for MHO women.
Other PA variables derived from accelerometry, such as TAC and steps, although higher in MHO women, did not reach statistical significance in the current study. Interestingly, mean
Table 1. Demographic and cardiometabolic characteristics of final analytic sample (n = 46) (mean±SD).
Total Sample MHO MUO
Demographic Characteristics
n (% of total) 46; 100% n = 37; 80% n = 9; 20%
Age (yrs) 26.7±4.7 26.6±4.7 26.9±5.0
Race/Ethnicity (n (%) AA) 28 (61) 24 (65) 4 (44)
Smoking Status n (%)
Never 37(80) 29 (80) 8 (89)
Former 8 (18) 7 (19) 1 (11)
Current 1 (2) 1 (<1) 0 (0)
Cardiometabolic Variables
Weight (kg) 84.4±13.5 81.3±12.8 97.3±7.5*
Height (cm) 164.5±7.2 163.2±6.6 169.9±7.5*
BMI (kg/m2) 31.1±3.7 30.4±3.4 33.9±3.9
*
Waist Circumference (cm) 98.5±10.7 95.2±8.9 112.1±5.7*
Waist Hip Ratio 0.88±0.08 0.87±0.08 0.96±7.5*
Total Cholesterol (mg/dL) (mmol/L) 174.4±34.9 4.5±0.9 174.1±34.8 4.5±0.9 175.8±37.1 4.5±1.0 LDL Cholesterol (mg/dL) (mmol/L) 103.3±33.4 2.7±0.9 102.0±33.1 2.6±0.9 108.7±36.1 2.8±0.9
VLDL Cholesterol (mg/dL) (mmol/L) 16.0±7.7 0.4±0.2 13.8±5.1 0.4±0.1 24.9±10.2*0.6±0.3
HDL Cholesterol (mg/dL) (mmol/L) 55.2±13.8 1.4±0.4 58.3±13.2 1.5±0.3 42.4±6.6*1.1±0.2 Triglycerides (mg/dL)^ (mmol/L) 80.0±38.1 0.9±0.4 69.2±25.3 0.8±0.3 124.6±50.2*1.4±0.6
Systolic BP (mmHg) 107.3±9.3 107.0±9.5 108.6±9.1
Diastolic BP (mmHg) 70.1±7.6 69.1±6.7 74.2±10.1
Glucose (mg/dL) (mmol/L) 91.0±10.1 5.1±0.6 89.2±5.5 5.0±0.3 98.0±19.1*5.4±1.1
HOMA-IR 4.3±10.0 2.5±1.0 11.8±21.9
hs-C-Reactive Protein (mg/L) (nmol/L) 5.4±6.1 51.4±58.1 4.5±4.9 42.8±46.7 9.1±8.9*86.7±84.8
*p<0.05 for comparison of unadjusted means for MHO vs. MUO (t-tests for continuous variables; chi-square for categorical variables).
^ Non-normally distributed variables log transformed for t-test
Table 2. Adjusted means and standard error*for PA variables between MHO (n = 37) and MUO (n = 9).
MHO MUO Difference p-value
Accelerometer Derived Data
Light PA (mins/day) 143.1±13.7 104.8±19.0 38.2±16.1 0.02
Moderate PA (mins/day) 102.9±11.9 84.9±16.6 18.0±14.1 0.21
Vigorous PA (mins/day) 1.8±0.5 0.3±0.9 1.5±1.0 0.14
MVPA (mins/day) 103.8±12.2 84.3±17.0 19.50±14.5 0.19
MVPA Bouts (#/day) 0.9±0.4 1.3±0.6 -0.4±0.5 0.46
MVPA Bouts (mins/bout) 12.3±1.3 10.9±1.9 1.5±1.6 0.36
Total Activity Counts (counts/day) 254,640±35,942 203,547±50,005 51,093±42,449 0.24
METs^ (per minute) 1.84±0.08 1.63±0.11 0.21±0.09 0.03
Steps (steps/day) 12,320±1,337 10,144±1,860 2,176±1,579 0.18
Questionnaire Derived Data
Light+(hrs/week) 151.4±2.6 153.3±3.6 -1.9±3.0 0.53
Moderate+(hrs/week) 7.5±2.5 6.0±3.5 1.5±2.9 0.61
Hard+(hrs/week) 1.0±0.7 0.6±0.9 0.3±0.8 0.66
Very Hard+(hrs/week) 0.4±0.4 0.2±0.6 0.2±0.5 0.66
Energy Expenditure (kcals/kg/week) 275.0±7.9 267.9±11.0 7.1±9.0 0.44
Strength Training (mins/week) 23.4±14.7 14.7±20.7 8.7±16.9 0.61
Flexibility Training (mins/week) 44.5±7.0 38.8±9.8 5.7±8.0 0.48
Usual Occupational Activity
Sitting n (%) 6 (16) 3 (33) 0.40
Standing or walking without carrying heavy loads n (%) 25 (68) 4 (45) Lifting light loads, climbing stairs often n (%) 6 (16) 2 (22)
Heavy work or carrying heavy loads n (%) 0 (0) 0 (0)
Key: PA: physical activity, MVPA: Moderate and vigorous physical activity.
Boldtext indicates significantfindings p<0.05.
*adjusted for BMI, age, race, smoking and wear time (for accelerometer derived data) ^ METs via Crouter et al., 2010 equation [22]
+MET equivalents for 7 day Recall Questionnaire are light (1.5 METS), moderate (4 METS), hard (6 METS) and very hard (10 METS) [25]
doi:10.1371/journal.pone.0138548.t002
Table 3. Adjusted means*(A) and odds ratios (B) for sedentary behavior between MHO (n = 37) and MUO (n = 9).
A) MHO MUO Difference p-value
Accelerometer Derived Data
Sedentary behavior (mins/day) 585.8±21.6 643.8±30.1 -58.1±25.5 0.02
Questionnaire Derived Data
Sitting Time (mins/day) 299.0±56.4 422.4±78.6 -123.4±64.0 0.06
B) Adjusted OR (95% CI)** p-value
TV (>3hrs/day) 0.2 (0.03–1.9) 0.18
Computer (>3hrs/day) 0.7 (0.09–5.2) 0.70
Usual Daily Activity"(Sitting) 0.5 (0.07–3.4) 0.46
*adjusted for BMI, age, race, smoking and wear time (accelerometer-derived data)
" Categories of usual daily activity were divided into 1) sitting vs. 2) standing, walking, and lifting loads
**MHO compared to MUO
Boldtext indicates significantfindings p<0.05.
TAC values for MHO and MUO represent different U.S. population percentiles: MHO total
activity count means represent the 50thpercentile, while MUO total activity count means
rep-resent the 25thpercentile [34]. In addition, MHO women had approximately 20 more minutes
of MVPA per day, and over 2000 more steps per day, compared to MUO women. These differ-ences may be clinically meaningful despite their lack of statistical significance. Post-hoc power calculations show that a minimum sample size of 124 was needed to show significant differ-ences in mean values between MHO and MUO for TAC, MVPA and steps.
It is important to note that the step counts are measured by an Actigraph accelerometer in the current study. Actigraphs are known to produce higher step counts compared to
pedome-ters that use a spring lever or pizo-electric mechanism during free-living conditions [35], due
to differences in measurement and sensitivity of detecting steps. The mean steps in both MUO and MHO groups exceeded 10,000 per day; however step thresholds for health are based on spring lever pedometers, thus the current results cannot be compared to those step guidelines.
Table 4. Adjusted means*for macronutrient, micronutrient and summary diet variables between MHO (n = 37) and MUO (n = 9).
MHO MUO p-value*
Selected Macro/Micronutrients Mean SE Mean SE
Total kcals 1,850 204 1,900 414 0.92
Carbohydrates (% kcal) 49.1 1.3 47.8 2.6 0.66
Sugar (g) 109.4 7.4 112.5 15.1 0.86
Fiber (g) 21.3 1.2 14.9 2.4 0.03
Soluble Fiber (g) 6.6 0.3 4.8 0.6 0.02
Fat (% kcal) 35.6 0.9 37.5 1.9 0.39
Polyunsaturated Fat (g) 17.9 0.7 16.2 1.3 0.25
Monounsaturated Fat (g) 29.7 0.8 33.8 1.6 0.04
TransFat (g) 2.4 0.2 3.3 0.3 0.03
Saturated Fat (g) 23.3 0.8 27.3 1.6 0.04
Cholesterol (mg) 229.8 14.6 283.4 29.6 0.12
Protein (% kcal) 15.2 0.6 15.5 1.2 0.83
Sodium (mg) 3,198 85 3,002 173 0.33
Calcium (mg) 801 43 979 87 0.09
Summary Dietary Variables
Total Fruit (daily servings of fruits and juices) 1.7 0.2 1.2 0.4 0.18
Total Vegetables (daily servings) 3.9 0.4 2.0 0.7 0.03
Total Grains (daily servings) 4.8 0.3 5.0 0.6 0.81
Whole Grains (daily servings) 0.7 0.1 0.6 0.2 0.62
Dairy (milk, yogurt and cheese) (daily servings) 1.0 0.1 1.7 0.3 0.04
Meat, Fish, Poultry, Beans, Eggs (daily servings) 2.4 0.1 2.3 0.3 0.88
Fats, oils, sweets and soda (daily servings) 3.2 0.3 3.9 0.5 0.26
Alcohol (% total kcal) 3.9 0.7 1.6 1.4 0.17
Fiber—Beans (g) 2.9 0.3 1.2 0.6 0.03
Fiber—Fruits and vegetables (g) 10.0 0.9 5.2 1.8 0.03
Fiber—Grains (g) 8.0 0.7 7.9 1.5 0.97
Sugar Sweetened Beverages (g) 262.4 68.1 342.7 138.2 0.62
Sweets & Desserts (%kcal) 12.8 1.3 17.0 2.6 0.17
*adjusted for BMI, age, race and kcals
Boldtext indicates significantfindings p<0.05.
Despite the differences in measurement between pedometers and the Actigraph accelerometer, the focus here is on the differences between MHO and MUO regardless of the device used.
Previous studies have utilized television viewing time as a proxy measure to compare
seden-tary behavior among MHO and MUO individuals and have found no significant differences [7,
13]. Although we expanded the measure of screen time to include both TV viewing and
com-puter time, our null findings are consistent with previous reports. Interestingly, MHO women self-reported approximately 2 hours less total sitting time compared to MUO women and this difference approached significance (p = 0.06).
Higher vegetable intake has been shown to have beneficial effects on cardiovascular disease
mortality [36]. MHO women reported higher vegetable and overall fiber consumption (fiber,
soluble fiber, fiber from beans, and fiber from fruits and vegetables) than MUO women. Previ-ous research has not found any differences in vegetables or total fiber intake between MHO
and MUO [7,10], but previous studies were not done in young African American and
Cauca-sian women living in the U.S., which may explain differences in findings. We have previously reported higher whole grains, whole fruit, and meat/bean consumption in MHO young women, which typically contains higher fiber foods, however, fiber amounts were not directly
investigated in the previous study [14]. Higher fiber intake has been associated with positive
cardiometabolic risk factors and lower risk of obesity, cardiovascular disease and diabetes [37].
Total dairy intake was lower in our sample of MHO than MUO women. This finding is in
contrast to those who reported no differences in dairy intake in other adult cohorts [7,10,14].
The difference in dairy intake in the current study was limited to fluid milk, and did not include cheese or yogurt. Possible explanations could be due to our 60% African American sample which are known to have lower intake of milk products due to perceived or actual lactose
sensi-tivity [38]. We also found lower intakes of saturated fat,transfat and monounsaturated fat
lev-els in MHO. The finding for saturated fat is different than that reported in another cohort of
young women [14] and middle-older aged adults [7]. The higher intakes of both vegetables and
lower intake of dairy intake in the MHO women likely accounted for the lower saturated fat intakes.
There are several notable strengths and limitations to the current study. Dietary data assess-ment, despite quality data collection methodology and analysis, is subject to recall bias. Our sample was drawn from the Boston metropolitan and suburban communities, possibly limiting generalizability to other cities and communities. The current study is a cross-sectional design and cause and effect of the key lifestyle behaviors on cardiometabolic risk within obesity are not able to be determined. Due to our small relatively sample size (n = 54), our findings should be interpreted as preliminary; future studies are needed to replicate our findings with larger samples that include men and women of diverse race/ethnic groups. Despite these limitations, our rigorous objective monitoring for both PA and sedentary behavior using accelerometry allowed assessment of various intensities of PA and overall PA levels which has not previously been investigated in MHO research. We were able to include young African American and Caucasian women. African American young women, in particular, are more likely to be MHO
[6], but are also more susceptible to developing hypertension, CVD and diabetes [39,40],
mak-ing this group a high priority for better understandmak-ing lifestyle behaviors associated with the MHO profile.
Our research shows differences in key lifestyle behaviors between young women who were classified as MHO versus MUO. National estimates suggest that adults spend
approxi-mately 55% of their waking hours in sedentary behavior [18]. Reducing or displacing time in
(ie., transitioning from the MUO to the MHO phenotype) including: 1) substituting light PA for sedentary behavior and 2) dietary intake with higher vegetables, fiber and decreasing satu-rated fat. Current guidelines for obesity treatment emphasize weight loss utilizing multiple
life-style behaviors and strategies [41]; however, weight loss is difficult to achieve and maintain
[42]. If future studies are able to show that changes in key lifestyle behaviors such as sedentary
behavior, PA and diet can be made to improve health within obesity, without weight loss, this could ultimately lead to the need for updating and stratifying obesity treatment guidelines to address different health risks within obesity.
Supporting Information
S1 Data. Project Health Minimal Data Set.
(XLSX)
Acknowledgments
We would like to thank and acknowledge all of the additional contributions for Project Health data collection from the following individuals: Tania Godbout, Keiani Gomes, John Hathaway, Kaleigh Jones, Ryan Kohl, Hali Kovich, Lauren Lob, Amanda Niemann, Vivian Onyechi, Jes-sica Sullivan, and Justin Wheeler.
Author Contributions
Conceived and designed the experiments: SMC LH SEC AM AL. Performed the experiments: SMC SEC AL. Analyzed the data: SMC. Contributed reagents/materials/analysis tools: AL. Wrote the paper: SMC SEC LH AM AL.
References
1. Karelis AD, St-Pierre DH, Conus F, Rabasa-Lhoret R, Poehlman ET. Metabolic and body composition factors in subgroups of obesity: what do we know? J Clin Endocrinol Metab. 2004; 89(6):2569–75. PMID:15181025
2. Brochu M, Tchernof A, Dionne IJ, Sites CK, Eltabbakh GH, Sims EA, et al. What are the physical char-acteristics associated with a normal metabolic profile despite a high level of obesity in postmenopausal women? J Clin Endocrinol Metab. 2001; 86(3):1020–5. PMID:11238480
3. Ogorodnikova AD, Kim M, McGinn AP, Muntner P, Khan U, Wildman RP. Incident cardiovascular dis-ease events in metabolically benign obese individuals. Obesity (Silver Spring). 2012; 20(3):651–9.
4. van der ADL, Nooyens AC, van Duijnhoven FJ, Verschuren MM, Boer JM. All-cause mortality risk of metabolically healthy abdominal obese individuals: the EPIC-MORGEN study. Obesity (Silver Spring). 2014; 22(2):557–64.
5. Velho S, Paccaud F, Waeber G, Vollenweider P, Marques-Vidal P. Metabolically healthy obesity: differ-ent prevalences using differdiffer-ent criteria. Eur J Clin Nutr. 2010; 64(10):1043–51. doi:10.1038/ejcn.2010. 114PMID:20628408
6. Wildman RP, Muntner P, Reynolds K, McGinn AP, Rajpathak S, Wylie-Rosett J, et al. The obese with-out cardiometabolic risk factor clustering and the normal weight with cardiometabolic risk factor cluster-ing: prevalence and correlates of 2 phenotypes among the US population (NHANES 1999–2004). Arch Intern Med. 2008; 168(15):1617–24. doi:10.1001/archinte.168.15.1617PMID:18695075
7. Hankinson AL, Daviglus ML, Van Horn L, Chan Q, Brown I, Holmes E, et al. Diet composition and activ-ity level of at risk and metabolically healthy obese American adults. Obesactiv-ity (Silver Spring). 2013; 21 (3):637–43.
8. Lee K. Metabolically obese but normal weight (MONW) and metabolically healthy but obese (MHO) phenotypes in Koreans: characteristics and health behaviors. Asia Pac J Clin Nutr. 2009; 18(2):280–4. PMID:19713189
10. Phillips CM, Dillon C, Harrington JM, McCarthy VJ, Kearney PM, Fitzgerald AP, et al. Defining metaboli-cally healthy obesity: role of dietary and lifestyle factors. PLoS One. 2013; 8(10):e76188. doi:10.1371/ journal.pone.0076188PMID:24146838
11. Artero EG, Lee DC, Lavie CJ, Espana-Romero V, Sui X, Church TS, et al. Effects of muscular strength on cardiovascular risk factors and prognosis. J Cardiopulm Rehabil Prev. 2012; 32(6):351–8. doi:10. 1097/HCR.0b013e3182642688PMID:22885613
12. Sarvottam K, Magan D, Yadav RK, Mehta N, Mahapatra SC. Adiponectin, interleukin-6, and cardiovas-cular disease risk factors are modified by a short-term yoga-based lifestyle intervention in overweight and obese men. J Altern Complement Med. 2013; 19(5):397–402. doi:10.1089/acm.2012.0086PMID: 23210469
13. Bell JA, Kivimaki M, Batty GD, Hamer M. Metabolically healthy obesity: what is the role of sedentary behaviour? Prev Med. 2014; 62:35–7. doi:10.1016/j.ypmed.2014.01.028PMID:24513171
14. Camhi SM, Whitney Evans E, Hayman LL, Lichtenstein AH, Must A. Healthy eating index and metaboli-cally healthy obesity in U.S. adolescents and adults. Prev Med. 2015; 77:23–7. doi:10.1016/j.ypmed. 2015.04.023PMID:25937589
15. Li S, Chen W, Srinivasan SR, Xu J, Berenson GS. Relation of childhood obesity/cardiometabolic phe-notypes to adult cardiometabolic profile: the Bogalusa Heart Study. Am J Epidemiol. 2012; 176 Suppl 7:S142–9. doi:10.1093/aje/kws236PMID:23035138
16. Cornier MA, Despres JP, Davis N, Grossniklaus DA, Klein S, Lamarche B, et al. Assessing adiposity: a scientific statement from the american heart association. Circulation. 2011; 124(18):1996–2019. doi: 10.1161/CIR.0b013e318233bc6aPMID:21947291
17. Matthews DR, Hosker JP, Rudenski AS, Naylor BA, Treacher DF, Turner RC. Homeostasis model assessment: insulin resistance and beta-cell function from fasting plasma glucose and insulin concen-trations in man. Diabetologia. 1985; 28(7):412–9. PMID:3899825
18. Matthews CE, Chen KY, Freedson PS, Buchowski MS, Beech BM, Pate RR, et al. Amount of time spent in sedentary behaviors in the United States, 2003–2004. Am J Epidemiol. 2008; 167(7):875–81. doi:10.1093/aje/kwm390PMID:18303006
19. Matthews CE. Calibration of Accelerometer Output for Adults. Med Sci Sports Exerc. 2005; 37(11): s512–s22. PMID:16294114
20. Crouter SE, DellaValle DM, Haas JD, Frongillo EA, Bassett DR. Validity of ActiGraph 2-regression model, Matthews cut-points, and NHANES cut-points for assessing free-living physical activity. J Phys Act Health. 2013; 10(4):504–14. PMID:22975460
21. Tudor-Locke C, Johnson WD, Katzmarzyk PT. Accelerometer-determined steps per day in US adults. Med Sci Sports Exerc. 2009; 41(7):1384–91. doi:10.1249/MSS.0b013e318199885cPMID:19516163
22. Crouter SE, Kuffel E, Haas JD, Frongillo EA, Bassett DR Jr. Refined two-regression model for the Acti-Graph accelerometer. Med Sci Sports Exerc. 2010; 42(5):1029–37. doi:10.1249/MSS.
0b013e3181c37458PMID:20400882
23. Troiano RP, Berrigan D, Dodd KW, Masse LC, Tilert T, McDowell M. Physical activity in the United States measured by accelerometer. Med Sci Sports Exerc. 2008; 40(1):181–8. PMID:18091006
24. Blair SN, Haskell WL, Ho P, Paffenbarger RS Jr., Vranizan KM, Farquhar JW, et al. Assessment of habitual physical activity by a seven-day recall in a community survey and controlled experiments. AmJEpidemiol. 1985; 122(5):794–804.
25. Sallis JF, Haskell WL, Fortmann SP, Vranizan KM, Taylor CB, Solomon DS. Predictors of adoption and maintenance of physical activity in a community sample. Prev Med. 1986; 15(4):331–41. PMID: 3763558
26. Washburn RA, Jacobsen DJ, Sonko BJ, Hill JO, Donnelly JE. The validity of the Stanford Seven-Day Physical Activity Recall in young adults. Med Sci Sports Exerc. 2003; 35(8):1374–80. PMID:12900693
27. NHANES Questionnaires,Datasets, and Related Documentation Hyattsville, MD: National Center for Health Statistics; 2012 [cited 2015 January 12]. Available:http://www.cdc.gov/nchs/nhanes/nhanes_ questionnaires.htm.
28. Craig CL, Marshall AL, Sjostrom M, Bauman AE, Booth ML, Ainsworth BE, et al. International physical activity questionnaire: 12-country reliability and validity. Med Sci Sports Exerc. 2003; 35(8):1381–95. PMID:12900694
29. Block G, Woods M, Potosky A, Clifford C. Validation of a self-administered diet history questionnaire using multiple diet records. Journal of clinical epidemiology. 1990; 43(12):1327–35. PMID:2254769
31. Duvivier BM, Schaper NC, Bremers MA, van Crombrugge G, Menheere PP, Kars M, et al. Minimal intensity physical activity (standing and walking) of longer duration improves insulin action and plasma lipids more than shorter periods of moderate to vigorous exercise (cycling) in sedentary subjects when energy expenditure is comparable. PLoS One. 2013; 8(2):e55542. doi:10.1371/journal.pone.0055542 PMID:23418444
32. Buman MP, Hekler EB, Haskell WL, Pruitt L, Conway TL, Cain KL, et al. Objective light-intensity physi-cal activity associations with rated health in older adults. Am J Epidemiol. 2010; 172(10):1155–65. doi: 10.1093/aje/kwq249PMID:20843864
33. Hamer M, Stamatakis E, Steptoe A. Effects of substituting sedentary time with physical activity on meta-bolic risk. Med Sci Sports Exerc. 2014; 46(10):1946–50. doi:10.1249/MSS.0000000000000317PMID: 24674977
34. Wolff DL, Fitzhugh EC, Bassett DR, Churilla JR. Waist-Worn Actigraphy: Population-Referenced Per-centiles for Total Activity Counts in U.S. Adults. J Phys Act Health. 2014;Jun 4. [Epub ahead of print].
35. Tudor-Locke C, Ainsworth BE, Thompson RW, Matthews CE. Comparison of pedometer and acceler-ometer measures of free-living physical activity. Med Sci Sports Exerc. 2002; 34(12):2045–51. PMID: 12471314
36. Leenders M, Boshuizen HC, Ferrari P, Siersema PD, Overvad K, Tjonneland A, et al. Fruit and vegeta-ble intake and cause-specific mortality in the EPIC study. Eur J Epidemiol. 2014; 29(9):639–52. doi:10. 1007/s10654-014-9945-9PMID:25154553
37. Anderson JW, Baird P, Davis RH Jr., Ferreri S, Knudtson M, Koraym A, et al. Health benefits of dietary fiber. Nutr Rev. 2009; 67(4):188–205. doi:10.1111/j.1753-4887.2009.00189.xPMID:19335713
38. Bailey RK, Fileti CP, Keith J, Tropez-Sims S, Price W, Allison-Ottey SD. Lactose intolerance and health disparities among African Americans and Hispanic Americans: an updated consensus statement. J Natl Med Assoc. 2013; 105(2):112–27. PMID:24079212
39. Kumanyika SK. Special issues regarding obesity in minority populations. Ann Intern Med. 1993; 119(7 Pt 2):650–4. PMID:8363191
40. Kumanyika SK. Obesity in minority populations: an epidemiologic assessment. Obes Res. 1994; 2 (2):166–82. PMID:16353618
41. Executive summary of the clinical guidelines on the identification, evaluation, and treatment of over-weight and obesity in adults. ArchInternMed. 1998; 158(17):1855–67.