Prediction of Reagents Needs Using Radial
Basis Function in Teaching Hospital
Indrabayu #1, Baizul Zaman#2,Amil A. Ilham3, Intan Sari Areni #4
1,3
Informatics Study Program, Electrical Engineering Department 2
Graduate Student of Electrical Engineering Department 4
Electrical Study Program, Electrical Engineering Department
#
Research Group of Artificial Intelligence and Multimedia Processing Universitas Hasanuddin, Makassar, Indonesia
1
[email protected], [email protected], [email protected], [email protected]
Abstract—A robust reagents prediction is able to support the service improvement in laboratories. In
this paper, Radial Basis Function Networks (RBFN) method with (3, Q, 1) architecture is used to predict two types of reagents needs, i.e. SD Bioline HBsAg and SD Bioline Anti HCV. Data of reagents from 2012 - 2013 are used as training data, whereas 2014 data are used as comparative data for the prediction result. In RBFN training, the best condition obtained when the spread value is 4 with RMSE 1.63E-06 for both types of reagents. The prediction results with RBFN methods reached 99% with correlation value of 0.99 for each reagents. RBFN method shows better prediction result compared to BPNN method with prediction of 92%.
Keyword-Reagents prediction, Radial basis function network, Teaching hospital, BPNN, RMSE
I. INTRODUCTION
A laboratory installation is one operational support unit in hospital with the duty and responsibility in patient's illness examination as well as one of the service unit that can be developed into a costs center and revenues for the hospital. The problems are often occurred in a laboratory installation is a use of budget for the reagents purchasing. It is happen due to the lack of knowledge of the laboratory personnel to analyzing budget needs so the number of reservations is mismatched with the actual reagents needed at the laboratory. By using empirical data at the hospital, these prediction errors can actually be overcome by using appropriate artificial intelligence methods with the data condition to be predicted.
In several existing research, wide variety of theories and methods for the needs logistics prediction in hospital or the prediction of reagents needs have been carried out. Cao et. al. studied the hospital logistics stock demands forecasting based on data mining and back propagation neural network. The result accuracy of this research is 87% [1]. In addition, Wen et al. examined the model of hospital engineering logistics management with JIT theory aimed at ensuring the logistics operations can run normally and reduce excessive operational costs [2]. While research on the prediction of reagents needs have been described as Decision Support System mas main tools [3-5]. Anon et al. doing research on decision-making model development for reagents forecasting with Analysis Hierarchy Process (AHP) method, Goal Programming (GP), Time Series Analysis (TSA) and Expert Systems (ES). The results of this study showed that the ES method provide better results than other methods with an average MSE of 3.75 [3]. Furthermore, Tzu et al. examines the decision-making management for reagents purchase with exponential smoothing method. This study obtained different results for each type of reagents with each correlation values for reagents plateau type is 0.3-0.5 and the increment type and decrement reagents type correlation value is 0.5-0.7 [4].
x1
x2
x3
w11
w12
w13
w21
w22
w23
w31
w32
w33
1 w0
Σ Output II. LITERATUREREVIEW
A. Radial Basis Function Network
Radial Basis Function Network (RBFN) is an artificial neural network model which transform input
non-linearly using radial basis activation function similar to the Gaussian activation function in hidden layer unit before linearly processed on the output layer. RBFN consists of three layers, i.e. input layer, hidden layer and output layer. Each hidden layer represents activation function in the form of radial basis function. Each input of its network will enable all the activation function on hidden layer. Each unit on hidden layer is called basis functions. Hidden layer consists of a number of similar basis functions that will generate an output with certain weight. The output of this network is the sum of all basis functions output multiplied by its weight [6].
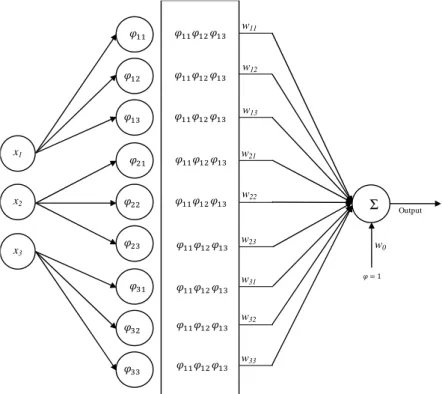
B. Proposed RBFN Architecture
In this paper, RBFN architecture have three input layer, hidden layer contain neurons as much as the data input and one output layer that uses only one neuron (3, Q, 1) that is shown in Fig. 1. Each input activates each function base on its own network. For example, input x1 will activate basis function on the first RBFN network,
subsequently basis functions φ11, φ12 and φ13 be activated. Furthermore, cross-correlation between each basis functions on each network is calculated and the results are weighted wij. RBFN network output is calculated by
the following equation [6].
= =
+
=
0 3i 1 3j 1 ijij
w
w
Output
ϕ
(1)Where w0 is bias weight, φij is theactivation basis function which is defined by Gaussian function as follows.
e
ij ij c xij
− −
=
2
2
σ
ϕ
(2)with cj is the jth gaussian functions center,σj is the jth gaussian function width and x is the basis function input.
III. METHODOLOGY
A. Preprocessing
Data reagents in this paper are collected from the laboratory unit of the teaching hospital for 3 years, from 2012 to 2014. These data consists of three variables, i.e. reagents consumption, reagents demand and residual reagents. The data from 2012 to 2013 is used as training data while the data in 2014 is used validation data. At the initial stage, the data is normalized before the training process by using the following equation.
b
a
b
x
x
'
=
(
−
)
/
−
(3)where x' is the normalized data, x is the input data, a represent the largest data value and b is the smallest data value.
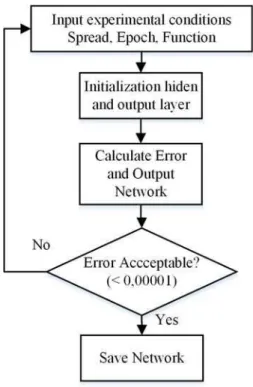
B. Training Process
Training process consists of five steps, i.e entering the input variables, normalizing the data, initializing network, setting the spread value and calculating the error value. Spread value setting is performed to optimize network activation function. The training process will stop if the error value < 0.00001. The network training process of RBFN is shown in Fig. 2.
Fig 2. The network training of RBFN
C. Postprocessing
At this stage, the training output will be denormalized with the following equation.
b
b
a
y
p
'
=
(
−
)
+
(4)where p' is the denormalized data, y is the output of the training, b is the smallest data and a is the largest data.
D. Process Validation and Prediction
Validation process are carried out in several stages, such as inserting test data of year 2014 that consists of three variable parameters (residual reagents data, reagents consumption data, reagents demand data), data normalization process to obtain data interval from 0 to 1, input the best network (net) from RBFN training result, conducting process of reagents needs prediction for 2014, perform data denormalization to restore the data to the actual value and calculate correlation between the prediction results and the actual laboratory reagents.
IV. RESULTSANDDISCUSSION
A. Result Training Network
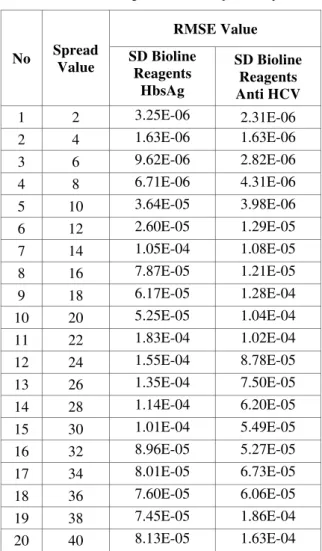
In this paper, the best training results are based on the smallest RMSE values that influenced by the spread value. The network training results are shown in Table I.
TABLE I. Network Training of RBFN with adjustment spread value
No Spread Value
RMSE Value
SD Bioline Reagents
HbsAg
SD Bioline Reagents Anti HCV
1 2 3.25E-06 2.31E-06
2 4 1.63E-06 1.63E-06 3 6 9.62E-06 2.82E-06 4 8 6.71E-06 4.31E-06 5 10 3.64E-05 3.98E-06 6 12 2.60E-05 1.29E-05 7 14 1.05E-04 1.08E-05 8 16 7.87E-05 1.21E-05 9 18 6.17E-05 1.28E-04 10 20 5.25E-05 1.04E-04 11 22 1.83E-04 1.02E-04 12 24 1.55E-04 8.78E-05 13 26 1.35E-04 7.50E-05 14 28 1.14E-04 6.20E-05 15 30 1.01E-04 5.49E-05 16 32 8.96E-05 5.27E-05 17 34 8.01E-05 6.73E-05 18 36 7.60E-05 6.06E-05 19 38 7.45E-05 1.86E-04 20 40 8.13E-05 1.63E-04
The best RBFN network training results achieved when the spread value is 4 with RMSE value of 1.63E-06 for both reagents. The RMSE value on training calculated by the following equation [7].
min max
2
1 ( ' )
y y
y y RMSE
N
h
t t t
N
− −
=
− (5)where yt is the actual data, N is the data amount, yt’ is the prediction data, ymax is the maximum value of the
actual data and ymin is minimum value of the actual data.
B. Prediction Results Comparison Between RBFN and BPNN Methods
TABLE II. Comparison of Results Prediction Method RBFN with BPNN
Mt
SD Bioline HBsAg SD Bioline Anti HCV
Actual RBFN BPNN Actual RBF
N BPNN
1 260 260 267 180 180 157
2 670 670 561 100 100 61
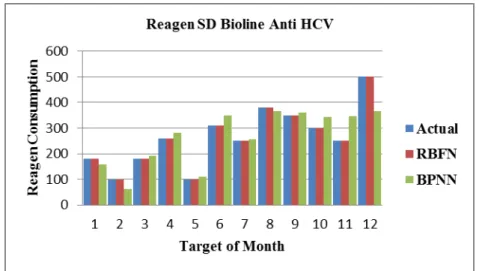
3 200 200 182 180 180 193 4 260 260 239 260 260 282 5 200 200 190 100 100 111 6 300 300 273 310 310 348 7 350 350 352 250 250 256 8 430 430 496 380 380 365 9 450 450 369 350 350 361 10 150 150 151 300 300 343 11 300 300 276 250 250 347 12 600 600 550 500 500 367
Crl 0.99 0.96 0.99 0.88
Act=Actual, Mt=Target of Month, Crl=Correlation
In Table II, both reagents show the same correlations values of 0.99 for RBFN prediction method. Based on the correlation values in Table 2, it can be said that the results of prediction methods RBFN better than BPNN method. To calculate the correlation value prediction results above used the following equation [8]:
−
−
−
=
}
)
(
}{
)
(
{
)
)(
(
2 2
2 2
y
y
n
x
x
n
y
x
xy
n
r
(6)Where n is the number of data couple x and y,Σx is the total amount of x,Σy is the total amount of y,Σx2 is the square from the total number of x, Σy2 is the square of the total number of y and Σxy is the result of the total number of variables x and y variables multiplication.
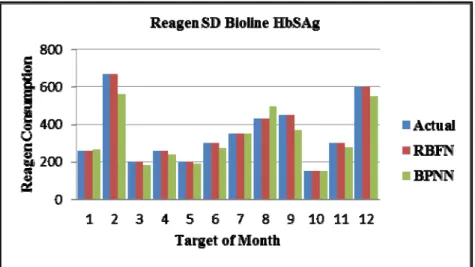
As for predictions result comparison graph between RBFN with BPNN method is shown in Fig. 3 and Fig. 4. The results show that the RBFN prediction is more accurate than that of BPNN.
Fig 4. Comparison of Results Prediction Methods RBFN and BPNN For SD Bioline Anti HCV Reagents
Fig. 3 and Fig. 4 shows the results predicted by the RBFN method is quite accurate and shadowing the reagents consumption pattern appropriate with the actual data. The red graph shows the RBFN method prediction, green is BPNN methods prediction and blue is the actual reagents usage data.
V. CONCLUSION
Prediction of reagents SD Bioline HBsAg and SD Bioline Anti-HCV using Radial Basis Function Network (RBFN) method has been studied in this paper. With RBF Architecture method (3, Q, 1) and spread value of 4, the prediction results profound the the correlation of 0.99 and 99% accuracy rate for both types of reagents. Based on the results prediction accuracy, RBFN method shows better results than BPNN method with the prediction results of 92%.
REFERENCES
[1] Cao Qingkui, Ruan Junhu,” Study on demand Forecasting of Hospitasl Stock Based on Data Mining and BP Neural Network,” International Conference on Electronic Commerce and Business Intelligence, 2009, p. 284-289.
[2] Wen yan, Liu zixian, Liu Junlan,”Reengineering Mode of Hospital Logistics Materials Based on JIT Theory,” International Conference on Intelligent Systems and Logistics Management, 2010, p. 1039-1042.
[3] Anon Sudsai, Kittipong Sophonthummapharn, Thaveesak Ganjanasuwan, “A Development Model of Decision Support System for Purchasing of Laboratory Reagent,” International Journal of e-Education, e-Business, e-Management and e-Learning., Vol. 1, No. 1, April 2011.
[4] Tzu-Chuen Lu, Lai Shih-Chieh, Tseng Chun-Ya,” Reagents and Consumables Demand Management and Decision Support System,” International Symposium on Computer, Consumer and Control, 2014, p. 1167-1170.
[5] Baizul Zaman, Indrabayu, Amil A.Ilham, “Safety stock reagent prediction using neural networks,” National Conference on Computer Science Research, Indonesian Muslim University, 2015, p. 110-113.
[6] Wei Shen, Xiaopen Guo, Chao Wu, Desheng Wu. Forecasting Stock Indices using Radial Basis Function Neural Networks Optimized by Artificial Fish Swarm Algorithm. Knowledege Based System. 2011; 24(3): 378-385.
[7] Indrabayu, N. Harun, M.S. Pallu, and A. Achmad, “Statistic Approach versus Prediction Based on Data Series,” International Journal of Engineering and Technology.,Vol, No 2, April-May 2013.
[8] Indrabayu, I.S. Areni, Novyra M., “A Fuzzy Logic Approach for Timely Adaptive Traffic Light Based on Traffic Load”, Makassar International Conference on Electrical Engineering and Informatics, MICEEI 2014
AUTHORPROFILE
Dr. Indrabayu, ST, M.Bus.Sys – was born in July 1975 in Makassar, Indonesia. He was awarded Summa Cum Laude from the Doctoral degree in Artificial Engineering in Civil Application from Hasanuddin University, Makassar, Indonesia, in 2013. Also received M.E degree in multimedia and communication from Institut Teknologi 10 November, Surabaya, Indonesia in 2005 and received the B.E degree in Communication Engineering from Hasanuddin University, Makassar, Indonesia in 20012. His research interest includes artificial intelligence and multimedia processing
Amil Ahmad Ilham, ST,MIT Ph.D – Electrical Engineering Department, Hasanuddin University (UNHAS), Indonesia (1997). M.IT. (Masters of Information Technology)Electrical Engineering and Computer Science Department, The University of Newcastle, Australia (2003). Ph.D. (Doctor of Philosophy), Informatics Department, Kyushu University, Japan (2011). Since 2011 he has been Head of Informatics Engineering Study Program, Hasanuddin University.