Whole-Transcriptome Analysis of
Differentially Expressed Genes in the
Vegetative Buds, Floral Buds and Buds of
Chrysanthemum morifolium
Hua Liu, Ming Sun, Dongliang Du, Huitang Pan, Tangren Cheng, Jia Wang, Qixiang Zhang*
Beijing Key Laboratory of Ornamental Germplasm Innovation and Molecular Breeding, National Engineering Research Center for Floriculture, Beijing Laboratory of Urban and rural ecological environment, College of Landscape Architecture, Beijing Forestry University, Beijing, 100083, China
Abstract
Background
Chrysanthemum morifoliumis an important floral crop that is cultivated worldwide. Howev-er, due to a lack of genomic resources, very little information is available concerning the mo-lecular mechanisms of flower development in chrysanthemum.
Results
The transcriptomes of chrysanthemum vegetative buds, floral buds and buds were se-quenced using Illumina paired-end sequencing technology. A total of 15.4 Gb of reads were assembled into 91,367 unigenes with an average length of 739 bp. A total of 43,137 uni-genes showed similarity to known proteins in the Swissprot or NCBI non-redundant protein databases. Additionally, 25,424, 24,321 and 13,704 unigenes were assigned to 56 gene on-tology (GO) categories, 25 EuKaryotic Orthologous Groups (KOG) categories, and 285 Kyoto Encyclopedia of Genes and Genomes (KEGG) pathways, respectively. A total of 1,876 differentially expressed genes (DEGs) (1,516 up-regulated, 360 down-regulated) were identified between vegetative buds and floral buds, and 3,300 DEGs (1,277 up-regu-lated, 1,706 down-regulated) were identified between floral buds and buds. Many genes en-coding important transcription factors (e.g., AP2, MYB, MYC, WRKY, NAC and CRT) as well as proteins involved in carbohydrate metabolism, protein kinase activity, plant hormone signal transduction, and the defense responses, among others, were considerably up-regu-lated in floral buds. Genes involved in the photoperiod pathway and flower organ determina-tion were also identified. These genes represent important candidate genes for molecular cloning and functional analysis to study flowering regulation in chrysanthemum.
Conclusion
This comparative transcriptome analysis revealed significant differences in gene expression and signaling pathway components between the vegetative buds, floral buds and buds of OPEN ACCESS
Citation:Liu H, Sun M, Du D, Pan H, Cheng T, Wang J, et al. (2015) Whole-Transcriptome Analysis of Differentially Expressed Genes in the Vegetative Buds, Floral Buds and Buds ofChrysanthemum morifolium. PLoS ONE 10(5): e0128009. doi:10.1371/ journal.pone.0128009
Academic Editor:Serena Aceto, University of Naples Federico II, ITALY
Received:January 6, 2015
Accepted:April 21, 2015
Published:May 26, 2015
Copyright:© 2015 Liu et al. This is an open access article distributed under the terms of theCreative Commons Attribution License, which permits unrestricted use, distribution, and reproduction in any medium, provided the original author and source are credited.
Data Availability Statement:Data are available from the SRA data bases of National Center of
Biotechnology Information (SRR1873730).
Funding:This research was supported by the 12th Five Years Key Programs for Science and Technology Development of China
(2012BAD01B07,2013BAD01B07), Special Fund for Beijing Common Construction Project.
Chrysanthemum morifolium. A wide range of genes was implicated in regulating the phase transition from vegetative to reproductive growth. These results should aid researchers in the study of flower-time regulation, breeding and molecular biology in chrysanthemum.
Introduction
Asteraceae belongs to the euasterids II clade of the core eudicots, one of the largest families of flowering plants. The head-like inflorescence (capitulum) of Asteraceae resembles a single large flower, and this trait is considered to be the key innovation behind the evolutionary suc-cess of the Asteraceae [1]. Thus, the trait has been the subject of many phylogenetic and biolog-ical studies. In recent years, molecular genetic research on flower development has been restricted toGebera hybridaandHelianthus annuusin Asteraceae.Chrysanthemum morifo-lium, another species of Asterceae, is an important crop that is widely cultivated, and indeed, complete year-round production of chrysanthemums is necessary to meet the demands of a growing market [2]. However, the flowering mechanisms and molecular pathways of chrysan-themums involved in flower development have not been well characterized to date due to the lack of genomic information [2].
In temperate regions, the duration of the daily light period, also called the photoperiod, is one of the most important factors controlling flowering time [3]. In Arabidopsis, many genes involved in daylength response have been identified through molecular-genetic approaches, in-cluding the genes encoding regulatory proteins for the regulation of flowering, light signal transduction pathways and circadian clock function, such asCRYPTOCHROME2/FHA
(CRY2),GIGANTEA(GI),TIMING OF CAB 1(TOC1) andCONSTANS(CO) [3]. Some im-portant downstream regulatory genes have been identified in the photoperiod pathway. For ex-ample, the crucial regulator LEAFY (LFY) functions in floral specification. LFY exhibits weak expression in vegetative tissues, and its expression is significantly up-regulated after receiving photoperiodic signals regulated by the FT pathway and gibberellins [4,5]. Many
MADS-Box transcription factors members, along with APETALA2 (AP2), also play important roles in floral initiation, such asSUPPRESSOR OF CONSTANS1(SOC1),SHORT VEGETA-TIVE PHASE(SVP),LEAFY(LFY),APETALA1(AP1),GIGANTEA(GI),AGAMOUS(AG) andPISTILLATA(PI). After the initial expression ofLFY,AP1is expressed throughout the flo-ral meristem, and together withAP2, specifies sepal identity [4,6]. Various feedback mecha-nisms are used to regulate the actions of these genes in floral meristem specification and in the transition to flowering that occurs by promoting floral initiation and repressing vegetative growth [4]. The classic ABC model includes A-class genes (AP1,AP2), which determine sepal identity, A-class genes together with B-class genes (AP3,PI), which determine petals, B-class genes together with a C-class gene (AG), which specify stamens, and the C-class gene, which specifies carpel identity [7].
homologous genesAPETALA1,SEPALLATA3, andFRUITFULL[8]. Therefore, the identifica-tion of novel genes and molecular regulatory pathways with important funcidentifica-tions will be neces-sary to improve year-round production techniques in chrysanthemum.
Transcription expression profiling, data assembly, and analysis can provide broad and deep insights into gene regulatory networks and biological pathways because they can reveal the genes downstream of key transcription factors in related pathways [9]. The use of RNA-Seq in the studies of chrysanthemum and related species has been demonstrated [10–12]. However, to date, no transcriptome information concerning the different flower developmental periods of chrysanthemum has been reported. In this study, transcriptional sequencing and analysis of vegetative buds (the apical buds during vegetative growth), floral buds (the apical buds during flower differentiation) and buds of chrysanthemum were performed using Illumina assembly technology and RNA-Seq quantification analysis. Based on transcriptional sequencing and analysis, we first identified differentially expressed genes (DEGs) between the vegetative buds, floral buds and buds to uncover novel genes involved in regulating the phase transition from vegetative to reproductive growth. Next, we identified important regulatory genes involved in the photoperiod pathway and the control of flower organ identification to create a list of candi-date genes for studying flowering-time regulation in chrysanthemum. These results will be helpful for elucidating the molecular mechanisms of flower development and will contribute to the development of techniques for studying flowering-time regulation, breeding and molecular biology in chrysanthemum.
Results
Illumina sequencing and assembly
The cDNA libraries of vegetative buds, floral buds and buds were sequenced using the Illumina HiSeq 2000 system. After stringent quality checks and data cleaning, 58,530,798, 41,424,050 and 54,035,520 clean reads were left for vegetative buds, floral buds and buds, respectively. The average proportion of clean reads for these libraries was approximately 93%.
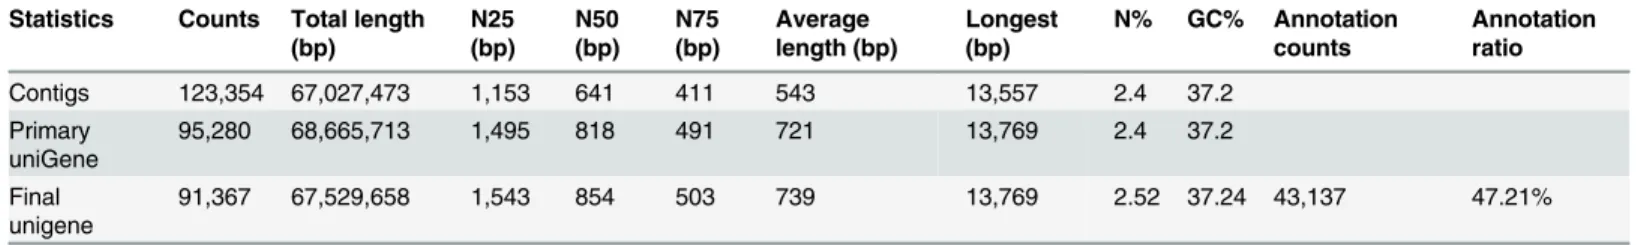
A total of 123,354 contigs were assembled based on the high-quality reads, with a total size of 67,027,473 bp, an N50 of 641 bp and an average contig length of 543 bp. Then, scaffolds were constructed between the contigs via the paired-end relationships between the reads. A total of 95,280 scaffolds were obtained, with an N50 of 818 bp and an average length of 721 bp. We filled the intra-scaffold gaps and constructed a non-redundant unigene set from all three of the assembled datasets using CAP3 software. Finally, a total of 91,367 high-quality unigene se-quences with lengths greater than 400 bp were obtained, with an average unigene length of 739 bp (Table 1).
Gene annotation and functional classification
Of the 91,367 unigenes, 43,137 (47.21% of the total) were aligned to the Nr protein (date 2014.03) and Swissprot protein databases (date 2014.03) using an E-value threshold of<1e-5,
which meant that 48,230 unigenes (52.79% of the total) had no Swiss-Prot annotations because of missing chrysanthemum genome and expressed sequence tag (EST) information (Table 1).
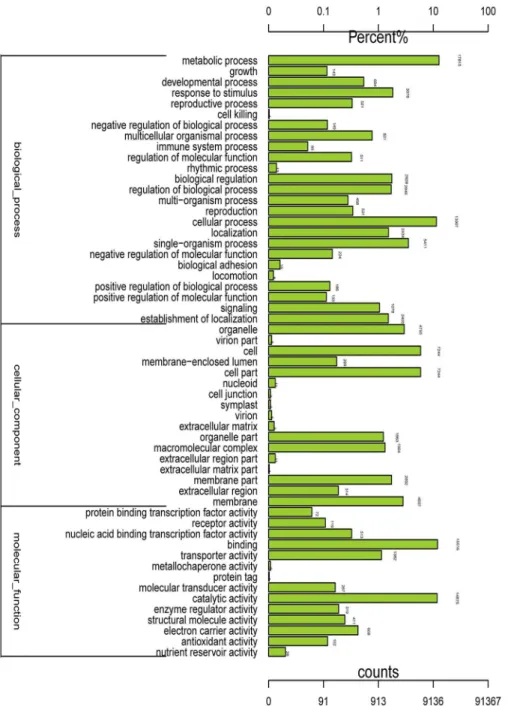
The international standardized gene functional classification system Gene Ontology (GO) provided three ontologies—molecular functions, cellular components and biological processes—
classifications, the‘metabolic process’(in‘biological process’),‘cell part’(in‘cell component’), and‘binding’(in‘molecular function’) terms were dominant in level 2. And 17,815 (92.98%), 7244 (71.98%), and 15,516 (68.84%) unigenes were assigned to‘metabolic process’
(GO:0008152),‘cell part’(GO:0044464) and‘binding’(GO:0005488), respectively. It was indicat-ed that complex metabolic processes regulatindicat-ed by a wide range of genes that also interact with one another in cell parts were activated during the development of flower in chrysanthemum. In addition, we also noted high percentages of genes from the‘cellular process’(GO:0009987),‘cell’
(GO:0005623), and‘catalytic activity’(GO:0003824) categories, which included 13,907 (72.58%), 7244 (71.98%) and 14,876 (65.99%) unigenes, respectively. By contrast, there were relatively few genes from the‘cell killing’(GO:0001906),‘extracellular matrix part’(GO:0044420), and‘protein tag’(GO:0031386) categories in each of the three main GO classifications (Fig 1).
Within the 'biological process' category, we identified 13 terms related to flower develop-ment in level 6, including‘flower development’(GO:0009908),‘regulation of flower develop-ment’(GO:0009909),‘photoperiodism, flowering’(GO:0048573),‘positive regulation of flower development’(GO:0009911),‘regulation of photoperiodism, flowering’(GO:2000028),‘ nega-tive regulation of flower development’(GO:0009910),‘regulation of long-day photoperiodism, flowering’(GO:0048586),‘long-day photoperiodism, flowering’(GO:0048574),‘negative regu-lation of long-day photoperiodism, flowering’(GO:0048579),‘flower calyx development’
(GO:0048464),‘short-day photoperiodism, flowering’(GO:0048575),‘flower morphogenesis’
(GO:0048439) and‘regulation of short-day photoperiodism, flowering’(GO:0048587). In total, 113 unigenes were assigned to these 13 terms, of which 86 were annotated as uncharacterized or predicted proteins and the remainder showing homology to F-box family genes and GIGAN-TEAetc. (S1 Table).
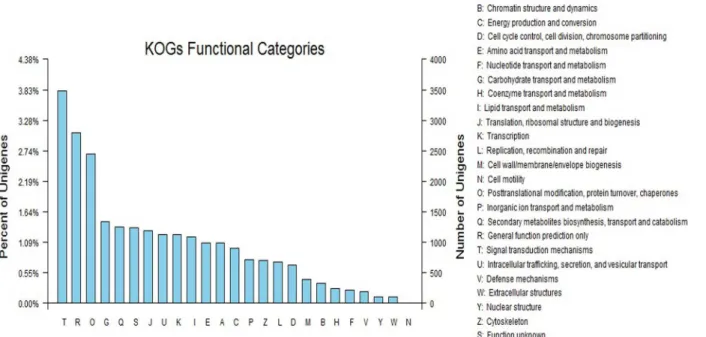
As a eukaryote-specific version of the Clusters of Orthologous Groups (COG) tool, euKary-otic Orthologous Groups (KOG) is used to identify orthologous and paralogous proteins, pro-viding a way to identify Joint Genome Institute (JGI)-predicted genes by KOG classification or ID. The annotated sequences were further searched for genes involved in KOG classifications for evaluating the completeness of our transcriptome library and the effectiveness of our anno-tation process. Of 43,137 Nr hits, 24,321 sequences were assigned to KOG classifications. Among the 25 KOG categories, the cluster for‘Signal transduction mechanisms’(3487, 14.34%) represented the largest group, followed by‘General function prediction only’(2798, 11.50%) and‘Posttranslational modification, protein turnover, chaperones’(2453, 10.09%). The‘Nuclear structure’(108, 0.44%),‘Extracellular structures’(104, 0.43%), and‘Cell motility’
(8, 0.032%) categories represented the smallest groups (Fig 2).
To further analyze the chrysanthemum transcriptome, all unigenes were compared with the Kyoto Encyclopedia of Genes and Genomes (KEGG) database using BLASTx with an E-value threshold of<1e-5. Of the 43,137 unigenes, 13,704 had significant matches in the database
and were assigned to 285 KEGG pathways (Table 2). The most represented pathways were
‘Metabolic pathways’(3426 members),‘Biosynthesis of secondary metabolites’(1881 Table 1. Summary for the chrysanthemum transcriptome.
Statistics Counts Total length
(bp)
N25 (bp)
N50 (bp)
N75 (bp)
Average length (bp)
Longest (bp)
N% GC% Annotation
counts
Annotation ratio
Contigs 123,354 67,027,473 1,153 641 411 543 13,557 2.4 37.2
Primary
uniGene 95,280 68,665,713 1,495 818 491 721 13,769 2.4 37.2
Final
unigene 91,367 67,529,658 1,543 854 503 739 13,769 2.52 37.24 43,137 47.21%
members),‘Microbial metabolism in diverse environments’(755 members),‘Biosynthesis of amino acids’(473 members), and‘Carbon metabolism’(463 members). In addition, 372 uni-genes were assigned to‘plant hormone signal transduction’. The annotations provide a valuable resource to research the processes, functions, and pathways involved in floret development in chrysanthemum.
Fig 1. Histogram presentation of Gene Ontology classifications.The results are summarized in three
main categories: biological processes, cellular components, and molecular functions. The y-axis on the left side indicates the percentage of genes in a category, and the y-axis on the right side shows the number of genes.
Comparison of transcriptomes between vegetative buds, floral buds and
buds
The common set of unigenes between vegetative buds, floral buds and buds. The num-ber of unigenes with an RPKM value of>0.3 that were shared by vegetative buds and floral
buds, floral buds and buds, and vegetative buds and buds were 80,769, 81,794, and 80,984, re-spectively. Vegetative buds, floral buds and buds shared 78,561 unigenes in common (Fig 3). By contrast, 496, 1294 and 3128 unigenes showed specific expression in vegetative buds, floral buds and buds, respectively. During development from vegetative growth to flower differentia-tion and bud formadifferentia-tion, an increasing number of genes are expressed in chrysanthemum.
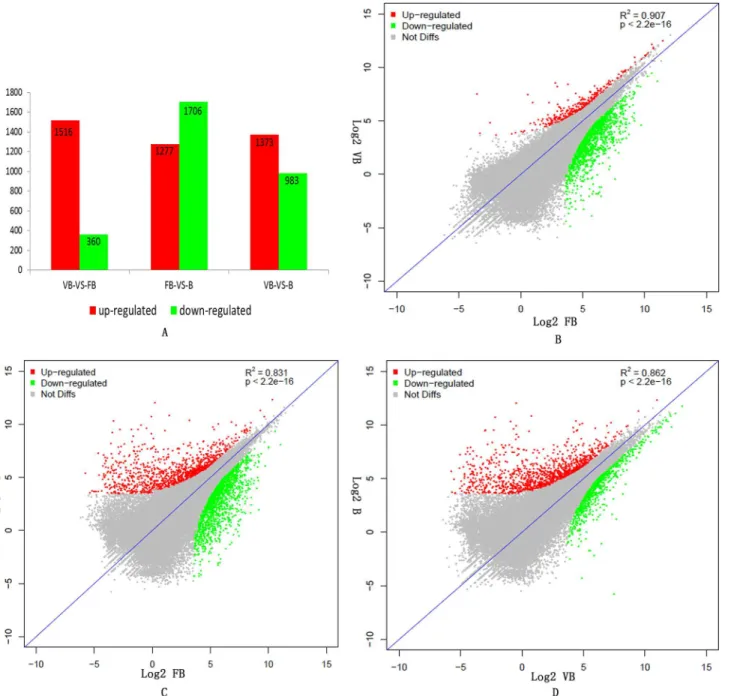
DEGs between vegetative buds, floral buds and buds. The resulting reads were mapped to our reference transcriptome; statistical significance values were taken to be reliable with an RPKM value2 in at least one of the three samples. Transcriptomes were compared, and dif-ferentially expressed genes (DEGs) were analyzed in three samples: vegetative buds, floral buds and buds. To determine which of the unigenes were differentially expressed, we filtered with an FDR0.05 and a |log2 (ratio)|2; 1,876 DEGs were significantly changed in expression be-tween vegetative buds and floral buds, of which 1,516 DEGs were up-regulated and 360 DEGs were down-regulated in the floral buds (Fig 4A).
GO and KEGG Pathway enrichment analyses were performed on the DEGs to identify dif-ferences in the biological processes and pathways between vegetative buds and floral buds. In total, 998 DEGs were enriched in GO categories.Table 3listed some representative enriched GO terms between vegetative buds and floral buds. In the 'biological process' category, the dominant terms were the following:‘protein phosphorylation’(GO:0006468),‘ oxidation-re-duction process’(GO:0055114),‘regulation of transcription, DNA-dependent’(GO:0006355),
‘phosphorylation’(GO:0016310),‘metabolic process’(GO:0008152),‘transcription, DNA-de-pendent’(GO:0006351),‘carbohydrate metabolic process’(GO:0005975) and‘defense re-sponse’(GO:0006952). In the 'cellular component' category, the most representative terms
Fig 2. EuKaryotic Orthologous Groups (KOG) classifications in chrysanthemum.A total of 24,321 sequences with KOG classifications within the 25
categories are shown.
were the following:‘membrane’(GO:0016020),‘integral to membrane’(GO:0016021),‘ nucle-us’(GO:0005634),‘plasma membrane’(GO:0005886). Finally, in the 'molecular function' cate-gory the most representative terms were the following:‘ATP binding’(GO:0005524),
‘transferase activity, transferring phosphorus-containing groups’(GO:0016772), and‘protein kinase activity’(GO:0004672). As shown inTable 4, for the KEGG pathway analysis, the domi-nant pathways were the following:‘Metabolic pathways’(ko01100),‘Biosynthesis of secondary metabolites’(ko01110),‘RNA polymerase’(ko03020),‘Isoquinoline alkaloid biosynthesis’
Table 2. Categorization of Chrysanthemum unigenes to KEGG biochemical pathways.
KEGG Categories Mapped ko Unigene NO. Rotio of NO. Parthway ID
Metabolic pathways 744 3426 25.00% ko01100
Biosynthesis of secondary metabolites 348 1881 13.73% ko01110
Microbial metabolism in diverse environments 128 755 5.51% ko01120
Biosynthesis of amino acids 97 473 3.45% ko01230
Carbon metabolism 84 463 3.38% ko01200
Starch and sucrose metabolism 35 421 3.07% ko00500
Protein processing in endoplasmic reticulum 75 401 2.93% ko04141
Epstein-Barr virus infection 58 398 2.90% ko05169
RNA polymerase 23 395 2.88% ko03020
Plant hormone signal transduction 39 372 2.71% ko04075
mRNA surveillance pathway 46 368 2.69% ko03015
Influenza A 19 365 2.66% ko05164
Plant-pathogen interaction 35 362 2.64% ko04626
Isoquinoline alkaloid biosynthesis 7 353 2.58% ko00950
Spliceosome 83 344 2.51% ko03040
Drug metabolism—other enzymes 12 338 2.47% ko00983
RNA transport 80 303 2.21% ko03013
Ribosome 112 301 2.20% ko03010
Transcriptional misregulation in cancer 8 284 2.07% ko05202
RNA degradation 45 274 2.00% ko03018
Purine metabolism 81 261 1.90% ko00230
Glycolysis / Gluconeogenesis 32 257 1.88% ko00010
Fatty acid metabolism 28 249 1.82% ko01212
Aminoacyl-tRNA biosynthesis 25 233 1.70% ko00970
Amino sugar and nucleotide sugar metabolism 37 232 1.69% ko00520
Viral carcinogenesis 41 229 1.67% ko05203
Endocytosis 35 222 1.62% ko04144
Neurotrophin signaling pathway 12 222 1.62% ko04722
Pyruvate metabolism 30 220 1.61% ko00620
Ubiquitin mediated proteolysis 55 216 1.58% ko04120
Osteoclast differentiation 4 207 1.51% ko04380
Cell cycle 55 206 1.50% ko04110
Phenylpropanoid biosynthesis 18 201 1.47% ko00940
Protein export 24 195 1.42% ko03060
Oxidative phosphorylation 71 194 1.42% ko00190
Toll-like receptor signaling pathway 5 189 1.38% ko04620
Pertussis 5 187 1.36% ko05133
Apoptosis 6 183 1.34% ko04210
NF-kappa B signaling pathway 6 181 1.32% ko04064
(ko00950), and‘Plant hormone signal transduction’(ko04075). Interestingly, for many of the enriched GO terms, the majority of or all DEGs were up-regulated in floral buds relative to veg-etative buds, as was the case for‘phosphorylation’(GO:0016310),‘carbohydrate metabolic pro-cess’(GO:0005975),‘defense response’(GO:0006952),‘response to stress’(GO:0006950), and
‘signal transduction’(GO:0007165), among others. Similarly, most or all of the DEGs in many KEGG pathways were up-regulated in floral buds relative to vegetative buds, as was the case for
‘RNA polymerase’(ko03020),‘Isoquinoline alkaloid biosynthesis’(ko00950), and‘Starch and sucrose metabolism’(ko00500), among others. Detailed information on the DEGs that were differentially expressed between vegetative buds and floral buds is listed inS2andS3Tables.
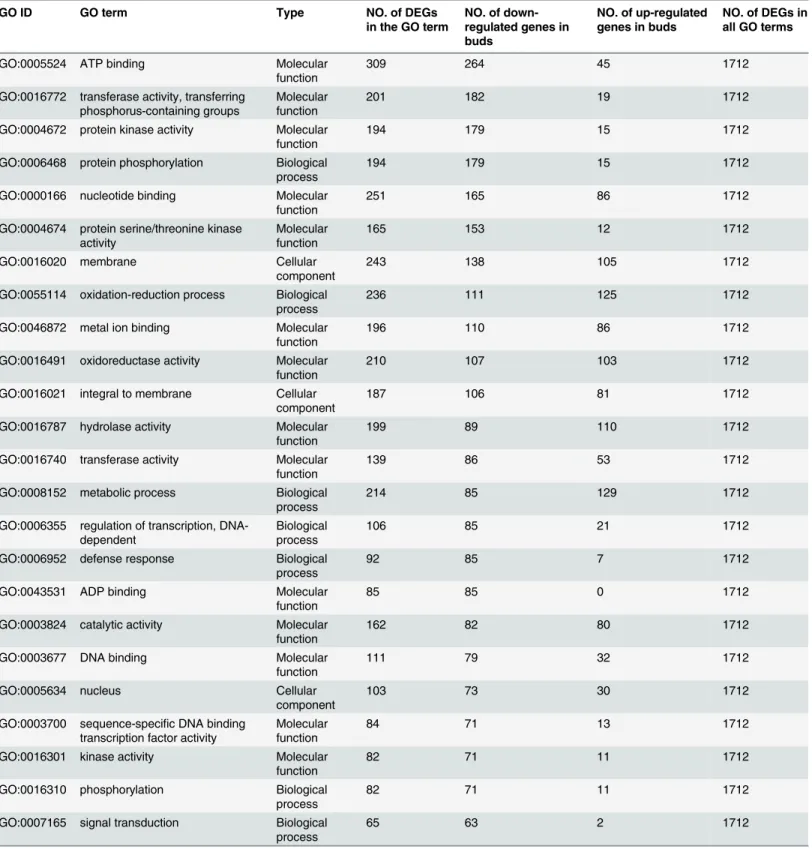
A total of 2,983 DEGs (1,706 down-regulated and 1,277 up-regulated in buds) were identified between floral buds and buds (Fig 4A). In total, 1712 DEGs between floral buds and buds were enriched in GO categories. As shown inTable 5, GO enrichment analysis of down-regulated genes in the 'biological processes' category identified a number of categories, including‘protein phosphorylation’(GO:0006468),‘oxidation-reduction process’(GO:0055114),‘metabolic pro-cess’(GO:0008152) and‘regulation of transcription, DNA-dependent’(GO:0006355). For the 'molecular function' category, the dominant terms among the down-regulated genes were‘ATP binding’(GO:0005524),‘transferase activity, transferring phosphorus-containing groups’
(GO:0016772) and‘protein kinase activity’(GO:0004672). For the 'cellular component' category, the dominant terms among the down-regulated genes were‘membrane’(GO:0016020),‘integral to membrane’(GO:0016021) and‘nucleus’(GO:0005634). As shown inTable 5, GO enrichment analysis of the up-regulated genes in buds relative to floral buds identified genes involved in‘ met-abolic process’(GO:0008152, in biological processes),‘hydrolase activity’(GO:0016787, in mo-lecular function), and‘membrane’(GO:0016020, in cellular component). In total, 546 DEGs were enriched for KEGG pathways, and the dominant pathways were‘Metabolic pathways’
(ko01100),‘Biosynthesis of secondary metabolites’(ko01110) and‘Isoquinoline alkaloid
Fig 3. Venn diagram of the number of unigenes with reads per kilobases per million mapped (RPKM)>
0.3 in vegetative buds (VB), floral buds (FB) and buds (B).
biosynthesis’(ko00950). Detailed information on the DEGs between floral buds and buds is listed inS4andS5Tables.
A total of 2,356 DEGs (983 down-regulated and 1,373 up-regulated in buds) were identified between buds and vegetative buds (Fig 4A). In addition, we also identified 174 DEGs specifical-ly expressed in buds relative to floral buds, which contained many genes involved in pistil and stamen development (S6 Table).
Fig 4. Gene expression differences among the different samples.A. The numbers of up- and down-regulated genes between vegetative buds (VB), floral
buds (FB) and buds (B). B. The correlation scatter plot of gene expression differences between vegetative buds (VB) and floral buds (FB). C. The correlation scatter plot of gene expression differences between floral buds (FB) and buds (B). D. The correlation scatter plot of gene expression differences between buds (B) and vegetative buds (VB).
Table 3. GO enrichment of DEGs between floral buds and vegetative buds.
GO ID GO term Type NO. of DEGs
in the GO term
NO. of down-regulated genes in
floral buds
NO. of up-regulated
genes infloral buds
NO. of DEGs in all GO terms
GO:0005524 ATP binding Molecular
function 210 23 187 998
GO:0016772 transferase activity, transferring
phosphorus-containing groups Molecularfunction 145 12 133 998
GO:0006468 protein phosphorylation Biological
process 142 11 131 998
GO:0004672 protein kinase activity Molecular
function 142 11 131 998
GO:0000166 nucleotide binding Molecular
function 142 27 115 998
GO:0004674 protein serine/threonine kinase
activity Molecularfunction 108 2 106 998
GO:0046872 metal ion binding Molecular
function 129 31 98 998
GO:0055114 oxidation-reduction process Biological
process 142 46 96 998
GO:0016491 oxidoreductase activity Molecular
function 131 43 88 998
GO:0016020 membrane Cellular
component 112 26 86 998
GO:0016021 integral to membrane Cellular
component 94 16 78 998
GO:0006355 regulation of transcription,
DNA-dependent Biologicalprocess 91 16 75 998
GO:0016787 hydrolase activity Molecular
function 81 8 73 998
GO:0003824 catalytic activity Molecular
function 86 15 71 998
GO:0016740 transferase activity Molecular
function 94 27 67 998
GO:0003677 DNA binding Molecular
function 96 30 66 998
GO:0008152 metabolic process Biological
process 97 36 61 998
GO:0003700 sequence-specific DNA binding
transcription factor activity Molecularfunction 64 8 56 998
GO:0016310 phosphorylation Biological
process 57 2 55 998
GO:0005634 nucleus Cellular
component 86 31 55 998
GO:0016301 kinase activity Molecular
function 57 2 55 998
GO:0008270 zinc ion binding Molecular
function 58 13 45 998
GO:0006351 transcription, DNA-dependent Biological
process 46 7 39 998
GO:0005975 carbohydrate metabolic process Biological
process 38 1 37 998
GO:0006952 defense response Biological
process 34 1 33 998
GO:0004553 hydrolase activity, hydrolyzing
O-glycosyl compounds Molecularfunction 34 1 33 998
To identify unigenes with significant changes in expression, the correlations in gene expres-sion between the three samples were studied using an algorithm developed from the correlation scatter plot. As shown inFig 4B, the difference in gene expression was smallest between vegeta-tive buds and floral buds, yielding a strong correlation in gene expression (R2= 0.907). By con-trast, the difference in gene expression was the largest between floral buds and buds, leading to a poor correlation in gene expression (R2= 0.831,Fig 4C).
Among the samples from three different developmental periods in chrysanthemum, the number of up-regulated genes in floral buds relative to vegetative buds (1516) was greater than the number in buds relative to floral buds (1277). Fewer genes (360) were down-regulated in floral buds relative to vegetative buds than the number down-regulated (1706) in buds relative to floral buds. Indeed, there were only 90 common DEGs among vegetative buds, floral buds and buds (Fig 5). In total, 1301 DEGs in vegetative buds and floral buds were also differentially expressed in floral buds and buds. By contrast, 397 DEGs in vegetative buds and floral buds were also differentially expressed in buds and vegetative buds (Fig 5). We also found that 1367 DEGs in floral buds and buds were differentially expressed in buds and vegetative buds (Fig 5).
Up-regulated unigenes during flower differentiation. By comparing the transcriptomes of vegetative buds, floral buds and buds, we found that many unigenes were dramatically up-regulated in floral buds and down-up-regulated in both vegetative buds and buds, suggesting that these genes play an important role during flower differentiation.
The expression levels of many important transcription factor genes, including the homologs of AP2, MYB, MYC, WRKY, NAC and CRT, were dramatically up-regulated in floral buds (Table 6andFig 6). Interestingly, we identified one CRT-binding gene (CRTCL) that was high-ly expressed in floral buds, weakhigh-ly expressed in vegetative buds, and not expressed at all in buds (Table 6). One homolog of AP2 (AP2CL3) was assigned to“organ morphogenesis”
(GO:0009887) under the 'biological process' category. Furthermore, many other homologs of these transcription factors were assigned to the‘nucleus’(GO:0005634),‘DNA binding’
(GO:0003677) and‘regulation of transcription, DNA-dependent’(GO:0006355) categories under 'cellular component,' 'molecular function' and 'biological process,' respectively.
Table 3. (Continued)
GO ID GO term Type NO. of DEGs
in the GO term
NO. of down-regulated genes in
floral buds
NO. of up-regulated
genes infloral buds
NO. of DEGs in all GO terms
GO:0043531 ADP binding Molecular
function 32 0 32 998
GO:0005506 iron ion binding Molecular
function 43 13 30 998
GO:0005509 calcium ion binding Molecular
function 31 1 30 998
GO:0020037 heme binding Molecular
function 38 11 27 998
GO:0009055 electron carrier activity Molecular
function 38 11 27 998
GO:0006950 response to stress Biological
process 26 0 26 998
GO:0005886 plasma membrane Cellular
component 30 4 26 998
GO:0007165 signal transduction Biological
process 24 0 24 998
The genes that were up-regulated during flower differentiation also included many genes that are responsive to phytohormones or are involved in phytohormone synthesis, as well as sugar synthesis/transport genes, kinase-like genes, ubiquitin-like genes, and resistance genes; numer-ous uncharacterized protein coding genes were also identified. These genes were enriched for the
‘carbohydrate metabolic process’(GO:0005975),‘signal transduction’(GO:0007165),‘protein ki-nase activity’(GO:0004672) and‘defense response’(GO:0006952) categories and are listed in
S7–S10Tables.
Identification of genes involved in the photoperiod pathway in
chrysanthemum
Chrysanthemum is a typical short-day plant; it can flower in response to a single short day. We searched for homologous genes of the important regulators involved in the photoperiod pathway in chrysanthemum. In Arabidopsis, many genes required for the daylength response have been identified using molecular-genetic approaches, among which some members code regulatory proteins specifically playing roles in the regulation of flowering; others en-code components in light signal transduction pathways or pathways related to circadian signaling, includingCRYPTOCHROME(CRY),PHYTOCHROME(PHY),LATE
Table 4. KEGG enrichment of DEGs between floral buds and vegetative buds.
Pathway ID
KEGG name NO. of DEGs in
the pathway
NO. of down-regulated genes
infloral buds in the pathway
NO. of up-regulated genes
infloral buds in the pathway
NO. of DEGs in all pathways
ko01100 Metabolic pathways 173 62 111 406
ko01110 Biosynthesis of secondary
metabolites 112 45 67 406
ko03020 RNA polymerase 41 2 39 406
ko00950 Isoquinoline alkaloid
biosynthesis 35 0 35 406
ko04075 Plant hormone signal
transduction 29 7 22 406
ko00983 Drug metabolism—other
enzymes 28 0 28 406
ko05202 Transcriptional misregulation in
cancer 27 5 22 406
ko04626 Plant-pathogen interaction 27 0 27 406
ko05164 Influenza A 26 0 26 406
ko01120 Microbial metabolism in diverse environments
26 14 12 406
ko00500 Starch and sucrose metabolism 24 0 24 406
ko05133 Pertussis 23 0 23 406
ko00940 Phenylpropanoid biosynthesis 23 9 14 406
ko04722 Neurotrophin signaling pathway 23 0 23 406
ko00945 Stilbenoid, diarylheptanoid and gingerol biosynthesis
22 11 11 406
ko04210 Apoptosis 22 0 22 406
ko04620 Toll-like receptor signaling
pathway 22 0 22 406
ko04380 Osteoclast differentiation 22 0 22 406
ko04064 NF-kappa B signaling pathway 21 0 21 406
ko04141 Protein processing in
endoplasmic reticulum 20 0 20 406
ELONGATED HYPOCOTYL(LHY),EARLY FLOWERING 4(EFL4),FLAVIN-BINDING KELCH REPEAT F-BOX 1(FKF1),TIMING OF CAB 1(TOC1),ZEITLUPE(ZTL) and Table 5. GO enrichment of DEGs between buds and floral buds.
GO ID GO term Type NO. of DEGs
in the GO term
NO. of down-regulated genes in buds
NO. of up-regulated genes in buds
NO. of DEGs in all GO terms
GO:0005524 ATP binding Molecular
function 309 264 45 1712
GO:0016772 transferase activity, transferring
phosphorus-containing groups Molecularfunction 201 182 19 1712
GO:0004672 protein kinase activity Molecular
function 194 179 15 1712
GO:0006468 protein phosphorylation Biological
process 194 179 15 1712
GO:0000166 nucleotide binding Molecular
function 251 165 86 1712
GO:0004674 protein serine/threonine kinase
activity Molecularfunction 165 153 12 1712
GO:0016020 membrane Cellular
component 243 138 105 1712
GO:0055114 oxidation-reduction process Biological
process 236 111 125 1712
GO:0046872 metal ion binding Molecular
function 196 110 86 1712
GO:0016491 oxidoreductase activity Molecular
function 210 107 103 1712
GO:0016021 integral to membrane Cellular
component 187 106 81 1712
GO:0016787 hydrolase activity Molecular
function 199 89 110 1712
GO:0016740 transferase activity Molecular
function 139 86 53 1712
GO:0008152 metabolic process Biological
process 214 85 129 1712
GO:0006355 regulation of transcription,
DNA-dependent Biologicalprocess 106 85 21 1712
GO:0006952 defense response Biological
process 92 85 7 1712
GO:0043531 ADP binding Molecular
function 85 85 0 1712
GO:0003824 catalytic activity Molecular
function 162 82 80 1712
GO:0003677 DNA binding Molecular
function 111 79 32 1712
GO:0005634 nucleus Cellular
component 103 73 30 1712
GO:0003700 sequence-specific DNA binding
transcription factor activity Molecularfunction 84 71 13 1712
GO:0016301 kinase activity Molecular
function 82 71 11 1712
GO:0016310 phosphorylation Biological
process 82 71 11 1712
GO:0007165 signal transduction Biological
process 65 63 2 1712
GIGANTEA(GI) and others [3]. In this study, many unigenes from the chrysanthemum transcriptome were identified as homologous genes of the photoreceptor and circadian clock components in the photoperiod pathway (Fig 7). Based on the protein annotations of the chrysanthemum transcriptome sequences, a number of genes were identified, including five homologs ofCRY(CRYCL1,CRYCL2,CRYCL3,CRYCL4,CRYCL5), six homologs ofPHY
(PHYCL1,PHYCL2,PHYCL3,PHYCL4,PHYCL5,PHYCL6), one homolog ofLHY
(LHYCL), one homolog ofEFL4(EFL4CL), four homologs ofFKF1(FKF1CL1,FKF1CL2,
FKF1CL3,FKF1CL4), one homolog ofTOC1(TOC1CL), one homolog ofZTL(ZTLCL), and three homologs ofGI(GICL1,GICL2,GICL3).CONSTANS(CO) is a key regulator of the photoperiod response, and one homolog ofCO(COCL1) was identified.FT(Flowering Locus T) is the early target ofCO, and one homolog ofFT(FTCL) was also identified (Fig 7). In the photoperiod pathway, many MADS box genes also play key roles in promoting floral meri-stem identity, includingSUPPRESSOR OF CONSTANS1(SOC1),SHORT VEGETATIVE PHASE(SVP),LEAFY(LFY),APETALA1(AP1),GIGANTEA(GI),AGAMOUS(AG) and
PISTILLATA(PI).APETALA2(AP2) also play key roles in promoting floral meristem identi-ty. And homologs of these MADS box genes andAP2were also identified (Fig 7).LEAFY
(LFY) is a vital regulator of the specification of floral meristem identity. This gene is initially expressed very early throughout the presumptive floral meristem, and its expression leads to a cascade of transcriptional activities that control floral meristem development and meristem identity [4]. We found one homolog ofLFY(LFYCL) that was significantly up-regulated in floral buds. SOC1 is an upstream regulatory gene ofLFY. Two homologs ofSOC1,SOC1CL1
andSOC1CL2, were identified in chrysanthemum, and their expression levels were signifi-cantly up-regulated in the floral bud stage.AP1is‘A-class’like gene;LFYdirectly activates
AP1transcription [4,14].
InArabidopsis,AP1andLFYare expressed throughout the floral meristem and are thought to regulate floral initiation via cell-to-cell signaling [15].AP1CL1andAP1CL2, which are Fig 5. Venn diagram of the number of DEGs between vegetative buds (VB), floral buds (FB) and buds (B).
Table 6. The transcription factors family genes up-regulated in floral buds.
Gene Name Protein description Vegetative
buds (RPKM) Floral buds (RPKM) Buds (RPKM) Fold change (Floral buds/ Vegetative buds) Fold change (Floral Buds/ Buds) P-value FDR
AP2/ERFCL2 AP2/ERF domain-containing transcription factor
2.128 18.600854 1.552713 8.742122 11.97958
2.22E-05 7.50E-05
AP2/ERFCL3 AP2/ERF and B3 domain-containing transcription factor
5.11 31.521888 0.399682 6.168944 78.86742
8.01E-09 6.22E-07
AP2CL2 AP2 domain-containing
transcription factor 3.32 24.286505 1.709164 7.315126 14.20958 5.68E-06 2.74E-04
AP2CL1 AP2 domain class
transcription factor 28.32 66.328704 19.98047 2.342184 3.319677 4.42E-07 2.62E-05
AP2/ERFCL1 AP2/ERF transcription
factor 39.06 206.89651 12.35639 5.296929 16.74409 5.99E-46 3.80E-43
WRKYCL1 WRKY transcription
factor 5.025 53.435992 1.397138 10.63388 38.24674 4.58E-14 6.16E-12
WRKYCL2 WRKY transcription
factor 20.95 79.003856 2.02556 3.771188 39.00346 2.12E-20 4.66E-18
WRKY22CL WRKY22 transcription
factor 2.088 16.306073 0.56334 7.811082 28.94536 1.45E-04 5.15E-03
WRKYP2CL WRKYP2 transcription
factor 5.057 19.878 3.570632 3.930575 5.567082 1.55E-03 4.02E-02
DoubleWRKYCL Double WRKY type
transfactor 2.455 43.658545 2.047324 17.78694 21.32469 2.51E-10 2.32E-08
WRKY70CL WRKY transcription
factor 35.8 100.88176 3.974785 2.818084 25.38043 2.74E-25 7.82E-23
WRKY40CL WRKY transcription
factor 5.058 20.196108 0.53264 3.993031 37.91703 1.10E-05 5.01E-04
WRKYCL3 WRKY transcription
factor 16.02 21.976893 0.56679 1.372259 38.77428 5.75E-06 2.76E-04
MYBCL1 Myb-like protein 9.508 165.33942 0.926526 17.3897 178.451
2.43E-48 1.70E-45
MYB21CL MYB21 transcription
factor 3.314 50.074228 1.290033 15.11119 38.81625 3.27E-13 4.11E-11
MYBCL3 Myb-related
transcription factor 18.27 74.406767 13.14954 4.071955 5.658508 3.15E-11 3.24E-09
MYBCL4 Myb-like DNA-binding
protein 2.794 24.532345 3.943807 8.780541 6.220473 1.04E-04 3.83E-03
MYC2CL MYC2 transcription
factor 27.05 185.92307 17.2481 6.87242 10.77934 3.17E-36 1.41E-33
MYC2aCL MYC2a transcription
factor 36.76 223.89981 22.79817 6.091271 9.820956 2.19E-42 1.26E-39
MYC1bCL MYC1b transcription
factor 27.82 208.84963 22.00965 7.508086 9.489001 1.51E-38 7.33E-36
AtMYC2CL Transcription factor 19.19 127.7421 12.04762 6.656098 10.6031
7.34E-25 2.03E-22
NACCL NAC transcription factor 0.629 33.870427 4.568384 53.83805 7.414094
2.45E-06 1.29E-04
CRT/DRECL CRT/DRE binding
factor 1.785 170.54517 7.639998 95.52265 22.32267 3.44E-48 2.40E-45
CRTCL CRT binding factor 0.05 12.4159 0 248.318
1.83E-03 4.63E-03
homologous toAP1, were initially expressed in floral buds and exhibited higher expression lev-els in buds in chrysanthemum. The third homolog ofAP1,AP1CL3, exhibited higher expres-sion in vegetative buds, suggesting thatAP1CL3is probably not involved in floral meristem identity.AP2is the second‘A-class’gene that is not a MADS-box transcription factor. Many homologs ofAP2were identified in chrysanthemum (Fig 7), and the majority were significant-ly up-regulated in floral buds. The B-class genes of most core eudicot species include three dif-ferent lineages:PI,euAP3andTM6.TM6-like genes appear to have been lost inArabidopsis
andAntirrhinum[16]. In chrysanthemum, we identified homologs for all three genesPI,
euAP3andTM6(PICL,AP3CL,TM6CL). In addition, we identified one homolog of the C-class geneAG(AGCL) in chrysanthemum. The homologs ofAP3,PI,TM6andAG, were ini-tially expressed in the floral buds, although they showed the highest expression in buds. Fig 6. A heat-map showing transcription factor family genes that were differentially expressed between vegetative buds (VB), floral buds (FB) and
buds (B) in chrysanthemum.Columns and rows in the heat maps represent samples and genes, respectively. Sample names are displayed below the heat
maps. The color scale indicates fold-change in gene expression. Red indicates high expression and green indicates low expression.
Annotation information for unigenes involved in the photoperiod pathway in chrysanthemum is listed inS11 Table.
Verification of gene expression profiles by qRT-PCR
To further confirm the expression data of the genes in the Illumina sequencing analyses, we ran-domly selected 20 unigenes for qRT-PCR evaluation using the vegetative bud, floral bud and bud samples that were originally used for RNA-Seq (Fig 8). Among the 20 selected unigenes, 10 were annotated as known proteins (MADS-boxCL1,MADS-boxCL2,MADS-boxCL3,GDEF1CL,AP2/ ERFCL3,CRTCL,MYBCL1,DoubleWRKYCL,GA2O2CL,ETHR3CL) and 10 were annotated as uncharacterized or predicted proteins (UnknownC1,UnknownC2,UnknownC3,UnknownC4,
UnknownC5,UnknownC6,UnknownC7,UnknownC8,UnknownC9,UnknownC10). The expres-sion of 4 genes (GDEF1CL,MADS-boxCL1,MADS-boxCL2andMADS-boxCL3) was only weak-ly detected in vegetative buds and floral buds by qRT-PCR (Fig 8A). Consistent with this, these genes were also assigned minimal expression levels by RNA-Seq analysis (S12 Table). The expres-sion patterns of the 20 selected genes were nearly identical, and the gene expresexpres-sion levels de-tected by Illumina sequencing analysis were consistent with the qRT-PCR results.
Discussion
For the chrysanthemum transcriptome, approximately 16.5 Gb of data were generated and as-sembled into 91,367 unigenes with an average length of 739 bp. However, only 43,137 unigenes (47.21% of the total) were annotated in the Swiss-Prot database, and the remaining 48,230 uni-genes (52.79% of the total) had no Swiss-Prot annotations due to the lack of chrysanthemum
Fig 7. A schematic of flowering regulatory networks in the photoperiod pathway ofChrysanthemum
morifolium.Arrows indicate activation. All homologs of the regulators involved in the photoperiod pathway are listed inS11 Table. Numbers represent the members of the corresponding genes identified in the chrysanthemum transcriptome.
genomic and EST information. The assembly unigenes in this study were assigned to an exten-sive range of GO categories, KEGG pathways and KOG classifications, which indicated that various transcripts are involved in chrysanthemum flower development.
Comparative analysis of the transcriptomes revealed a wealth of valuable information. As shown inFig 3, vegetative buds, floral buds and buds shared 78,561 common unigenes, whereas only 496, 1294 and 3128 unigenes were specifically expressed in vegetative buds, floral buds and buds, respectively. Therefore, the majority of unigenes were expressed during all three de-velopmental stages. However, during flower bud differentiation and bud development, many unigenes were up-regulated and a small number of unigenes were turned off. Many unigenes were significantly up-regulated during flower differentiation, including many important tran-scription factors shown inTable 6. Previous studies have shown that the AP2/ERF transcrip-tion factors are expressed in response to developmental and environmental stimuli; some also played roles downstream of the ethylene, biotic, and abiotic stress signaling pathways in model plants [17]. WRKY proteins play regulatory roles in plant defense responses [18]. MYC/MYB
Fig 8. The expression profiles of 20 transcripts inChrysanthemum morifolium, as measured by
qRT-PCR.A. The expression profiles of 10 transcripts that were assigned as known proteins. B. The
expression profiles of 10 transcripts that were assigned as uncharacterized or predicted proteins.
transcription factors are involved in the ABA-dependent pathway to up-regulate abiotic stress-responsive genes [19,20]. NAC proteins are plant-specific transcription factors that function in diverse developmental processes and stress responses, though the biological functions of most NAC family genes remain unknown [21]. In the chrysanthemum transcriptome, AP2, WRKY, MYB, MYC, NAC genes are significantly up-regulated in floral buds relative to vegeta-tive buds and buds, indicating that these genes play important roles in chrysanthemum flower development and should be addressed in future studies (Table 6). Interestingly, two CRT genes were identified as highly expressed in floral buds. Both CRT genes (CRT/DRECL,CRTCL) showed minimal expression in vegetative buds, and one CRT gene (CRTCL) was not detected in buds. It is known that CRT genes are important regulators of plant reproductive events [22]. However, our findings suggest that CRT genes likely play a vital role in regulating chrysanthe-mum flower bud differentiation.
Among the important transcription factors mentioned above, some are involved in the same biological processes as genes involved in phytohormone signaling, the photoperiod pathway and organ determination. For example, 27 homologous genes were assigned to‘transcription, DNA-dependent’(GO:0006351) in the 'biological process' category. These genes include the homologs of CRT, SOC1, SVP, AGL, AP1, AP2, AP3, PI, TM6, AG, and SEP (CRT/DRECL,SOC1CL1,
SOC1CL2,SVP1CL,SVP3CL,AGLCL2,AP1CL1,AP1CL2,AP1CL3,AP2/ERFCL2,AP2CL1,
AP2CL2,AP2CL3,AP2/ERFCL1,AP3CL,PICL,TM6CL,AGCL1,AGCL3, andSEPCL) as well as several homologous genes in the ethylene signaling pathway. Another 'biological process' term,
‘regulation of transcription, DNA-dependent’(GO:0006355), included 37 genes that were the ho-mologs of WRKY, NAC, and CRT (WRKYCL1,WRKYCL2,WRKY22CL,DoubleWRKYCL,
WRKY70CL,WRKY40CL,WRKYCL3,NACCL,CRT/DRECL), LFY, SOC1, SVP, AGL, AP1, AP2, AP3, PI, TM6, AG, and SEP (LFYCL,SOC1CL1,SOC1CL2,SVP1CL,SVP3CL,AGLCL2,
AP1CL1,AP1CL2,AP1CL3,AP2/ERFCL2,AP2CL3,AP2CL2,AP2CL1,AP2/ERFCL1,AP3CL,
TM6CL,PICL,AGCL1,AGCL3, andSEPCL), as well as genes involved in the ABA and ethylene signaling pathways. The phase transition from vegetative to reproductive growth is a complex bi-ological process that is regulated by a wide range of genes that also interact with one another, leading to a cascade of physiological and biological changes. The functions of certain transcrip-tion factors, such as AP2, WRKY, MYB, MYC, NAC and CRT, during the regulatranscrip-tion of flower bud differentiation should be further studied in chrysanthemum.
Genes involved in signal transduction as well as sugar, kinase, ubiquitin and defense path-ways were also up-regulated in floral buds relative to vegetative buds and buds. These up-regu-lated genes were enriched for the GO categories‘carbohydrate metabolic process,’ ‘protein kinase activity,’ ‘plant hormone signal transduction,’and‘defense response,’among others. These findings indicate that genes involved in carbohydrate metabolic processes, protein kinase activities, plant hormone signal transduction, defense responses and other related processes play a role in floral differentiation in chrysanthemum. This hypothesis is also consistent with previous studies showing that 1) various phytohormones play an important role in the regula-tion of flowering in both long- and short-day plants; 2) the soluble sugar and starch contents of leaves and buds are temporarily increased inSinapisduring the induction of flowering; and 3) a calcium-dependent protein kinase is involved in photoperiodic flower induction inPharbitis nil. [23,24,25].
The chrysanthemum floral meristem initiates in response to a single short day; the photope-riod is considered to be the most important factor controlling chrysanthemum flowering time. We identified many genes (CRY,PHY,LHY,FKF1,TOC1,ZTL,GI,CO,FT) encoding compo-nents of light signal transduction pathways or related to circadian rhythms.LFYexpression leads to a series of transcriptional activities that control floral meristem formation and meri-stem identity [4]. The homologous gene (LFYCL) in chrysanthemum was identified. In addi-tion, the homologs of AP2 and many MADS box genes involved in floral meristem identity were identified in chrysanthemum. According to the ABC model, A function genes (AP1,AP2) specify the identity of the sepal, A function genes together with B function genes (AP3,PI, and
TM6) specify the petals, B function genes together with C function genes (AG) specify the sta-men, and C function genes specify the carpel. However, the capitulum of chrysanthemum is composed of hundreds of individual florets which are specialized in structure and function, in-dicating that the regulatory mechanism of A, B and C function genes should be further studied in this species. The homologous genes of A, B and C function genes were identified in this study. These genes are important candidate genes for molecular cloning and functional analysis of flowering regulation genes in chrysanthemum.
Conclusion
In this study, comparative transcriptome analysis revealed significant differences in gene ex-pression and signaling pathways among the vegetative buds, floral buds and buds in Chrysan-themum morifolium. We found that genes involved in specific biological processes were activated and considerably up-regulated during the process of flower bud differentiation, in-cluding genes coding for important transcription factors, as well as genes involved in carbohy-drate metabolic processes, protein kinase activities, plant hormone signal transduction and defense responses. These findings indicate that the phase transition from vegetative to repro-ductive growth is a complex biological process regulated by a wide range of factors, during which time many physiological processes, such as sugar metabolism and phytohormone regu-lation, become activated. The identification of homologous genes involved in the photoperiod pathway will likely contribute to studies of flowering-time regulation in chrysanthemum.
The transition from vegetative growth to the reproductive period in chrysanthemum is reg-ulated by a large number of genes involved in complex molecular pathways. These results rep-resent a first step towards illuminating the molecular mechanisms of flower development in chrysanthemum, and they will provide abundant genomic resources and new candidate genes for studies of flower-time regulation, breeding and molecular biology in this plant species.
Materials and Methods
Plant materials and RNA extraction
RNA Easyspin Isolation System, and a NanoDrop ND2000 instrument was used to assess the RNA quantity and quality.
Illumina sequencing, de novo assembly and functional annotation
To reveal differences in the chrysanthemum transcriptome before and after flower differentia-tion, we collected apical buds during the adult vegetative phase before short-day treatment. However, flower differentiation and bud development are continuous developmental process. Therefore, to obtain more complete transcriptome information, we pooled equivalent quanti-ties of total RNA isolated from different developmental stages of flower differentiation and bud development, and the pooled total RNA samples were used for sequencing. In total, 10μg totalRNA was collected for each sample for sequencing. We conducted Illumina sequencing using an Illumina HiSeq 2000 system according to the manufacturer’s protocols with paired-end 2×100-nt multiplexing according to the manufacturer’s instructions.Briefly, poly (A) mRNA was purified using magnetic beads with oligo (dT) and was then fragmented into small pieces. After the first-strand cDNAs were synthesized using random hexamer primers, the second strand was synthesized using appropriate buffers, dNTPs, RNase H, and DNA polymerase I. After purification using the QiaQuick PCR extraction kit, the double-stranded cDNAs were re-solved using EB buffer for end reparation and poly (A) addition. We then connected the short fragments with sequencing adapters. Finally, a cDNA library was constructed, which was se-quenced using an IlluminaHiSeq 2000. Low-quality reads were removed using an in-house Perl script. The transcriptome sequences were then assembled with clean reads. First, the distinct contigs were assembled using the short reads with the software program CLC Genomic Work-bench 5.5. Next, scaffolds between the contigs were constructed by employing the paired-end relationships between the reads. Finally, we filled the intra-scaffold gaps and constructed a non-redundant unigene set from the assembled datasets using CAP3 software [26].
For functional annotation, Blastx alignment (E-value\1.00E-5) was conducted between uni-genes and protein databases, including Nr (non-redundant protein database, NCBI), Swiss-Port (http://www.expasy.ch/sprot), KEGG (http://www.genome.jp/kegg) and KOG (http:// www.ncbi.nlm.nih.gov/KOG). The sequence directions of unigenes were identified according to the best alignment results. The Blast2GO program was used to produce GO (http://www. genome.jp/kegg) annotations for the assembled unigenes [27].
Statistical analyses
The expression levels of the unigenes were calculated by RNA-Seq quantification analysis as the number of reads per kilobase of an exon region in a given gene per million mapped reads (RPKM) [28]. The transcriptomes of the three samples were used as a reference to screen and analyze the differentially expressed unigenes. A rigorous algorithm was used to identify DEGs using the method of Audic et al. (1997) [29]. The false discovery rate (FDR) was used to deter-mine the threshold of the P-value in multiple tests and analyses [30]. A FDR of<0.05 and an
absolute value of log2 (ratio)2 were the thresholds used to define significant differences in gene expression [28]. The DEGs with minimum two-fold changes in expression were subjected to differential gene expression analysis.
Real-time quantitative PCR verification by qRT-PCR
volume of 20μL, which contained 2μL of first-strand cDNA as template. The amplification
program was: 30 s at 95°C, 40 cycles of 5 s at 95°C and 30 s at 60°C. Gene-specific primers (S12 Table) were designed to provide a relative quantification of each gene. All of the real-time RT-PCR experiments were conducted using three biological replicates, and all replicates were measured in triplicate. We analyzed the relative expression levels using the 2-ΔΔCt method, and the protein phosphatase 2A (PP2Acs) gene ofC.morifoliumwas used as a reference gene [31].
Supporting Information
S1 Table. The unigenes assigned to the GO terms related to flower development.
(XLSX)
S2 Table. Up-regulated genes in floral buds relative to vegetative buds.
(XLSX)
S3 Table. Down-regulated genes in floral buds relative to vegetative buds.
(XLSX)
S4 Table. Genes down-regulated in buds relative to floral buds.
(XLSX)
S5 Table. Genes up-regulated in buds relative to floral buds.
(XLSX)
S6 Table. DEGs specifically expressed in buds relative to floral buds.
(XLSX)
S7 Table. The unigenes enriched in 'carbohydrate metabolic process' (GO0005975).
(XLSX)
S8 Table. The unigenes enriched in 'signal transduction’(GO0007165).
(XLSX)
S9 Table. The unigenes enriched in‘protein kinase activity’(GO:0004672).
(XLSX)
S10 Table. The unigenes enriched in ' defense response' (GO:0006952).
(XLSX)
S11 Table. Homologous genes of the regulators involved in the photoperiod pathway in chrysanthemum.
(XLSX)
S12 Table. Primers used in qRT-PCR ofChrysanthemum morifolium.
(DOCX)
Author Contributions
References
1. Gillies AC, Cubas P, Coen ES, Abbott RJ. (2002) Making rays in the Asteraceae: genetics and evolu-tion of radiate versus discoid flower heads. In: Cronk QCB, Bateman RM, Hawkins JA. Developmental Genetics and Plant Evolution. Edited by London: Taylor & Francis;pp. 233–246.
2. Wang Y, Huang H, Ma Y, Fu J, Wang L, Dai S (2013) Construction and de novo characterization of a transcriptome of Chrysanthemum lavandulifolium: analysis of gene expression patterns in floral bud emergence. Plant Cell, Tissuse and Organ Culture. 116(3): 297–309.
3. Mouradov A, Cremer F, Coupland G (2001) Control of Flowering Time: Interacting Pathways as a Basis for Diversity. The Plant Cell 14: s111–s130.
4. Irish VF (2010) The flowering of Arabidopsis flower development. The Plant Journal 61: 1014–1028.
doi:10.1111/j.1365-313X.2009.04065.xPMID:20409275
5. Lee J, Oh M, Park H, Lee I (2008) SOC1 translocated to the nucleus by interaction with AGL24 directly regulates LEAFY. The Plant Journal 55: 832–843. doi:10.1111/j.1365-313X.2008.03552.xPMID:
18466303
6. Irish VF, Sussex IM (1990) Function of the apetala-1 gene during Arabidopsis floral development. The Plant Cell 2: 741–753. PMID:1983792
7. Litt A, Kramer EM (2010) The ABC model and the diversification of floral organ identity. Seminars in Cell & Developmental Biology 21: 129–137.
8. Shchennikova AV, Shulga OA, Immink R, Skryabin KG, Angenent GC (2003) Identification and Charac-terization of Four Chrysanthemum MADS-Box Genes, Belonging to the APETALA1/FRUITFULL and SEPALLATA3 Subfamilies. Plant Physiology 134: 1632–1641.
9. Liu Z, Ma L, Nan Z, Wang Y. (2013) Comparative Transcriptional Profiling Provides Insights into the Evolution and Development of the Zygomorphic Flower of Vicia sativa (Papilionoideae). PLoS ONE 8 (2): e57338. doi:10.1371/journal.pone.0057338PMID:23437373
10. Chen S, Miao H, Chen F, Jiang B, Lu J, Fang W. (2009) Analysis of Expressed Sequence Tags(ESTs) Collected from the Inflorescence of Chrysanthemum. Plant Mol Biol Rep. 27: 503–510.
11. Wang H, Jiang J, Chen S, Qi X, Peng H, Li p, et al. (2013) Next-Generation Sequencing of the Chrysan-themum nankingense (Asteraceae) Transcriptome Permits Large-Scale Unigene Assembly and SSR Marker Discovery. PLoS ONE. 8(4): e62293. doi:10.1371/journal.pone.0062293PMID:23626799 12. Xu Y, Gao S, Yang Y, Huang M, Cheng L, Wei Q, et al. (2013) Transcriptome sequencing and whole
genome expression profiling of chrysanthemum under dehydration stress. BMC Genomics. 14:662 doi:10.1186/1471-2164-14-662PMID:24074255
13. Conesa A, Gotz S, Garcia-Gomez JM, Terol J, Talon M, Robles M (2005) Blast2GO: a universal tool for annotation, visualization and analysis in functional genomics research. Bioinformatics. 21: 3674–3676.
PMID:16081474
14. Wagner D, Sablowski RWM, Meyerowitz EM (1999) Transcriptional Activation of APETALA1 by LEAFY. Science 285: 582–584. PMID:10417387
15. Wu X, Dinneny JR, Crawford KM, Rhee Y, Citovsky V, Zambryski PC, et al. (2003) Modes of intercellu-lar transcription factor movement in the Arabidopsis apex. Development 130: 3735–3745. PMID:
12835390
16. Broholm SK, Pöllänen E, Ruokolainen S, Tähtiharju S, Kotilainen M, Albert VA, et al. (2009) Functional characterization of B class MADS-box transcription factors in Gerbera hybrida. Journal of Experimental Botany 61: 75–85.
17. Xie X, Shen S, Yin X, Xu Q, Sun C, Grierson D, et al. (2014) Isolation, classification and transcription profiles of the AP2/ERF transcription factor superfamily in citrus. Molecular Biology Reports 41: 4261–
4271. doi:10.1007/s11033-014-3297-0PMID:24566692
18. Dong J, Chen C, Chen Z (2003) Expression profiles of the Arabidopsis WRKY gene superfamily during plant defense response. Plant Molecular Biology 51: 21–37. PMID:12602888
19. Agarwal PK, Jha B (2010) Transcription factors in plants and ABA dependent and independent abiotic stress signalling. Biologia Plantarum 54: 201–212.
20. Urao T, Yamaguchi-Shinozaki K, Mitsukawa N, Shibata D, Shinozaki K (1996) Molecular cloning and characterization of a gene that encodes a MYC-related protein in Arabidopsis. Plant Molecular Biology 32: 571–576. PMID:8980509
21. Ooka H, Satoh K, Doi K, Nagata T, Otomo Y, Murakami K, et al. (2003) Comprehensive Analysis of NAC Family Genes in Oryza sativa and Arabidopsis thaliana. DNA Research 10: 239–247. PMID:
15029955
progamic phase, and double fertilization. Planta 239: 437–454. doi:10.1007/s00425-013-1971-4
PMID:24213153
23. Wilmowicz E, Frankowski K, GlaziÅska P, KÄsy J, Wojciechowski W, Kopcewicz J (2011) Cross talk between phytohormones in the regulation of flower induction in Pharbitis nil. Biologia Plantarum 55: 757–760.
24. Bodson M (1977) Changes in the carbohydrate content of the leaf and the apical bud of Sinapis during transition to flowering. Planta 135: 19–23. doi:10.1007/BF00387970PMID:24419887
25. Jaworski K, Szmidt-Jaworska A, Tretyn A, Kopcewicz J (2003) Biochemical evidence for a calcium-de-pendent protein kinase from Pharbitis nil and its involvement in photoperiodic flower induction. Phyto-chemistry 62: 1047–1055. PMID:12591257
26. Huang X, Madan A. (1999) CAP3: A DNA Sequence Assembly Program. Genome Res 9: 868–877.
PMID:10508846
27. Conesa A, Gotz S, Garcia-Gomez JM, Terol J, Talon M, Robles M (2005) Blast2GO: a universal tool for annotation, visualization and analysis in functional genomics research. Bioinformatics 21:3674–3676
PMID:16081474
28. Mortazavi A, Williams BA, McCue K, Schaeffer L, Wold B (2008) Mapping and quantifying mammalian transcriptomes by RNA-Seq. NATURE METHODS 5:621–628 doi:10.1038/nmeth.1226PMID:
18516045
29. Audic S, Claverie JM (1997) The significance of digital gene expression profiles. Genome Res 7: 986–
995. PMID:9331369
30. Hu JX, Zhao H, Zhou HH (2010) False Discovery Rate Control with Groups. JOURNAL OF THE AMER-ICAN STATISTICAL ASSOCIATION 105: 1215–1227. PMID:21931466