http://www.uem.br/acta ISSN printed: 1679-9275 ISSN on-line: 1807-8621
Doi: 10.4025/actasciagron.v39i4.32914
Adaptability and stability of reproductive and vegetative phases of
peach trees in subtropical climate
Filipe Bittencourt Machado de Souza1, Rafael Pio1*, João Paulo Rodrigues Alves Delfino
Barbosa2, Gregory Lynn Reighard3, Maraísa Hellen Tadeu1 and Paula Nogueira Curi1
1
Departamento de Agronomia, Universidade Federal de Lavras, Av. Doutor Sylvio Menicucci, 1001, 37200-000, Kennedy, Lavras, Minas Gerais, Brazil. 2Departamento de Biologia, Universidade Federal de Lavras, Lavras, Minas Gerais, Brazil. 3Horticulture Program Team, Plant and Environmental Sciences Department, Clemson University, Clemson, South Carolina, USA. *Author for correspondence. E-mail: [email protected]
ABSTRACT. The peach tree (Prunus persica) is a fruit species native to temperate climates that requires a chill during its hibernal period to overcome dormancy. However, due to genetic breeding, varieties are currently grown in subtropical and tropical regions where there are low occurrences of chill during this phenological stage. This study evaluated the adaptability and stability of the reproductive and vegetative phases of peach tree cultivars in a subtropical climate. An experiment was designed in randomized blocks with split time plots, with 23 peach tree cultivars and four replications, with each replication consisting of one plant and four shoots. The years of evaluated (plots) and the cultivars (subplots) were considered to be treatments. The relative rates of budburst (RRB), flowering (RRF), shoot formation (SF) and fruit set (FS), average time of budburst (ATB) and flowering (ATF), duration of budburst (DB) and flowering (DF) and number of hours with temperatures below 7.20°C were evaluated during the experimental period. The cultivars ‘Bonão’, ‘Ouromel-4’, ‘Libra’ and ‘Maciel’ demonstrated greater adaptability during the vegetative phase, whereas‘Ouromel-4’ and ‘Libra’ demonstrated greater adaptability and stability during the reproductive phase of peach trees in a subtropical climate.
Keywords: Prunus persica, fruit set, shoot formation, chill requirement.
Adaptabilidade e estabilidade de fases reprodutivas e vegetativas de pessegueiros em
clima subtropical
RESUMO. O pessegueiro (Prunus persica) é uma frutífera de clima temperado e necessita de frio durante o repouso hibernal para superar a dormência, entretanto, atualmente é cultivado em regiões subtropicais e tropicais, onde há menor ocorrência de frio durante essa fase fenológica. Este trabalho teve como objetivo avaliar a adaptabilidade e a estabilidade das fases vegetativa e reprodutiva de cultivares de pessegueiro em clima subtropical avaliando os estádios de brotação e floração. O delineamento utilizado foi em blocos casualizados com quatro repetições e quatro ramos por repetição, em esquema de parcelas subdivididas no tempo, no qual as parcelas representam o tempo (2 ciclos produtivos) e as subparcelas as cultivares (23). Foram avaliados a duração da brotação (DB) e floração (DF), o tempo médio de brotação (ATB) e floração (ATF), a quantidade de gemas vegetativas brotadas (RRB) e floríferas brotadas (RRF), a formação de ramos (SF) e frutificação efetiva (FS) e o número de horas com temperatura abaixo de 7,2ºC e 12ºC, e acima de 20ºC durante o período experimental. As cultivares ‘Bonão’, ‘Ouromel-4’, ‘Libra’ e ‘Maciel’ apresentam maior adaptabilidade e estabilidade da fase vegetativa e ‘Ouromel-4’ e ‘Libra’ apresentam maior adaptabilidade e estabilidade da fase reprodutiva de pessegueiro sob clima subtropical.
Palavras-chave: Prunus persica, frutificação efetiva, formação de ramos, requerimento em frio.
Introduction
The peach tree (Prunus persica) is a fruit species native to temperate climates, but varieties have been developed through genetic breeding for subtropical and tropical regions (Chagas et al., 2008; Scariotto, Citadin, Raseira, Sachet, & Penso, 2013). Mild winter climatic conditions are highly variable for peach tree production and are primarily related to temperatures during the dormancy period of the plants. The cultivars that
are best adapted to subtropical climates have reduced cold requirements (between 70 and 200 hours at temperatures below 7.2ºC) during their bud endodormancy period (Raseira & Nakasu, 1998; Barbosa, Chagas, Pommer, & Pio, 2010). It is believed that temperatures as high as 12ºC are effective in overcoming endodormancy in these cultivars, as verified by Citadin et al. (2014).
fruit tree buds (whether para-, endo-or ecodormancy). In areas with inadequate winter chilling, branches can respond to incomplete endodormancy by displaying symptoms of ‘prolonged dormancy syndrome’, which is characterized by erratic and prolonged budburst (Nava, Marodin, & Santos, 2009). When this occurs, acrotonic budburst tendencies are also reduced (Maguylo, Cook, & Theron, 2014).
The lack of adaptation of peach tree cultivars to mild winter conditions can cause both blooming and flowering to be insufficient and sporadic, thus limiting subsequent fruit yields (Scariotto et al., 2013). Increased emphasis should be placed on selecting cultivars that are well adapted to mild winter conditions in these locations. One factor that determines the adaptation to location is the need for winter cold, which is physiologically conditioned by the hormonal balance controlled by several genes and the environment (Wagner Júnior et al., 2009). This stability is defined as the ability to demonstrate highly predictable behaviour given certain environmental stimuli (Cruz & Carneiro, 2012). Adaptability and stability analyses are statistical procedures that enable the identification of cultivars with stable behaviour and predictable responses to environmental variations (Silva & Duarte, 2006).
Two factors are proposed to identify the time that is necessary between the onset of endodormancy and the flowering and blooming process: i) the requirement of accumulated cold for overcoming endodormancy and ii) the requirement of heat after overcoming endodormancy until full flowering, from after budding until full flowering and blooming (Citadin, Raseira, Herter, & Silva, 2001). Flowering is triggered by favourable environmental conditions, primarily temperature. The varied chill requirements of plants are determined genetically and should be met prior to the rise in temperature that is crucial for flowering.Low environmental temperatures during dormancy are the primary natural agents involved in inducing plant flowering (Guo, Dai, & Wang, 2015).
This study seeks to determine the adaptability and stability of reproductive and vegetative phases of peach trees in a subtropical climate.
Material and methods
The experiment was conducted at an experimental orchard in southern Minas Gerais State, municipality of Lavras, between May and August of 2014 and 2015. The Koppen climate classification for this region is Cwa - subtropical climate (21º14'S, 45º00'W and 918 metres of average
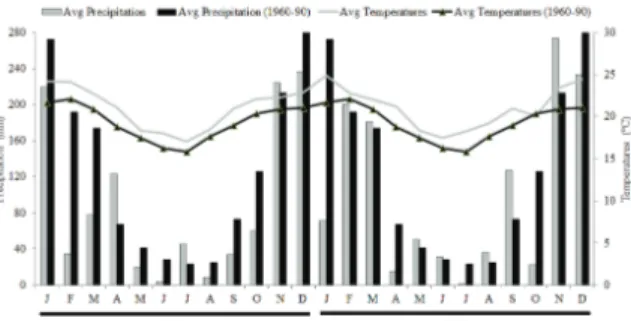
altitude), i.e., a subtropical climate with cold and dry winters and warm and moist summers (Souza, Pio, Tadeu, Zambon, and Reighard, 2017). The average temperature during the experimental period was 20.9ºC, whereas the average normal climatic temperature (1960-90) was 19.4ºC; the experimental period was 1.5ºC higher. The average precipitation during the experimental period was 1,166 mm yearly, whereas the average normal climatic rainfall was 1,530 mm; the experimental period was 364 mm lower (Figure 1).
Figure 1. Climate data from January 2014 to December 2015at Lavras – Minas Gerais State. Source: EstaçãoClimatológica Principal de Lavras – UFLA/INMET.
A total of 23 peach cultivars were studied: ‘Aurora-2’, ‘Delicioso Precoce’, ‘Eldorado’, ‘Marli’, ‘Okinawa’, ‘Dourado-2’, ‘Libra’, ‘Douradão’, ‘Diamante’, ‘Ouromel-4’, ‘Flor da Prince’, ‘Charme’, ‘Centenário’, ‘Maciel’, ‘Jóia-3’, ‘Tropical’, ‘Bonão’, ‘Biuti’, ‘Docura-2’, ‘Maravilha’, ‘Premier’, ‘Régis’, and ‘Kampai’. The peach cultivars were grafted on ‘Okinawa’ rootstock and were four years old, spaced at 1.0 metre in-row and 5.0 m between rows, and trained to a “Y’’ system. On June 2,2014 and May 31, 2015, pruning was performed followed by an application of 0.25% hydrogen cyanamide (a.i.).
Air temperature data were collected at a one-hour frequency by the Lavras Main Weather Station (UFLA/INMET)at the Federal University of Lavras (Universidade Federal de Lavras) and 1 km from the experimental area to calculate the number of hours with temperatures below 7.2ºC and 12ºC and above 25ºC from May to August. The chill requirement of each cultivar was estimated by calculating the means of the number of hours with temperatures below 12°C from May 1 until the onset of budding for each cultivar in the two years evaluated, as based on the methodology of Citadin, Raseira, Herter, & Silveira, 2002).
quadrants of each plant. The length (in centimetres) and the total number of vegetative and reproductive buds were measured on each shoot. After vegetative rest, the following phenological stages were checked every three days: beginning of flowering (BF - 5% of open flowers), beginning of budburst (BB - 5% of vegetative buds sprouted), full flowering (FF - 50% of open flowers), full budburst (FB - 50% of vegetative buds sprouted), end of flowering (EF – 75% of open flowers and start of the petal fall) and final budburst (FB – 75% of vegetative buds sprouted).
The relative rate of budburst (RRB) represents the percentage of sprouted vegetative buds as estimated by equation (1). An evaluation of budburst quality was conducted 45 days after final budburst, and sprouted buds that formed shoots or remained in the form of rosettes were evaluated. Equation (2) was utilized to estimate the rate of shoot formation (SF). The average time of budburst (ATB) and the average time for the onset of budding was estimated by equation (3). The duration of budburst (DB) was calculated by equation (4).
where: RRB = is the relative rate of sprouted vegetative buds; TNSVB = is the total number of sprouted vegetative buds; TNVB = is the total number of vegetative buds; SFA = is the rate of vegetative buds sprouted that formed shoots 45 days after the end of blooming; TNS = is the total number of shoots; ATB = corresponds to the average time between pruning and the detection of early sprouts; DP = is the date of pruning; DB corresponds to the budding period; DEB = is the date of the end of budding (EB); and DSB = is the date of the start of budding (BF).
The relative rate of flowering (FRR) represents the percentage of flower buds as estimated by equation (5). Flower buds that bore fruit were evaluated approximately 45 days after the end of flowering to evaluate the fruit set quality. The fruit set (FS) represents the number of fruits that formed flowers. Equation (6) was used to estimate the fruit set. The average flowering time (ATF) was the average time for the onset of flowering as estimated by equation (7). The duration of flowering (DF) was
the flowering time period of the cultivar as estimated by equation (8).
where: RRF = is the relative rate of flowering budburst; TNFB = is the total number of flowering budbursts; TNFB = is the total number of flowering buds; FS = represents the number of flowers that formed fruits; FSA = is the total number of fruits 45 days after the end of flowering; ATF = corresponds to the average time between pruning and the detection of early flowering; DBF = is the date of the beginning of flowering; DP = is the date of pruning; DF = is the duration of flowering; DBF = is the date of the beginning of flowering; and DEF = is the date of the end of flowering.
The experiment was designed as randomized blocks and split time plots, with 23 cultivars and four replications such that each replication consisted of one plant and four shoots for a total of 16 shoots per cultivar. The years evaluated (plots) and the cultivars (subplots) were considered to be treatments. The normality of the data was verified with the Shapiro-Wilk test and the homogeneity of the data was verified with the Bartlett test by using the computer application R (version 3.2.2 - 2015). Once the mathematical assumptions of the tests were met, an analysis of variance was carried out in which the effect of genotype was considered fixed and the environment was random; means clustering was determined with the Scott-Knott test by using the computer application GENES (Cruz, 2006). An evaluation of the adaptability and stability of the cultivars was performed with the original centroid method and the methodology proposed by Lin and Binns (1988) and modified by Rocha, Muro-Abad, Araújo, and Cruz (2005) and Nascimento et al. (2009).
Results and discussion
Chalfun (2002), the municipality of Lavras presents an average of 11.8 hours of cold below 7.2ºC and 100 units of cold per year. Due to the mild 2014 winter, the number of hours below 12ºC was greater than the hours below 7.2ºC, with 279 hours in 2014 and 436 hours in 2015; this demonstrates that temperatures above 7.2ºC are also effective in overcoming dormancy, particularly for cultivars with minimal cold requirements (Figure 2b). Based on the accumulated hours of heat (> 25ºC), 2015 was hotter than 2014; high temperatures over prolonged periods can affect the reproductive and vegetative development of peach trees. The expectation of colder temperatures as well as more hours of cold and relatively high diurnal temperatures in 2015 foreshadowed the phenological behaviour of the cultivars (beginning of budburst and flowering). Once the cold requirement of the cultivar is reached to overcome endodormancy, high temperatures are necessary for the cultivar to surpass ecodormancy.
The results of the analysis of variance for duration of budburst (DB), average budburst time (ATB), flowering duration (DF) and average flowering time (ATF) are presented in Table 1; the relative budburst rate (RRB), relative rate of flowering (RRF), shoot formation (SF) and fruit set (FS) are presented in Table 2. There was a significant interaction at the 5% probability level between the cultivars and the agricultural years evaluated; this demonstrates the environmental influence upon the genotypes studied.
The analysis of DB (Table 1) demonstrated that ‘Kampai’ presented a longer DB (73 days) in 2014; the shortest DB was ‘Charme’ (6.5 days). However, in 2015, ‘Premier’ and ‘Kampai’ presented the longest DB (39.50 and 37.25 days, respectively), whereas the shortest DB was ‘Marli’ (5.75 days). These results demonstrated that the different phenological responses of peach tree cultivars were due to genotypes and environmental interactions; a greater phenotypic responsiveness of a cultivar led to a greater sensitivity to the environment. According to Putti, Petri,and Mendes (2003), the variation of the average time of budburst among apple tree cultivars could be related not only to the cold requirements but also to the heat requirements after dormancy. Thus, the greatest amount and quality of cold (< 12ºC) and heat (> 25ºC) occurred in 2015, which resulted in an increased uniformity and a smaller range of blooming.
In 2014, ‘Charme’ presented a longer ATB (76.25 days), with the shortest ATB coming from ‘Kampai’ (34.50 days). In 2015, the longest ATB was obtained by ‘Marli’ (70.50 days) and the shortest ATBs occurred
with ‘Centenário’ (34 days), ‘Tropical’ (35.5 days), ‘Flor da Prince’ (36.5 days), ‘Biuti’ (36.75 days) and ‘Dourado-2’ (37.75 days). Because of a winter with a greater accumulation of cold in 2015, milder temperatures (below 7.2ºC) were anticipated; these occurred on June 20 in 2015 versus July 6 in 2014, and this boosted the expectation of the ATB. Wagner Júnior et al. (2009) determined that cold has an effect on both dormancy depth and blooming speed, respectively decreasing and increasing faster with the increasing accumulation of cold units.
In general, the DF was diverse, ranging from 9 to 41 days. In both years, ‘Charme’ presented the shortest DF: 20 days in 2014 and nine days in 2015. This result demonstrated that this cultivar presented a higher cold accumulation requirement, as a greater amount of chill occurred in 2015 in relation to 2014; this presented a duration of flowering shorter and more uniform in relation to the previous year. ‘Flor da Prince’ presented the highest DF values (41 and 29 days); this demonstrated that this cultivar required a low amount of chill, and when adequately accumulated presented a more intense and uniform flowering period. However, ‘Dourado-2’, ‘Maciel’ and ‘Marli’ demonstrated less sensitivity to thermal oscillation; in other words, their flowering cycle was not altered in the face of different occurrences of cold in both years. According to Scariotto et al. (2013), staggered flowering can occur due to the lack of chill accumulation during endodormancy. These results presented a significant temporary range that was different from Souza, Alvarenga, Pio, Gonçalves, and Patto (2013) at Maria da Fé, Minas Gerais State, Brazil, varying from 20 to 41 days. A more concentrated flowering time also provides a more uniform harvest (Tomaz, Lima, Gonçalves, Rufato, & Rufato, 2010).
As for the average ATF, ‘Kampai’ obtained the shortest ATF in both years and demonstrated early flowering due to the chill requirement. Conversely, ‘Charme’ showed the longest ATF by demanding the greatest cold requirement and presenting increased sensitivity to the environment. Pereira and Mayer (2008) observed a 14- to 28-day period for ATF. Similar to Pereira, Carvalho, Biasi, and Zanette (2012), this behaviour occurs from the greatest chill requirement of the cultivar, demonstrating that the cultivars most requiring a chill other than occurs in the region can present difficulties overcoming dormancy.
Figure 2. Number of hours accumulated: a) below 7.2ºC, b) below 12ºC, and c) below 25ºC between the months of May and August for 2014 and 2015 in Lavras, Minas Gerais State, Brazil.
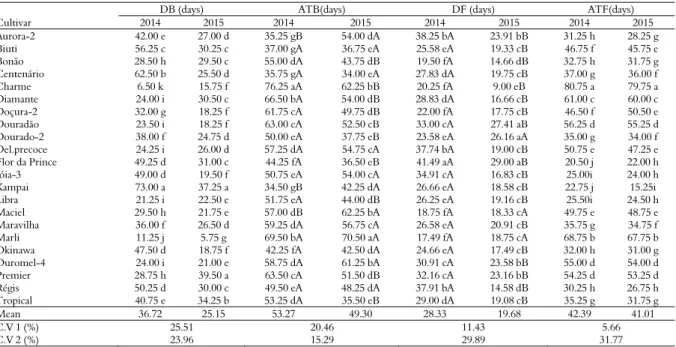
Table 1. Duration of budburst(DB) in days, average time of budburst (ATB) in days, duration of flowering (DF) in days, and average time of flowering (ATF) in days for 2014 and 2015at the experimental orchard in Lavras, Minas Gerais State, Brazil.
DB (days) ATB(days) DF (days) ATF(days)
Cultivar 2014 2015 2014 2015 2014 2015 2014 2015
Aurora-2 42.00 e 27.00 d 35.25 gB 54.00 dA 38.25 bA 23.91 bB 31.25 h 28.25 g
Biuti 56.25 c 30.25 c 37.00 gA 36.75 eA 25.58 eA 19.33 cB 46.75 f 45.75 e
Bonão 28.50 h 29.50 c 55.00 dA 43.75 dB 19.50 fA 14.66 dB 32.75 h 31.75 g
Centenário 62.50 b 25.50 d 35.75 gA 34.00 eA 27.83 dA 19.75 cB 37.00 g 36.00 f
Charme 6.50 k 15.75 f 76.25 aA 62.25 bB 20.25 fA 9.00 eB 80.75 a 79.75 a
Diamante 24.00 i 30.50 c 66.50 bA 54.00 dB 28.83 dA 16.66 cB 61.00 c 60.00 c
Doçura-2 32.00 g 18.25 f 61.75 cA 49.75 dB 22.00 fA 17.75 cB 46.50 f 50.50 e
Douradão 23.50 i 18.25 f 63.00 cA 52.50 cB 33.00 cA 27.41 aB 56.25 d 55.25 d
Dourado-2 38.00 f 24.75 d 50.00 eA 37.75 eB 23.58 eA 26.16 aA 35.00 g 34.00 f
Del.precoce 24.25 i 26.00 d 57.25 dA 54.75 cA 37.74 bA 19.00 cB 50.75 e 47.25 e
Flor da Prince 49.25 d 31.00 c 44.25 fA 36.50 eB 41.49 aA 29.00 aB 20.50 j 22.00 h
Jóia-3 49.00 d 19.50 f 50.75 eA 54.00 cA 34.91 cA 16.83 cB 25.00i 24.00 h
Kampai 73.00 a 37.25 a 34.50 gB 42.25 dA 26.66 eA 18.58 cB 22.75 j 15.25i
Libra 21.25 i 22.50 e 51.75 eA 44.00 dB 26.25 eA 19.16 cB 25.50i 24.50 h
Maciel 29.50 h 21.75 e 57.00 dB 62.25 bA 18.75 fA 18.33 cA 49.75 e 48.75 e
Maravilha 36.00 f 26.50 d 59.25 dA 56.75 cA 26.58 eA 20.91 cB 35.75 g 34.75 f
Marli 11.25 j 5.75 g 69.50 bA 70.50 aA 17.49 fA 18.75 cA 68.75 b 67.75 b
Okinawa 47.50 d 18.75 f 42.25 fA 42.50 dA 24.66 eA 17.49 cB 32.00 h 31.00 g
Ouromel-4 24.00 i 21.00 e 58.75 dA 61.25 bA 30.91 cA 23.58 bB 55.00 d 54.00 d
Premier 28.75 h 39.50 a 63.50 cA 51.50 dB 32.16 cA 23.16 bB 54.25 d 53.25 d
Régis 50.25 d 30.00 c 49.50 eA 48.25 dA 37.91 bA 14.58 dB 30.25 h 26.75 h
Tropical 40.75 e 34.25 b 53.25 dA 35.50 eB 29.00 dA 19.08 cB 35.25 g 31.75 g
Mean 36.72 25.15 53.27 49.30 28.33 19.68 42.39 41.01
C.V 1 (%) 25.51 20.46 11.43 5.66
C.V 2 (%) 23.96 15.29 29.89 31.77
*Means followed by the same capital letter in the row and small letter in the column do not differ from one another by the Scott Knott test at 5% of probability.
budburst. However, ‘Biuti’ and ‘Charme’ presented the onset of budburst before flowering. Citadin et al. (2002) studied the heritability of the need for heat for anthesis and budburst and examined whether the selection of cultivars with a high heat requirement for flowering tended to delay flowering without delaying the budburst time. Therefore, the behaviour of some cultivars that sprout before flowering is explained by the fact that these cultivars require more heat for flowering than for budburst.
The RRB was, on average, 59.53% in 2014 and 71.54% in 2015, demonstrating that there was a greater amount of chill available to the cultivars to overcome dormancy in the second year (Table 2). These values
demonstrate a good budburst rate, as other authors regard 50% as a good rate of budburst for peach plants (Raseira & Nakasu, 1998; Wagner Júnior, Bruckner, Cantín, Sánchez, & Santos, 2011). Wagner Júnior et al. (2009) studied the behaviour of peach tree cultivars and concluded that the greater chill accumulation also provides a gradual increase in budburst percentage. ‘Bonão’, ‘Libra’, ‘Maciel’ and ‘Ouromel-4’ presented greater RRB and did not drift during the years studied, thus presenting a lower response of budburst to the climatic conditions found in the region.
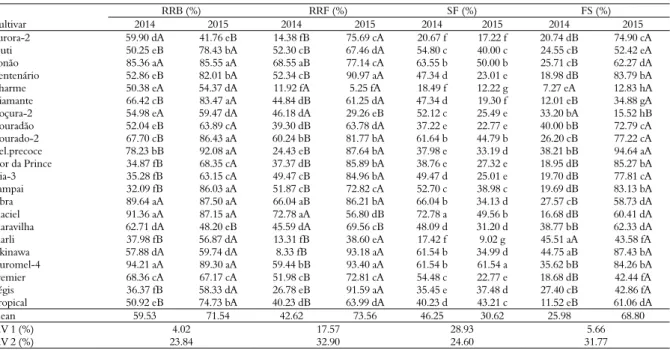
Table 2. Relative rate of budburst (RRB) in percentage, relative rate of flowering (RRF) in percentage, shoot formation (SF) in percentage and fruit set (FS)in 2014 and 2015 at the experimental orchard in Lavras, Minas Gerais State, Brazil.
RRB (%) RRF (%) SF (%) FS (%)
Cultivar 2014 2015 2014 2015 2014 2015 2014 2015
Aurora-2 59.90 dA 41.76 eB 14.38 fB 75.69 cA 20.67 f 17.22 f 20.74 dB 74.90 cA
Biuti 50.25 eB 78.43 bA 52.30 cB 67.46 dA 54.80 c 40.00 c 24.55 cB 52.42 eA
Bonão 85.36 aA 85.55 aA 68.55 aB 77.14 cA 63.55 b 50.00 b 25.71 cB 62.27 dA
Centenário 52.86 eB 82.01 bA 52.34 cB 90.97 aA 47.34 d 23.01 e 18.98 dB 83.79 bA
Charme 50.38 eA 54.37 dA 11.92 fA 5.25 fA 18.49 f 12.22 g 7.27 eA 12.83 hA
Diamante 66.42 cB 83.47 aA 44.84 dB 61.25 dA 47.34 d 19.30 f 12.01 eB 34.88 gA
Doçura-2 54.98 eA 59.47 dA 46.18 dA 29.26 eB 52.12 c 25.49 e 33.20 bA 15.52 hB
Douradão 52.04 eB 63.89 cA 39.30 dB 63.78 dA 37.22 e 22.77 e 40.00 bB 72.79 cA
Dourado-2 67.70 cB 86.43 aA 60.24 bB 81.77 bA 61.64 b 44.79 b 26.20 cB 77.22 cA
Del.precoce 78.23 bB 92.08 aA 24.43 eB 87.64 bA 37.98 e 33.19 d 38.21 bB 94.64 aA
Flor da Prince 34.87 fB 68.35 cA 37.37 dB 85.89 bA 38.76 e 27.32 e 18.95 dB 85.27 bA
Jóia-3 35.28 fB 63.15 cA 49.47 cB 84.96 bA 49.47 d 25.01 e 19.70 dB 77.81 cA
Kampai 32.09 fB 86.03 aA 51.87 cB 72.82 cA 52.70 c 38.98 c 19.69 dB 83.13 bA
Libra 89.64 aA 87.50 aA 66.04 aB 86.21 bA 66.04 b 34.13 d 27.57 cB 58.73 dA
Maciel 91.36 aA 87.15 aA 72.78 aA 56.80 dB 72.78 a 49.56 b 16.68 dB 60.41 dA
Maravilha 62.71 dA 48.20 eB 45.59 dA 69.56 cB 48.09 d 31.20 d 38.77 bB 62.33 dA
Marli 37.98 fB 56.87 dA 13.31 fB 38.60 eA 17.42 f 9.02 g 45.51 aA 43.58 fA
Okinawa 57.88 dA 59.74 dA 8.33 fB 93.18 aA 61.54 b 34.99 d 44.75 aB 87.43 bA
Ouromel-4 94.21 aA 89.30 aA 59.44 bB 93.40 aA 61.54 b 61.54 a 35.62 bB 84.26 bA
Premier 68.36 cA 67.17 cA 51.98 cB 72.81 cA 54.48 c 22.77 e 18.68 dB 42.44 fA
Régis 36.37 fB 58.33 dA 26.78 eB 91.59 aA 35.45 e 37.48 d 27.40 cB 42.86 fA
Tropical 50.92 eB 74.73 bA 40.23 dB 63.99 dA 40.23 d 43.21 c 11.52 eB 61.06 dA
Mean 59.53 71.54 42.62 73.56 46.25 30.62 25.98 68.80
C.V 1 (%) 4.02 17.57 28.93 5.66
C.V 2 (%) 23.84 32.90 24.60 31.77
*Means followed by the same capital letter in the row and small letter in the column do not differ from one another by the Scott Knott test at 5% of probability.
(18.49%) and ‘Aurora-2’ (20.67%) (Table 2). In 2015, the greatest shoot percentage was presented by ‘Ouromel-4’ (61.54%) and the lowest by ‘Marli’ (9.02%) and ‘Charme’ (12.22%) (Table 2). The percent of budburst is related to the need for chill of each cultivar (Citadin et al., 2001). The low shoot formation can also be related to other factors such as correlative inhibitions and not solely to the lack of chill (Scariotto et al., 2013), as these factors represent a good percentage of budburst. Cultivars that did not entirely reach their cold requirement, presented low budburst or did not develop shoots when they sprouted formed structures known as rosettes, which resemble a small foliated plant (Assmann et al., 2008).
‘Marli’ (45.51%) and ‘Okinawa’ (44.75%) presented the greatest FS in 2014, whereas ‘Delicioso Precoce’ (94.64%) obtained the greatest FS in 2015. ‘Charme’ achieved the lowest FS in both years (7.27% in 2014 and 12.83% in 2015) due to low RRF, thus demonstrating the increased sensitivity of the cultivar to the local environment. Locatelli, Nava, Citadin, and Pichler (2012) reported that the low fruit set index and subsequent fruit yield of ‘Granada’ was due to the sensitivity of this cultivar to high temperatures during the flowering period and onset of the fruit set. The FS in 2015 was much greater than in 2014 due to a greater homogeneity of chill during the winter period and mild temperatures from the onset of fall; this was also found by Scariotto et al. (2013).
An antagonistic relationship between the proportion of shoot formation and fruit set was
observed during the phenological studies of the cultivars. In 2014, the cultivars presented, on average, the greatest proportion of shoot formation in relation to the fruit set; this could have been caused by competition for nutrients between the sinks, thus increasing vegetative development to the detriment of reproductive structures.
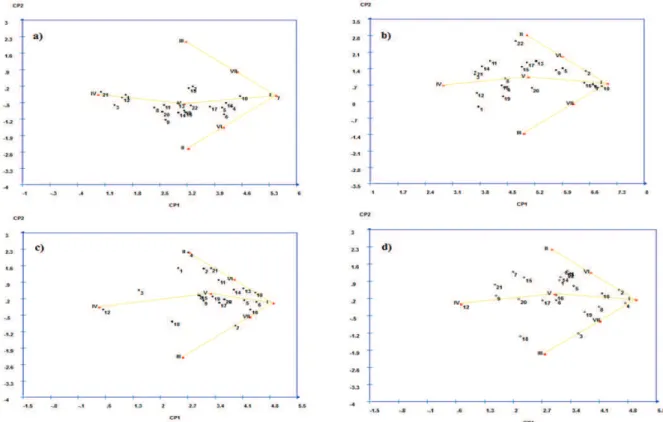
After an analysis of means, a study of stability and reproductive and vegetative adaptability of the 22 cultivars was performed by means of principal analysis components utilizing the modified centroid method, where the cultivars are classified into seven distinct classes according to the methodology by Rocha et al. (2005) and modified by Nascimento et al. (2009).
Based on the results, only two principal components sufficiently explain the evaluated variables, with proportions of 83% for SF and 76% for the RRB for the total variation. Since two eigenvalues were found to be sufficient in the representation of the total variation, the evaluation of the position of the cultivars can be performed by a two-dimensional graph (Nascimento et al., 2009).
According to the variable of the RRB, ‘Delicioso Precoce’, ‘Libra’, ‘Maciel’, ‘Ouromel-4’, and ‘Bonão’ were classified as being of high general adaptability and stability for being situated closer to ideotype I (Figure 3b), with stability ranging from 0.2546 to 0.6915. According to Rocha et al. (2005), a smaller difference between any cultivar and ideotype I leads to a smaller difference between this cultivar and the cultivar of maximum performance in all environments, thus associating general adaptability with the best performance. In addition, most of the cultivars were classified as of medium adaptability and general stability (class V), including ‘Tropical’ (0.38), ‘Douradão’ (0.37), ‘Premier’ (0.36), ‘Okinawa’ (0.35), ‘Doçura-2’ (0.33), ‘Biuti’ (0.31) and ‘Maravilha’ (0.27). ‘Dourado-2’ (0.34) and ‘Diamante’ (0.31) were classified as of median adaptability and stability to favourable environments (ideotype VI), and ‘Marli’ (0.31), ‘Régis’ (0.30) and ‘Aurora-2’ (0.21) were classified as of minimum adaptability (ideotype IV), thus demonstrating increased sensitivity to environmental control.
In Figure 3 (a and b), the classifications of the cultivars as to adaptability and stability for the traits of RRF and fruit set FS are represented by eigenvalues;
these traits show that only two principal components are sufficient to account for proportions greater than 78% for RRF and 79% for FS of the total variation. A visual analysis of majorcomponents shows that the cultivars presented heterogeneous distribution for both RRF (Figure 3c) and FE (Figure 3d) and that there are points of greater closeness to all seven centroids, thus enabling a cultivar recommendation of general adaptability or specific adaptability to an environmental subset.
According to the plot, ‘Libra’ and ‘Ouromel-4’ belong to ideotype I (maximum general adaptability) and showed greater adaptability and stability to the environment in relation to the RRF (Figure 3c). The probability associated with the classification of the cultivars was 0.36 and 0.30, respectively, a value which represents a good reliability of recommendation. However, it was observed that the distribution of most cultivars (‘Douradão’, ‘Diamante’, ‘Bonão’, ‘Biuti’, ‘Maravilha’, ‘Premier’, and ‘Kampai’) were near ideotype V (average general adaptability), all with probabilities greater than 0.37. ‘Charme’ was located in ideotype IV (minimum general adaptability), with a probability of 79.22%, and presented less stability and adaptability to the environment.
Figure 3d shows a plot scatter of the 22 cultivars on the plane formed by the two first principal components in relation to the FS. It was found that 10 cultivars were classified as of medium general adaptability (class V). Cultivars with a greater probability of belonging to this class were ‘Aurora-2’, ‘Dourado-2’, ‘Libra’, ‘Maciel’, ‘Joia-3’, ‘Tropical’, ‘Bonão’, ‘Biuti’, ‘Premier’, and ‘Régis’, all with probabilities above 0.22. ‘Diamante’ and ‘Charme’ were classified as of minimum adaptability (class IV). These cultivars received this classification because they were the most sensitive during the years studied, presenting probabilities above 0.25. ‘Ouromel-4’ was classified as of maximum general adaptability (class I), along with ‘Delicioso Precoce’ and ‘Okinawa’.
Conclusion
The cultivars ‘Bonão’, ‘Ouromel-4’, ‘Libra’, and ‘Maciel’ present greater adaptability during the vegetative phase, and ‘Ouromel-4’ and ‘Libra’ present greater adaptability and stability during the reproductive phase of peach trees in a subtropical climate.
Acknowledgements
The authors wish to thank the Conselho Nacional de Desenvolvimento Científico e Tecnológico (CNPq), and the Coordenação de Aperfeiçoamento de Pessoal de Nível Superior (CAPES) for financial support, as well as the Universidade Federal de Lavras (UFLA) for providing the structure for carrying out the study.
References
Alvarenga, A. A., Abrahão, E., Ramos, J. D., & Chalfun, N. N. J. (2002). Levantamento climático das quantidades de unidades de frio na Região de Lavras, MG. Ciência e Agrotecnologia, 26(6), 1344-1347.
Assman, A. P., Citadin, I., Locatelli, M. C., Scariot, S., Danner, M. A., & Raseira, M. C. B. (2008). Tolerância de frutos de pessegueiro a geadas. Revista Brasileira de Fruticultura, 30(4), 1030-1035.
Barbosa, W., Chagas, E. A., Pommer, C. V., & Pio, R. (2010). Advances in low-chilling peach breeding at Instituto Agronômico, São Paulo State, Brazil. Acta Horticulturae, 872(17), 147-150.
Chagas, E. A., Pio, R., Bettiol Neto, J. E., Sobieraiski, G. R., Campo Dall’Orto, F. A., & Signorini, G. (2008). Enraizamento de estacas lenhosas de pessegueiro e clones de umezeiros submetidos à aplicação de AIB.
Ciência e Agrotecnologia, 32(3), 986-991.
Citadin, I., Raseira, M. C. B., Herter, F. G., & Silva, J. B. (2001). Heat requirement for blooming and leafing in peach. HortScience, 36(2), 305-307.
Citadin, I., Raseira, M. C. B., Herter, F. G., & Silveira, C. A. P. (2002). Avaliação a necessidade de frio em pessegueiro. Revista Brasileira de Fruticultura, 24(3), 703-706.
Citadin, I., Scariotto, S., Sachet, M. R. S., Rosa, F. J., Raseira, M. C. B., & Wagner Junior, A. (2014). Adaptability and stability of fruit set and production of peach trees in a subtropical climate. Scientia Agricola,
71(2), 133-138.
Cruz, C. D. (2006). Programa Genes: estatística experimental e matrizes. Viçosa, MG: UFV.
Cruz, C. D., & Carneiro, P. C. S. (2012). Modelos biométricos aplicados ao melhoramento genético (Vol. 1, 4a ed.). Viçosa, MG: UFV.
Guo, L., Dai, J., & Wang, M. (2015). Responses of spring phenology in temperate zone trees to climate warming: a case study of apricot flowering in China.
Agricultural and Forest Meteorology, 201(15), 1-7. Lin, C. S., & Binns, M. R. (1988). A method for analyzing
cultivar x location x years experiments: a new stability parameter. Theoretical and Applied Genetics, 76(3), 425-430.
Locatelli, M. C., Nava, G. A., Citadin, I., & Pichler, M. (2012). Fenologia e frutificação do pessegueiro ‘Granada’ sob diferentes práticas de manejo. Revista Ceres, 59(5), 684-688.
Maguylo, K., Cook, N. C., & Theron, K. (2014). Primigenic and positional dominance among reproductive buds in shoots of two apple (Malus domestica (Borkh.)) cultivars in a warmer and cooler site. Trees, 28(2), 625-634.
Nascimento, M., Cruz, C. D., Campana, A. C. M., Tomaz, R. S., Salgado, C. C., & Ferreira, R. D. P. (2009). Alteração no método centróide de avaliação da adaptabilidade genotípica. Pesquisa Agropecuária Brasileira, 44(3), 263-269.
Nava, G. A., Marodin, G. A. B., & Santos, R. P. (2009). Reprodução do pessegueiro: efeito genético, ambiental e de manejo das plantas. Revista Brasileira de Fruticultura,
31(4), 1218-1233.
Pereira, F. M., & Mayer, N. A. (2008). Fenologia e produção de gemas em cultivares e seleções de pessegueiro na região de Jaboticabal-SP. Revista Brasileira de Fruticultura, 30(1), 43-47.
Pereira, G. P., de Carvalho, R. I. N., Biasi, L. A., & Zanette, F. (2012). Dinâmica da dormência de gemas de pessegueiro, ameixeira e caquizeiro na Fazenda Rio Grande, PR.
Revista Brasileira de Ciências Agrárias, 7(supl.), 820-825. Putti, G. L., Petri, J. L., & Mendez, M. E. (2003). Efeito da
intensidade do frio no tempo e percentagem de gemas brotadas em macieira. Revista Brasileira de Fruticultura,
25(2), 199-202.
Raseira, M. C., & Nakasu, B. H. (1998). Cultivares: descrição e recomendação. In M. C. B. Raseira, & C. A. Medeiros (Eds.), A cultura do pessegueiro (p. 29-97). Brasília, DF: Embrapa Informação Tecnológica.
de adaptabilidade ao ambiente de clones de Eucalyptus grandis. Ciência Florestal, 15(2), 255-266.
Scariotto, S., Citadin, I., Raseira, M. C. B., Sachet, M. R., & Penso, G. A. (2013). Adaptability and stability of 34 peach genotypes for leafing under Brazilian subtropical conditions. Scientia Horticulturae, 155(1), 111-117.
Silva, W. C. J., & Duarte, J. B. (2006). Métodos estatísticos para estudo de adaptabilidade e estabilidade fenotípica em soja. Pesquisa Agropecuária Brasileira, 41(1), 23-30.
Souza, F. B. M., Alvarenga, A. A., Pio, R., Gonçalves, E. D., & Patto, L. S. (2013). Produção e qualidade dos frutos de cultivares e seleções de pessegueiro na Serra da Mantiqueira. Bragantia, 72(2), 133-139.
Souza, F. B. M., Pio, R.,Tadeu, M. H., Zambon, C. R., & Reighard, G. L. (2017). Boric acid in germination of pollen grains and fruit set of peach cultivars in subtropical region. Revista Ciência Agronômica, 48(3), 396-500. Tomaz, Z. F. P., Lima, C. S. M., Gonçalves, M. A., Rufato,
L., & Rufato, A. R. (2010). Crescimento vegetativo, floração e frutificação efetiva do pessegueiro 'Jubileu' submetido a diferentes comprimentos de
interenxertos. Pesquisa Agropecuária Brasileira, 45(9), 973-979.
Wagner Júnior, A., Bruckner, C. H., Salomão, L. C. C., Pimentel, L. D., Silva, J. O. D. C., & Santos, C. E. M. D. (2009). Seleção de cultivares de pessegueiro F1 com baixa necessidade de frio hibernal. Revista Brasileira de Fruticultura, 31(4), 1122-1128.
Wagner Júnior, A., Bruckner, C. H., Cantín, C. M., Sánchez, M. A. M., & Santos, C. E. M. (2011). Seleção de progênies e genitores de pessegueiro com base nas características dos frutos. Revista Brasileira de Fruticultura, 33(1), 170-179.
Received on July29, 2016. Accepted on October4, 2016.