Master Thesis
Firm age-at-IPO and the long-term
performance of Internet companies
Thomas Strottner
Double Degree Program
M.Sc. International Business - Strategy and Innovation & M.Sc. Management
Maastricht University School of Business and Economics
Universidade Nova de Lisboa School of Business and Economics
[email protected] [email protected]
Student ID: i6034351 Student ID: 25671
Supervisor: Prof. Dr. Martin Carree Supervisor: Dr. Melissa Prado
Abstract
Since the burst of the dot-com bubble in 2000, there has been an ongoing debate around the long-term viability of Internet-specific business models. Quick IPOs with lacking profitability and high failure rates have put many investors off in the aftermath of the crisis. In this thesis, I therefore analyze how Internet companies’ age-at-IPO relates to long-term stock performance. The sample consists of 116 Internet firms that went public on NASDAQ between 2003 and 2010. As predicted, I find that there is a significant U-shaped relationship between age-at-IPO and 5-year post-IPO performance. This implies that, on average, very young and old firms are most successful in the long run. The rationale for this finding is that Internet companies with quick IPOs have outstanding business models and can gain first-mover advantages, whereas older companies benefit from learning effects and already maintained a competitive advantage – even without public funding. Severe underperformance is mainly found for medium-aged Internet companies going public (age of 6 to 10 years). Furthermore, this thesis provides evidence that profitable Internet firms that have an IPO perform better in the long run than their unprofitable counterparts. Still, in contrast to most academic research, I do not find a significant relationship between profitability in the year of the IPO and long-term firm survival. A possible explanation is that most studies include the burst of the dot-com bubble and thus contain a large number of quick IPOs with high failure rates, whereas this thesis focuses on Internet IPOs in the more stable years 2003 to 2010. The findings underline the importance of first-mover advantages, especially in
winner-takes-all Internet markets. Furthermore, they emphasize benefits from learning effects and the solid market position of older IPO companies. Overall, investors should carefully assess the IPO’s strategic implications and treat hot markets with caution – especially in the Internet sector.
Table of contents
List of abbreviations ... iii
List of figures and tables ... iv
1. Introduction ... 1
2. Theoretical background ... 4
3. Hypotheses development ... 10
3.1 Age-at-IPO and 5-year post-IPO stock performance ... 10
3.2 Age-at-IPO and 5-year post-IPO survival ... 13
3.3 Profitability in the IPO year and post-IPO performance ... 14
4. Data and methodology ... 15
4.1 Classification of Internet companies ... 16
4.2 Sample and data collection ... 18
4.3 Dependent variables ... 19
4.4 Explanatory variables ... 20
4.5 Control variables ... 23
4.6 Empirical approach ... 23
5. Results ... 24
5.1 Descriptive statistics ... 25
5.2 Linear regression ... 27
5.3 Binary logistic regression ... 31
5.4 Quintile analysis ... 34
5.5 Robustness tests ... 38
6. Discussion... 40
6.1 Theoretical contributions ... 40
6.2 Practical implications ... 42
6.3 Limitations and future research ... 43
6.4 Conclusion ... 45
References ... 46
Appendix ... 50
Appendix A: Total number of (Internet) IPOs in the U.S. from 1992 to 2013 ... 50
Appendix B: Sample ... 51
Appendix C: NASDAQ Composite 5-year return (monthly) ... 52
Appendix D: Scatterplot of age-at-IPO vs. excess log returns ... 53
Appendix E: Scatterplot of age-at-IPO logged vs. excess log returns ... 53
Appendix F: ANOVA outputs for age-at-IPO quintiles ... 54
List of abbreviations
AMEX American Stock Exchange
ANOVA Analysis of variance
df Degrees of freedom
IPO Initial Public Offering
Log Logarithm / Logarithmic
ln Natural logarithm
Max. Maximum
Min. Minimum
NASDAQ National Association of Securities Dealers Automated Quotations
NYSE New York Stock Exchange
OLS Ordinary least squares
SD Standard deviation
SE Standard error
SEC Securities and Exchange Commission
SIC Standard Industry Classification
U.S. United States
VC Venture Capital
List of figures and tables
Figure 1: Relationship between age-at-IPO and post-IPO performance from literature ... 8
Figure 2: Number of Internet IPOs per year, 1992-2013 ... 9
Figure 3: Distribution of the dataset in terms of age-at-IPO ... 21
Figure 4: U-shaped relationship between age-at-IPO and excess returns ... 29
Figure 5: Excess (log) return per quintile of age-at-IPO ... 36
Table 1: Sample distribution in simplified industry segments... 17
Table 2: Age-at-IPO quintiles ... 22
Table 3: Summary statistics ... 25
Table 4: Correlation matrix ... 26
Table 5: Results of linear regression models ... 27
Table 6: Expected excess log returns from regression model 4A ... 30
Table 7: Results of binary logistic regression models ... 32
Table 8: Long-term performance of age-at-IPO quintiles ... 35
1. Introduction
Since the late 1990s, the Internet has been a main driver of new venture formation and worldwide economic development (Chang, 2004; Zacharakis, Shepherd & Coombs, 2003). As many Internet companies1 offer a lot of growth potential, they attract large amounts of
investments (Johnston & Madura, 2002; Zarzecki, 2010) and can ultimately achieve an initial public offering (IPO). Sometimes firms achieve an IPO despite being very young, not profitable and thus, not yet financially sustainable. The phenomenon of companies going public before achieving profitability exists especially in the Internet industry and has therefore been increasingly observed during the last two decades (Jain, Jayaraman & Kini, 2008; Lashinsky, 2006).
The IPO is generally seen as an early-performance measure for startups, especially as pre-IPO performance metrics are seldom available (Chang, 2004). But even though going public marks a milestone success for Internet ventures, it is not clear from academic literature what the relationship between firm age-at-IPO2 and long-term stock performance are. On the one hand, Chang (2004) shows that promising startups with credibility through venture capital (VC) financing and strategic alliances attain an IPO more quickly. A quick IPO might therefore indicate a stronger business model. Following this line of argumentation implies that companies with great VC investments and low age-at-IPO have more future potential and will, on average, perform better in the long run. Furthermore, capital is needed in order to grow and to achieve long-term success (Bessler & Seim, 2012). Thus, receiving large cash injections from the equity market and using the money for further growth could also lead to a low age-at-IPO indicating better long-term performance for Internet ventures.
1Internet companies are defined in section 4.1 of this report.
2(Firm) age-at-IPO indicates the time that it takes a company from its date of legal incorporation to the
On the other hand, founders and early-investors of firms are incentivized to get cash for their equity as quickly as possible (Kim & Heshmati, 2010). When the business model of the company is less promising and shows significant weaknesses to these parties with internal knowledge, the motivation for a fast payout is even greater. Thus, a fast IPO might actually signal weak long-term potential rather than a bright future for the firm. Additionally, firm age-at-IPO highly reflects the general market conditions where going public is more likely in
“hot markets” (Plotnicki & Szyszka, 2014, p. 49). The burst of the dot-com bubble in 2000 has highlighted that fast IPOs – especially in the Internet industry – are often the consequence of tremendous overvaluation (Chang 2004; Jain et al., 2008; Zook, 2008).
Older companies in contrast benefit from learning effects and have proven financial viability in the market (Jain et al., 2008; van der Goot, van Giersbergen & Botman, 2009). Wagner and Cockburn (2010) find that older companies have a lower risk to fail. Overall, this might indicate that a higher firm age-at-IPO is associated with better long-run performance.
Following the above, the research question that this thesis aims to answer reads as follows:
What is the relationship between firm age-at-IPO and the long-term
performance of Internet companies?
Furthermore, the overall research question is divided into three sub-questions.
1) What is the relationship between firm age-at-IPO and the 5-year post-IPO stock
performance of Internet companies?
2) What is the relationship between firm age-at-IPO and 5-year post-IPO survival of
Internet companies?
3) What is the impact of profitability in the IPO-year on the long-term performance of
In order to answer the above questions, a sample of 116 Internet companies that had an IPO on the NASDAQ stock exchange between 2003 and 2010 has been compiled and analyzed. The data was mainly collected from Datastream and Zephyr, two major databases providing general company and IPO-specific data. For each company in the sample, age-at-IPO has been measured as the months that passed from the date of legal incorporation until the IPO-date. To analyze the companies’ performance, 5-year post-IPO excess returns have been calculated for each stock. I use the NASDAQ Composite Index3 as the benchmark portfolio
to calculate excess return. Besides excess returns, I employ 5-year post-IPO firm survival as a dependent variable. Other variables that have been retrieved for each Internet firm in the sample are profitability, revenues and number of employees in the IPO year.
This thesis consists of five parts that altogether aim at providing the reader with a coherent picture on the topic and a substantiated answer to the research question. First, I provide further theoretical background on Internet IPOs, company age-at-IPO, and the association with long-term performance and firm survival. Second, I develop several concrete, testable
hypotheses on the relationship between Internet firms’ age-at-IPO and the 5-year past-IPO performance based on insights from existing literature. Third, the final sample and the methodology of this study are explained. Fourth, I present the results of the statistical data analysis, which mainly consists of multivariate regression models. The last section concludes this thesis with a discussion on the final results, including theoretical contributions, managerial implications, limitations and suggestions for future research.
3 The NASDAQ Composite Index is the market capitalization-weighted index of approximately 3,000
2. Theoretical background
Ritter (1991) shows that the long-term performance of public offerings is heavily industry-dependent. Also, Ritter (1991, p. 4) illustrates that IPO underperformance is mainly
“concentrated among relatively young growth companies”, particularly highlighting computer and data processing companies. In line with Ritter’s findings on industry -dependence, Clark (2002) reports that the relationship between age-at-IPO and aftermarket returns is significantly different for a sample of technology and non-technology firms. The author shows that young technology firms perform better, whereas for non-technology companies higher age-at-IPO is correlated with higher post-IPO stock performance (Clark, 2002). It can be assumed that the findings are even more distinct for listed Internet firms in particular as they usually attract extremely large early-stage investments and have even higher growth prospects than technology firms in general (Demers & Lewellen, 2003).
capitalists carefully select their investments, it can be argued that the heavily funded, fast-IPO firms have better business models in general. Therefore, quick-fast-IPO Internet stocks seem to be more likely to show greater performance in the long run. Banerjee, Güçbilmez, & Pawlina (2016) further argue that it is optimal for companies with high growth opportunities to go public as early as possible. According to Clark (2002, p. 385), “holding all else equal,
the better a firm’s idea, product or business model, the greater the opportunity cost of delay,
and the earlier the firm will go public”. He further argues that the low average age-at-IPO during the 1990s might thus be an indication for an era of “unusually promising firms” (Clark, 2002, p. 385).
The general view that the IPO event by itself denotes a success, that capital is needed for growth and that investors selected the best businesses for an IPO may lead to the assumption: The faster the IPO, the better the company and the more successful it will be in the long run.
Even though it is intuitive, there are also several arguments opposing this assumption.
Jain et al. (2008) show that VC-financing has a negative effect on the likelihood of post-IPO profitability.4 These findings indicate that there might be also negative implications from heavy early-stage funding for growth with regards to the long-term development of Internet firms. The crisis of 2000 serves as an illustrative example. Not only were Internet firms that went public before the burst of the dot-com bubble much younger than in previous decades (Clark, 2002), but also the percentage of unprofitable firms having an IPO rose significantly in the late 20th century (Doffou, 2014; Jain et al., 2008). This growing tendency to have a fast IPO “on the basis of a promise of profitability rather than actual profitability” can mainly be attributed to an increase in the percentage of technology companies going public, especially
4 The result from Jain et al. (2008) might be due to the fact that the authors studied a sample from 1996 to 2000,
Internet firms (Jain et al., 2008, p. 166). Rajgopal, Venkatachalam and Kotha (2000) argue that traditional accounting rules do not apply for the valuation of Internet businesses. The authors indicate that for these firms, significant market valuations usually coexist with negative accounting earnings (Rajgopal et al., 2000)5. Ritter and Welch (2002) show that the percentage of unprofitable firms going public rose from 19% in the 1980s to 37% during 1995-1998. Schultz and Zaman (2001) even find that only 8.72% of the Internet firms that went public between January 1999 and March 2000 were profitable in the quarter prior to the IPO. Yet this phenomenon is not specific to the dot-com bust as just a few years later the trend of being unprofitable at IPO accelerated again (Jain et al., 2008; Lashinsky, 2006). Despite enjoying the early success of going public, unprofitable, young companies often show disappointing long-term performance after the hyped IPO (Jain et al., 2008). This is in line with Peristiani and Hong (2004) who find that pre-IPO profitability serves as a good predictor for post-IPO survival. Consequently, many of the hyped young and unprofitable Internet companies going public are likely to get into financial difficulties, as the burst of the dot-com bubble has illustrated.
The level of IPO underpricing is often used as a proxy for firm risk, with higher IPO underpricing indicating greater risk (Engelen & van Essen, 2010; Loughran & Ritter, 2004). Engelen and van Essen (2010) find additional evidence to confirm the findings of Loughran and Ritter (2004) that younger IPOs usually come with greater underpricing due to the high level of uncertainty regarding future returns. Thus, this serves as an indication that older firms, which have a longer history and more available accounting information, are less risky and more stable regarding their long-term performance (Engelen & van Essen, 2010; van der
5 In contrast to Rajgopal et al. (2000), Bhattacharya, Demers and Joos (2010) find that accounting information is
Goot, van Giersbergen & Botman, 2009). In line with this, previous studies find that going public at a later stage might be ideal because the pre-IPO learning process is very important for companies as it may reduce the chance of making “costly mistakes” (Clark, 2002, p. 385). In accordance with the previous discussion, research on the relationship between age-at-IPO and post-IPO performance shows divergent results. Wagner and Cockburn (2010) find that older companies perform better since they have a lower risk of failure. The authors show that the chance of firm survival increases with an additional year of pre-IPO existence by roughly 3% (Wagner & Cockburn, 2010). Ritter (1991, p. 20) also analyzes the long-run performance of IPOs and finds a significant positive “monotone relation” between firm age-at-IPO and aftermarket performance. In line with the results from Ritter (1991), Clark (2002) finds that overall, there is a positive relationship between age-at-IPO and post-IPO performance, indicating that, on average, older firms show better 3-year post-IPO stock returns.
Nevertheless, when dividing the sample into non-technology and technology firms, results diverge in Clark’s study. For non-technology firms, the pattern of higher age-at-IPO anticipating better performance is even more significant, whereas for the technology firms the opposite relationship occurs and younger firms perform significantly better (Clark, 2002). More recently, Andriansyah, and Messinis (2016) also find evidence for a negative association between firm age and financial post-IPO performance, especially with regards to profit margin. Banerjee, Güçbilmez, & Pawlina (2016) further show that young first-mover companies grant higher underpricing at IPO and have stronger operating performance in the long run compared to their older counterparts.
Figure 1 below summarizes the major findings from past academic literature regarding the relationship between age-at-IPO and post-IPO performance.
Figure 1: Relationship between age-at-IPO and post-IPO performance from literature
This thesis makes the research on the relationship between age-at-IPO and post-IPO performance not only more specific by focusing on Internet companies, but also analyzes 5-year post-IPO performance and thus has a significant long-term focus. Ritter (1991) studies the long-run performance of IPOs by investigating only 3-year post-IPO performance. He shows that the third year leads to the overall significant underperformance of IPOs, whereas the first two years do not show significant results. Also, Ritter (1991, p. 5) presents evidence from previous research that suggests “positiveperformance in the fifth year” after the public offering. Therefore, investigating five years can add additional insights when analyzing the long-term performance of tech-IPOs.
Concerning the time range of Internet IPOs, Bessler and Seim (2012, p. 216) argue to study a period from 1996 to 2010 as this includes two “IPO waves and stock market cycles”. Still, the authors present empirical evidence for the existence of major differences between the “new
economy period”, which describes the years 1996 to 2003,and the following period (Bessler Age-at-IPO
P
o
st
-I
P
O
p
er
fo
rm
a
n
ce
Ritter, 1991
Clark, 2002 (full sample) van der Goot et al., 2009 Wagner & Cockburn, 2010
Andriansyah & Messinis, 2016 Banerjee et al., 2016
& Seim, 2012, p. 231). To illustrate these differences, figure 2 shows the total number of Internet IPOs in the U.S. per year for the time period from 1992 to 2013 (data source: Ritter, 2016).6
Figure 2: Number of Internet IPOs per year, 1992-2013
The chart clearly shows that the years 1998 to 2000 (highlighted in the figure) are not representative with a total number of 460 Internet IPOs – 153.33 per year on average. Between 2003 and 2010, in contrast, there were 14.5 Internet IPOs per year on average.Also, due to the hype from 1998 to 2000, dot-com IPOs happened extremely fast and companies were very young in this period (Zacharakis et al., 2003). Additionally, the percentage of unprofitable companies that went public based on uncertain growth expectations and the accompanying high failure rate were much more significant in the years of the dot-com crisis (Jain et al., 2008; Lashinsky, 2006).
Because of these major differences, I exclude these years from the analysis, as this would
6 Appendix A shows an overview of the annual number of U.S. IPOs from 1992 to 2013 across industries and
highlights Internet IPOs for comparison. It becomes clear that the proportion of Internet companies going public was much higher in the years of the dot-com bubble (1998-2000) and fell significantly afterwards.
0 50 100 150 200 250 300
Nu
m
b
er
o
f
In
ter
n
et
IP
give a distorted picture on the association between Internet companies’ age-at-IPO and post-IPO performance. Not only the years until the burst of the dot-com bubble in 2000 are excluded, but also the two following years 2001 and 2002, since the crisis aftermath was highly affected by investor restraint and general skepticism towards Internet ventures (Bessler & Seim, 2012). Furthermore, the Internet sector and many business models around it were still pre-mature and investor understanding was often not well developed (Zook, 2008). Starting in 2003 therefore gives a more representative sample to analyze the research question at hand.
Overall, the IPO of a venture constitutes an important strategic move (Gill & Walz, 2016) and lays the foundation for following decisions and future financial performance. Still, there is a research gap in the academic literature on the relationship between age-at-IPO and the long-term performance of Internet companies. This thesis aims at closing that research gap.
3. Hypotheses development
In this section, I will develop testable hypotheses in order to answer the research question with substantiated evidence. The hypotheses are based on arguments from existing academic literature that are briefly summarized and related to the more specific context of Internet companies.
3.1 Age-at-IPO and 5-year post-IPO stock performance
As I have shown in section 2, the findings from academic literature on the relationship between age-at-IPO and long-term performance diverge significantly.
Clark (2002) is one major reason why older firms perform better on average. Also, older companies have already shown that they can survive in the market and that they have a viable business model. Current examples from the Internet sector are Airbnb, Uber, and Spotify – three companies that have market leadership and already went through several rounds of large-scale VC-funding (Basulto, 2015; Braithwaite, 2016). Still, it seems like they are waiting for the strategically optimal timing for their IPO in order to avoid costly mistakes. For example, in the case of Uber, there are still legal issues in some countries with regards to
the firm’s service offering. Clarifying these elements prior to an IPO will increase certainty
can be assumed that these are even more prominent in the Internet sector that is often associated with so-called winner-takes-all (WTA) markets (Eisenmann, 2006; Noe & Parker, 2005). In WTA markets, network effects and first-mover advantages often leave one company with a monopoly position, as observed e.g. in the search engine market. Thus, there is also evidence to argue for young companies having better financial performance in the long run after an IPO.
Internet firms with a medium age-at-IPO may likely stand for the phenomenon of making the decision to go public depend more on general market conditions than on internal strategic choices. In other words, they might represent the willingness of investors to maximize returns
during “hot market conditions” (Plotnicki & Szyszka, 2014, p. 49). Wagner and Cockburn (2010) find that companies going public in phases of enormous market valuations in the high-tech sector have significantly lower long-term performance and a higher chance of failure. In general, young Internet IPO companies perform very well due to their high-potential business models, first-mover advantages and investment capacities for growth. Companies with high age-at-IPO perform very well on average due to their proven business models and the already existing competitive advantage. Medium-aged companies are sometimes “stuck in
the middle” and tend to go public mainly based on the general market conditions and pressure from investors. This line of argumentation goes well with Kim & Heshmati (2010) who do not find a significant linear association between age-at-IPO and post-IPO performance. Following the above, I hypothesize:
H1: The relationship between Internet companies’ age-at-IPO and the 5-year post-IPO stock
performance is U-shaped. On average, Internet companies with low and high age-at-IPO
3.2 Age-at-IPO and 5-year post-IPO survival
As shown before, Internet companies stand for high growth prospects and quick IPOs. Yet, they also are noted for higher risk and great failures as represented mainly by the burst of the dot-com bubble in April 2000 (Zook, 2008). Therefore, I do not only analyze long-term performance based on 5-year stock returns, but also on post-IPO firm survival. In case that a company was delisted due to negative reasons (bankruptcy or ceased operations), I will use the term exit to indicate non-survival (Hensler et al., 1997; Park & Steensma, 2012)7.
Ritter (1991) explains that initial returns8 are higher for young IPO-firms due to the higher risk that they inhibit. Other authors validate the findings from Ritter and show a significant negative relationship between firm age and IPO underpricing (Engelen & van Essen, 2010; Loughran & Ritter, 2004). Age-at-IPO therefore constitutes a viable “proxy for risk” (Ritter, 1991, p. 20). Similarly, Johnston and Madura (2002) find that initial returns are higher for Internet companies than for non-Internet IPOs. The authors show that Internet IPOs involve higher risk and that underwriters therefore could be “forced to allow for additional
underpricing at the time of issue” (Johnston & Madura, 2002, p. 526). This goes in line with
Ritter’s explanation and underlines the high risk of fast Internet IPOs more specifically.
Despite positive initial returns, the young firms in Ritter’s sample show not only worse long -term stock performance, but also a much higher bankruptcy rate. Clark (2002) describes similar findings. Even though Clark (2002) shows that young technology firms perform better than their older counterparts on average, his results also indicate higher distressed delisting rates for young companies. In particular, the author presents significant evidence that young tech-companies are “more likely to suffer extreme financial difficulty” (Clark, 2002, p. 386).
7 The only reasons for delisting that do not indicate failures are mergers and moving to another exchange, e.g.
from NASDAQ to NYSE or to AMEX (Hensler et al., 1997).
Other authors also find that increasing firm age lowers the risk of bankruptcy after a public offering (Hensler, Rutherford & Springer, 1997). Hensler et al. (1997) further indicate that the chance of survival is reduced significantly if the respective company is in the computer and data industry.
The reason for the lower risk of older firms is twofold. First, older companies are more steady and mature. Thus, they inhibit less uncertainty about the future performance (van der Goot et al., 2009). Second, with a longer history, managers of more mature businesses can easily reduce information asymmetry before the IPO (van der Goot et al., 2009), which is highly important from an investor perspective.
Following the evidence from existing literature on the relationship between age-at-IPO and post-IPO firm survival for companies in general and for technology firms in particular, I hypothesize the following:
H2: There is a positive relationship between age-at-IPO and 5-year post-IPO survival for
Internet companies.
3.3 Profitability in the IPO year and post-IPO performance
Jain et al. (2008) state that there is a general trend for companies to go public without having achieved profitability. The authors attribute this tendency to have an IPO “on the basis of a promise of profitability” mainly to the growing number of technology firms going public (Jain et al., 2008, p. 166). Especially Internet companies in WTA markets are often valued based on growth prospects and not on the basis of existing positive cash flows (Doffou, 2014; Lashinsky, 2006). Nonetheless, profitability serves as an important indicator of the long-term viability and financial performance of a business (Jain et al., 2008). Therefore, I hypothesize:
H3: There is a positive relationship between profitability in the year of the IPO and the
Overall, investors often underestimate the risk of unprofitability at IPO, overestimate the expected growth potential and many high-risk Internet ventures are doomed to fail (Jain et al., 2008; Peristiani & Hong, 2004). According to Peristiani & Hong (2004, p. 1) pre-issue profitability is highly correlated with aftermarket firm survival. As this holds true for firms in general, I assume that profitability in the IPO-year is highly relevant for higher-risk Internet ventures. Consequently, I hypothesize that profitable Internet firms going public are significantly more likely to survive than those with negative net income.
H4: There is a positive relationship between Internet firm profitability in the IPO year and
the likelihood of 5-year post-IPO survival.
Furthermore, the relationship between age-at-IPO and post-IPO firm survival, as predicted in hypothesis H2, is likely to be impacted by the profitability in the year of the IPO. Very young Internet companies that are already profitable might be more likely to survive post-IPO than young firms that are not profitable. Therefore, I hypothesize that a moderation effect of profitability on this relationship exists.
H5: Profitability in the IPO year has a moderating effect on the relationship between
age-at-IPO and 5-year post-age-at-IPO survival of Internet companies, with greater profitability
decreasing the strength of this relationship.
4. Data and methodology
introduced and explained. In section 4.5, I will introduce the control variables used for this study. In the last section of this part, I describe the empirical approach of this thesis.
4.1 Classification of Internet companies
The unit of analysis in this study is Internet companies. Even though the term is widely used, Zook (2008) recognizes that it cannot be applied only to one specific business model or sector. Therefore, Zook (2008, p. 6) broadly describes Internet companies as “fast-growing
companies which use the Internet as an integral part of their business model”. Hand (2000) also uses a general description and simply investigates a set of firms that would not have been established without the existence of the Internet. For the purpose of this thesis, I define an Internet company as a firm that receives more than 50% of its revenues due to the existence of the Internet (Bhattacharya et al., 2010; Demers & Lewellen, 2003). In case of doubt, I further apply the broader definitions by Zook (2010) and Hand (2000).
Since there is no Standard Industrial Classification (SIC) code for Internet companies (Bhattacharya et al., 2010; Demers & Lewellen, 2003), I have consulted different sources in order to come up with a sound dataset. First, I used various keywords like “Internet”, “dot
-com”, “online” and “e-commerce” on siccodes.com to retrieve a list of SIC codes that include Internet-specific companies. Some of the major code categories are 737 (Computer programming, data Processing, and other computer related services), 4812 (Radiotelephone communications), 4899 (Communication services – not elsewhere classified), 8999 (Services
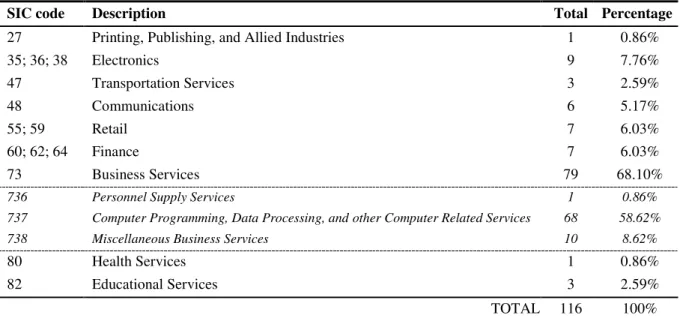
I had doubt on matching the definitions for Internet companies by Demers and Lewellen (2003) and Zook (2008). For many companies such as Alphabet (formerly Google), it was clear that they belong to the dataset of Internet companies. When I was unsure about the classification based on company name and SIC code, I went to the short business profile on nasdaq.com to judge whether could be defined as Internet companies or not. Here, I applied the broad definitions stated earlier. If there were further doubts, I searched for information on the company website and reviewed SEC filings. This procedure does not only guarantee for a highly relevant dataset of Internet companies, but also gave me a better understanding of the sample. Table 1 shows an overview of the sample distribution in terms of simplified industry segments. Most Internet companies have the SIC code 737 (Computer Programming, Data Processing, and Other Computer Related Services), accounting for 58.62% of the final sample.
Table 1: Sample distribution in simplified industry segments
SIC code Description Total Percentage
27 Printing, Publishing, and Allied Industries 1 0.86%
35; 36; 38 Electronics 9 7.76%
47 Transportation Services 3 2.59%
48 Communications 6 5.17%
55; 59 Retail 7 6.03%
60; 62; 64 Finance 7 6.03%
73 Business Services 79 68.10%
736 Personnel Supply Services 1 0.86%
737 Computer Programming, Data Processing, and other Computer Related Services 68 58.62%
738 Miscellaneous Business Services 10 8.62%
80 Health Services 1 0.86%
82 Educational Services 3 2.59%
TOTAL 116 100%
considered an Internet company. The firm profile on nasdaq.com includes the following:
“… We seek to offer compelling value to our customers through an innovative use of technology, a broad selection of customized printed products, low pricing and personalized customer service. Through our use of proprietary Internet-based graphic design software, 16 localized websites, proprietary order receiving and processing technologies and advanced computer integrated printing facilities, we offer a meaningful economic advantage relative to traditional graphic design and printing methods. …”
The company’s strategy of providing services via Internet-based software, which is key to its value proposition and brings the majority of revenues, clearly makes it an Internet firm.
4.2 Sample and data collection
The final sample consists of 116 Internet companies (as defined and selected in the previous section) with IPOs on NASDAQ between 2003 and 2010.9 NASDAQ was chosen as the stock exchange for the sample since it hosts the vast majority of technology-IPOs worldwide (Clark, 2002) and because data on stocks, as well as on a benchmark index can be obtained in a reliable manner. The data for the final sample was retrieved from Datastream and Zephyr, which are two major business and IPO databases. Further information was collected from the listing information on nasdaq.com, from the technology database crunchbase.com and from SEC filings like annual reports.
Most importantly, the final dataset includes SIC code, companies’ date of legal incorporation, IPO date, and total revenues, net income and number of employees in the IPO year. It also contains monthly closing stock prices for the five years after going public. From all this information, age-at-IPO and 5-year post-IPO stock returns are calculated.
In the 5-year post-IPO performance analysis, it occurs that companies get delisted from the NASDAQ stock exchange. A delisting might occur for different reasons. Some of these reasons, like bankruptcy, denote failure events, whereas others such as mergers can have
different implications (Hensler et al., 1997). Out of the 116 Internet companies going public on NASDAQ between 2003 and 2010, 34 were delisted in the five years after the IPO. From these 34 companies, 24 were delisted due to mergers or moving to the NYSE. The remaining 10 companies were delisted for negative reasons, which are bankruptcy and ceased operations (Hensler et al., 1997). All the 34 companies that were delisted are still included in the sample. The stock price return from the month of listing until delisting is then carried forward to the end of the 60th month (end of the 5-year period) and used for the subsequent analysis.
4.3 Dependent variables
Excess log return
As suggested by Ritter (1991), I use stock returns as a proxy for the 5-year post-IPO performance. In particular, I employ the variable Excess log return as a dependent variable in linear regression models. Therefore, I first calculate logarithmic stock returns after 60 months, 𝑟𝑖,𝑡=60, for each individual stock in the sample as shown in equation 1.
𝑟𝑖,𝑡=60= ln (𝑝𝑝𝑖,𝑡=60
𝑖,𝑡=0) − 1
(1)
I use logarithmic returns in order to obtain a (close to) normally distributed dataset since general holding period returns have large outliers (e.g. maximum of 937% return for Baidu Inc.). These outliers are only found for positive returns since the minimum possible holding period return is -100%. The use of the natural logarithm basically treats returns as cumulative stock returns over time.
portfolio, 𝑟𝑏,𝑡=60.10 The benchmark portfolio that I chose for the purpose of this study is the NASDAQ Composite Index, which is the market capitalization-weighted index of all companies listed on the NASDAQ stock exchange11. The benchmark portfolio’s return was calculated in the same way as the individual stock returns (equation 2).
𝑟𝑏,𝑡=60= ln (𝑝𝑝𝑏,𝑡=60
𝑏,𝑡=0) − 1 (2)
Then, for each stock, the representing 5-year period benchmark return was subtracted in order to get the excess stock return (equation 3).
𝑒𝑟𝑖,𝑡=60 = 𝑟𝑖,𝑡=60− 𝑟𝑏,𝑡=60 (3)
Survival
The long-term performance of companies is often measured by post-IPO firm survival (Hensler et al., 1997; Banerjee et al., 2007). This variable is binary, meaning that it can either have the value 0 or 1. For the purpose of this study, 1 denotes firm survival and 0 denotes exit within the five years after the initial offering. Throughout this thesis, exit stands for a firm turning defunct, which According to Park and Steensma (2012) describes a delisting due to negative reasons, i.e. bankruptcy and ceased operations. Only 10 companies in the final sample had an exit within the 5-year post-IPO period (8.62%).
4.4 Explanatory variables
Age-at-IPO
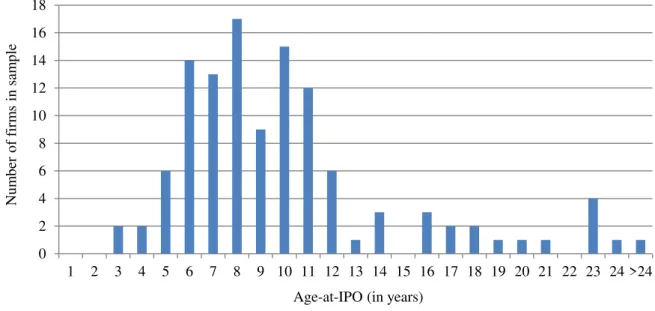
The time that it takes an Internet company from date of incorporation until the IPO is the primary explanatory variable in this study. I measure this variable in months. Figure 3 shows
10Excess returns are typically calculated through market models (e.g. CAPM) to account for companies’ betas
(MacKinlay, 1997). According to Ritter (1991), post-IPO firms’ betas to respective indexes do usually not have significant economic effects on the outcomes. Therefore, I determine excess returns without adjusting for betas.
that the data on age-at-IPO in this dataset is highly skewed to the right. The observations on the far right (age > 15 years) represent older companies that adapted their business strategy only after the appearance of the Internet. Thus, in their years of incorporation (before 1990) they would not have been Internet companies. Only later, these firms created product lines and services based on the web, which let them grow and attain an IPO. Nevertheless, these firms are defined as Internet companies since the majority of their revenue is made due to the Internet. As the data is skewed to the right, I decide to reduce the influence of older companies by conducting the analyses with two different age-at-IPO variables.
Figure 3: Distribution of the dataset in terms of age-at-IPO
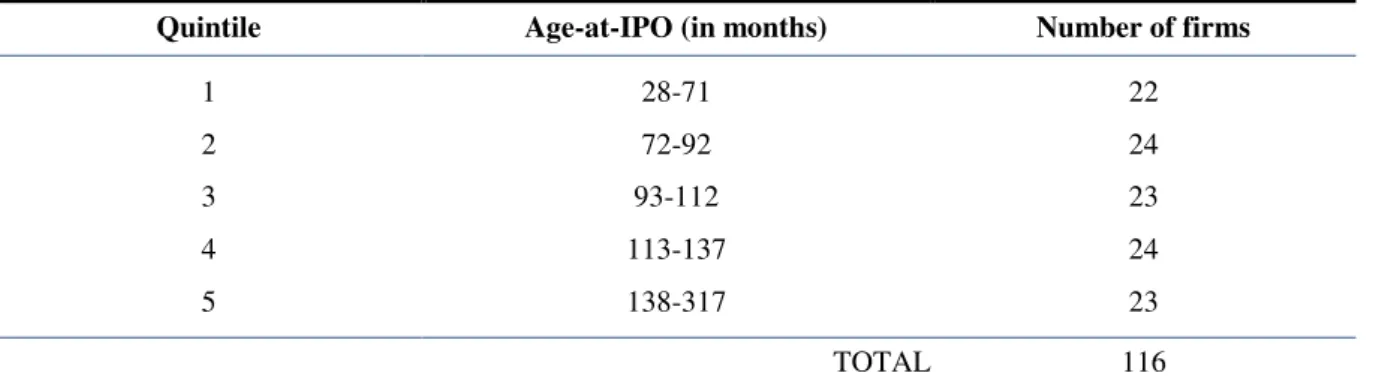
First, I take the natural logarithm of the age-at-IPO variable. The log-transformation of the variable standardizes the distribution and erases the influence of existing outliers. Second, I make a breakdown of the sample in terms of quintiles with regards to the age-at-IPO as applied by Clark (2002).12 Thus, five age-at-IPO groups are compared based on average 5-year post-IPO excess log returns (see table 2). The youngest quintile has a maximum age-at-IPO of 71 months (6 years), whereas firms in the oldest quintile are at least 138 months (11.5
12I applied the breakdown of companies into quintiles in SPSS through the function “Rank Cases”.
0 2 4 6 8 10 12 14 16 18
1 2 3 4 5 6 7 8 9 10 11 12 13 14 15 16 17 18 19 20 21 22 23 24 >24
Nu m b er o f fir m s in s am p le
years) old. The medium quintile has an age-at-IPO-range of 94 to 112 months.
Table 2: Age-at-IPO quintiles
Quintile Age-at-IPO (in months) Number of firms
1 28-71 22
2 72-92 24
3 93-112 23
4 113-137 24
5 138-317 23
TOTAL 116
Profit margin
Several authors describe a significant impact of firm profitability on the long-run performance of listed companies (Jain et al., 2008; Peristiani & Hong, 2004). Therefore, I assume that the profit margin in the year of the IPO is positively associated with long-term post-IPO firm performance (H3) and post-IPO firm survival (H4). Furthermore, since I assume that the relationship between age-at-IPO and post-IPO survival is impacted by a
firm’s profitability, I use the variable Profit margin as a moderating variable in hypothesis H5. It is hypothesized that profitability decreases the strength of the relationship in a sense that younger firms, which are profitable are more likely to survive, whereas older firms with less profitability are more likely to fail.
4.5 Control variables
Hensler et al. (1997) show that large IPOs have a better position in the market and a stronger base of resources than smaller IPOs in order to prosper despite bad investments or declining market valuations. Size is thus positively associated with companies’ post-IPO performance, in particular with post-IPO survival (Hensler et al., 1997). Ritter (1991) also finds that smaller firms have worse aftermarket performance.
In order to reduce the influence of firm size on the long-run performance of Internet IPOs, I control for firm size in this study. The two control variables that I use for this purpose are revenues in the year of the IPO (Revenues) and number of employees in the year of the IPO (Employees).
4.6 Empirical approach
This thesis focuses on the quantitative analysis of collected secondary data. In order to investigate the hypothesized relationships, I construct several regression models and analyze them. The two dependent variables used in this study are different variable types. Excess log return, which is used as a proxy for 5-year post-IPO performance is a continuous variable, whereas Survival (5-year post-IPO firm survival) is a binary variable. For the continuous variable Excess log return, I use ordinary least squares (OLS) regression models (H1 & H3). First, I analyze the U-shaped relationship between age-at-IPO and the post-IPO performance as predicted in hypothesis H1. Second, I investigate the hypothesized positive association between profitability and post-IPO performance (H3). The significance of the regression models is tested mainly by looking at the overall F-statistic and through looking at the
significance of the predictors’ coefficients.
analyze how well predictor variables explain a dependent variable that is categorical (Pallant,
2013). It further indicates how adequate the model is by “assessing goodness of fit” (Pallant, 2013, p. 171). Pallant (2013) explains that in logistic regression, the distribution of the explanatory variables is not important, but that these models are sensitive to multicollinearity, which arises when high correlations between predictors exists. Since outliers might influence the results of binary logistic regression (Pallant, 2013), it is important to apply the normalization procedures for the explanatory variable age-at-IPO as discussed in section 4.4 of this thesis.
Besides the regression models, I will compare the age-at-IPO quintiles based on their average post-IPO performance and the rate of firm survival within each group. For a proper analysis of the quintiles, I conduct a one-way analysis of variance and a chi-square test.
All of the analyses in this thesis have been conducted with the statistics computer software IBM SPSS 24.
5. Results
5.1 Descriptive statistics
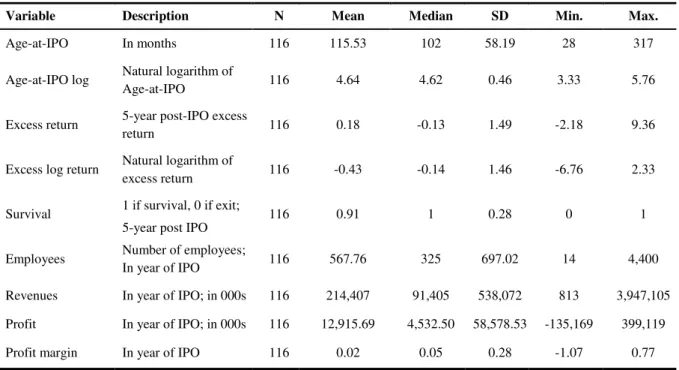
Table 3 shows the summary statistics of the final sample. The median age-at-IPO is 102 months, which translates to 8.5 years. Nevertheless, the mean age-at-IPO is 115.53 months (9.6 years). The mean is significantly higher than the median due to the fact that the data is skewed to the right as presented in section 4.4. This emphasizes the importance of standardizing age-at-IPO and creating age-at-IPO quintiles from the dataset. The same phenonemon as for age-at-IPO can also be observed for the excess returns: the data has severe outliers on the right part of the data. The median excess return is only -13%, whereas the mean is 18%.
Table 3: Summary statistics
Variable Description N Mean Median SD Min. Max.
Age-at-IPO In months 116 115.53 102 58.19 28 317
Age-at-IPO log Natural logarithm of
Age-at-IPO 116 4.64 4.62 0.46 3.33 5.76
Excess return 5-year post-IPO excess
return 116 0.18 -0.13 1.49 -2.18 9.36
Excess log return Natural logarithm of
excess return 116 -0.43 -0.14 1.46 -6.76 2.33
Survival 1 if survival, 0 if exit;
5-year post IPO
116 0.91 1 0.28 0 1
Employees Number of employees;
In year of IPO 116 567.76 325 697.02 14 4,400
Revenues In year of IPO; in 000s 116 214,407 91,405 538,072 813 3,947,105
Profit In year of IPO; in 000s 116 12,915.69 4,532.50 58,578.53 -135,169 399,119
Profit margin In year of IPO 116 0.02 0.05 0.28 -1.07 0.77
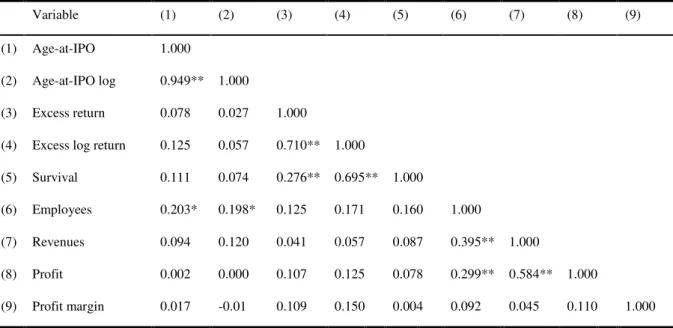
of less than one million U.S. dollars (advertising platform Sito Mobile), wheres the largest made almost four billion U.S. dollars in revenues in the IPO year (travel platform MakeMyTrip). The vast differences in the sample are further highlighted by the large standard deviations for these two variables (697.02 for employees; 538,072 for revenues). Correlations between the variables used in this thesis can be seen in the correlation matrix of table 4. The two explanatory variables of this study, Age-at-IPO (log) and Profit margin are not significantly correlated with each other, so that multicollinearity is not a problem (Pallant, 2013). For control variables – in this thesis Employees and Revenues – multicollinearity is generally not an issue (Pallant, 2013). Naturally, the variables Age-at-IPO and Excess return are highly correlated with their own natural logarithms.
The dependent variables Excess log return and Survival are correlated significantly at the 1% confidence level with a correlation coefficient of 0.695. This is intuitive as both are measures of long-term corporate performance. It also confirms the logic behind including the two
variables in this study to identify different aspects of Internet firms’ sustainable development.
Table 4: Correlation matrix
Variable (1) (2) (3) (4) (5) (6) (7) (8) (9)
(1) Age-at-IPO 1.000
(2) Age-at-IPO log 0.949** 1.000
(3) Excess return 0.078 0.027 1.000
(4) Excess log return 0.125 0.057 0.710** 1.000
(5) Survival 0.111 0.074 0.276** 0.695** 1.000
(6) Employees 0.203* 0.198* 0.125 0.171 0.160 1.000
(7) Revenues 0.094 0.120 0.041 0.057 0.087 0.395** 1.000
(8) Profit 0.002 0.000 0.107 0.125 0.078 0.299** 0.584** 1.000
(9) Profit margin 0.017 -0.01 0.109 0.150 0.004 0.092 0.045 0.110 1.000
** Correlation is significant at the 0.01 level (2-tailed).
5.2 Linear regression
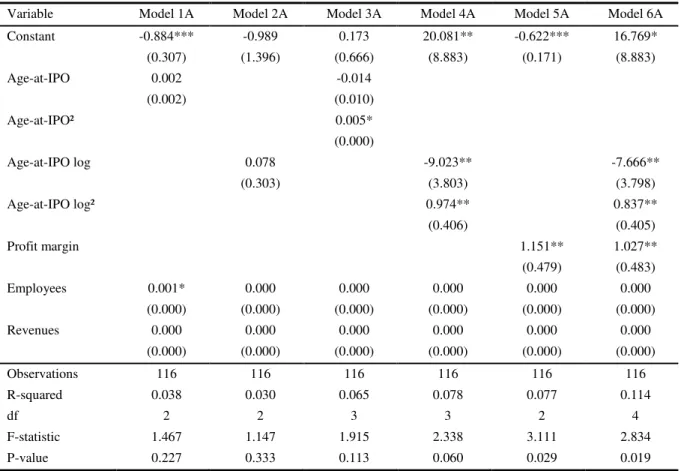
In this section, I will employ linear regression models in order to assess the hypothesized U-shaped relationship between age-at-IPO and the 5-year post-IPO stock performance (H1). Additionally, I will analyze whether a positive association between profitability in the year of the IPO and long-term stock returns exists as predicted in hypothesis H3. Table 5 provides an overview of the results from linear regression models with the dependent variable Excess log return.
Table 5: Results of linear regression models
Dependent variable: Excess log return
Variable Model 1A Model 2A Model 3A Model 4A Model 5A Model 6A
Constant -0.884*** -0.989 0.173 20.081** -0.622*** 16.769*
(0.307) (1.396) (0.666) (8.883) (0.171) (8.883)
Age-at-IPO 0.002 -0.014
(0.002) (0.010)
Age-at-IPO² 0.005*
(0.000)
Age-at-IPO log 0.078 -9.023** -7.666**
(0.303) (3.803) (3.798)
Age-at-IPO log² 0.974** 0.837**
(0.406) (0.405)
Profit margin 1.151** 1.027**
(0.479) (0.483)
Employees 0.001* 0.000 0.000 0.000 0.000 0.000
(0.000) (0.000) (0.000) (0.000) (0.000) (0.000)
Revenues 0.000 0.000 0.000 0.000 0.000 0.000
(0.000) (0.000) (0.000) (0.000) (0.000) (0.000)
Observations 116 116 116 116 116 116
R-squared 0.038 0.030 0.065 0.078 0.077 0.114
df 2 2 3 3 2 4
F-statistic 1.467 1.147 1.915 2.338 3.111 2.834
P-value 0.227 0.333 0.113 0.060 0.029 0.019
Standard errors in parentheses *** Significant at the 0.01 level ** Significant at the 0.05 level * Significant at the 0.10 level
two models, there is no significant relationship between age-at-IPO and post-IPO performance, as indicated by statistically insignificant coefficients for the age-at-IPO variables. Overall, models 1A and 2A also show very low F-statistics (1.467 and 1.147) and high p-values (0.227 and 0.333). Thus, these two models do not indicate a significant positive or negative linear association between age-at-IPO and post-IPO performance for Internet companies.
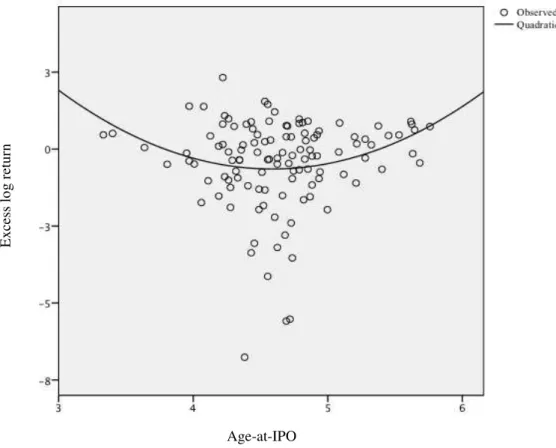
Next, I test for a U-shaped relationship between age-at-IPO and post-IPO excess returns as predicted in hypothesis H1. Therefore, I include a squared term of the age-at-IPO variables in the models 3A and 4A. Model 3A includes age-at-IPO in months and an age-at-IPO squared term. The overall model is not statistically significant (F-statistic = 1.915, p > 0.10), but the squared predictor variable (ß = 0.005, p < 0.10) is significant at the 90% confidence level. Even though the overall log-linear model is not statistically significant, interestingly the two independent variables go into the direction of a U-shape, with the linear term being negative and the squared term being slightly positive.
Figure 4: U-shaped relationship between age-at-IPO and excess returns
The equation of regression model 4A that describes the U-shaped relationship between Age-at-IPO log and Excess log return is shown below.13
𝐸𝑥𝑐𝑒𝑠𝑠_𝑙𝑜𝑔_𝑟𝑒𝑡𝑢𝑟𝑛 = 20.081 − 9.023 ∗ 𝐴𝑔𝑒_𝑎𝑡_𝐼𝑃𝑂_𝑙𝑜𝑔 + 0.974 ∗ 𝐴𝑔𝑒_𝑎𝑡_𝐼𝑃𝑂_𝑙𝑜𝑔2 (4)
The negative coefficient of the linear age-at-IPO term makes the regression line downward sloping initially. By setting the first derivative of the equation equal to zero, I find that the minimum of the slope is at Age-at-IPO log of 4.63 (approximately 102 months/ 8.5 years).14 The representing expected excess log return at this point is -81.6%. After the minimum point, the curve is upward sloping, indicating that firms older than 8.5 years, on average, start
13 This formula does not include the control variables, but as their coefficients are very close to zero and
statistically insignificant, I omit them in the equation.
14 The first derivative of the equation gives the slope of the curve: 𝑑𝑦
𝑑𝑥= −9.023 + 1.948𝑥. Setting the
derivative equal to 0 give the minimum point of the curve, which is at 𝑥 = 4.63193. Age-at-IPO
E
x
ce
ss
lo
g
r
etu
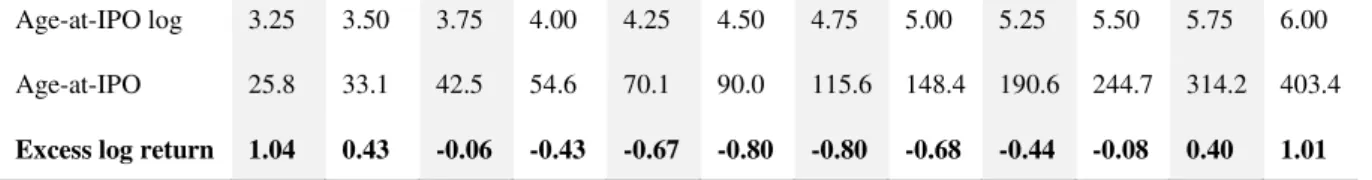
performing better again. Other expected values for excess log returns from regression model 4A can be obtained from table 6 below. The table also shows conversions of the values for age-at-IPO log into the original age-at-IPO values given in months.
Table 6: Expected excess log returns from regression model 4A
Age-at-IPO log 3.25 3.50 3.75 4.00 4.25 4.50 4.75 5.00 5.25 5.50 5.75 6.00
Age-at-IPO 25.8 33.1 42.5 54.6 70.1 90.0 115.6 148.4 190.6 244.7 314.2 403.4
Excess log return 1.04 0.43 -0.06 -0.43 -0.67 -0.80 -0.80 -0.68 -0.44 -0.08 0.40 1.01
Model 4A has an overall p-value of 0.06 (F-statistic = 2.338) and an R-squared of 7.8%. Even though the individual regression coefficients are statistically significant at the 0.05 level, the overall model is only significant at the 0.10 level (p = 0.06).
The relationship between profitability in the year of the IPO and the 5-year post-IPO performance of Internet companies is investigated with log-linear model 5A. As predicted in hypothesis H3, I find a significant positive relationship between profit margin in the year of the IPO and 5-year post-IPO excess returns. The regression coefficient of the independent variable Profit margin has a value of 1.151 (SE = 0.479) and is statistically significant (p < 0.05). Thus, holding all else equal, a 1% increase in profit margin is associated with a 1.151% increase in excess log returns.15 Also, model 5A is significant with an F-statistic of 3.111 (2 degrees of freedom) and a p-value of 0.029. The model is not only significant, but also has a relatively high R-squared of 7.7%.
Model 6A combines models 4A and 5A and thus includes three independent variables: Age-at-IPO log, Age-at-IPO log squared and Profit margin. All of these variables are significant at the 95% confidence level, which provides evidence for hypothesis H1 and hypothesis H3.
15 To calculate the exact change in the non-log-transformed dependent for a one-unit change in the independent
variable in log-linear models,one needs to calculate 𝑒ß (Benoit, 2011). To calculate the 1% change, the formula
Model 6A shows the highest significance of all models (p = 0.019) and has the highest value for goodness of fit with an R-squared of 11.4%. This means that the independent variables in model 6A explain 11.4% of the variability in the dependent variable Excess log return.16 Surprisingly, none of the control variables in the model is highly significant, which means that firm size does not relate to post-IPO performance in the Internet sector. This is contrasting past research on firms in general (Hensler et al., 1997). Regarding Employees this finding is intuitive since Internet companies are generally less asset-heavy, including human resources (Not & Parker, 2005). The result concerning Revenues could indicate that for Internet firms, post-IPO growth is more important than pre-IPO sales (Eisenmann, 2006). Overall, the results of the linear regression analyses provide evidence that there is a U-shaped relationship between firm age-at-IPO and the 5-year post-IPO performance of Internet companies. Therefore, Hypothesis H1 is supported. Furthermore, I find that Internet firms’ profit margins in the year of the IPO are positively associated with the 5-year post-IPO performance. Thus, hypothesis H3 is also supported.
5.3 Binary logistic regression
I use binary logistic regression models in order to assess the hypothesized relationship between the independent variables Age-at-IPO (hypothesis H2) and Profit margin (hypothesis H4) and the binary dependent variable Survival. Furthermore, the hypothesized moderation effect of Profit margin (hypothesis H5) on the relationship between age-at-IPO and Internet firm survival is tested. Table 6 provides an overview of the results from six different binary logistic regression models.
16 This study does not aim at predicting the dependent variable, but rather it aims at explaining the relationship
Table 7: Results of binary logistic regression models
Dependent variable: Survival
Model 1B Model 2B Model 3B Model 4B Model 5B Model 6B
Constant 0.239 -0.002 16.572* 1.012 0.366 0.200
(1.086) (4.142) (9.243) (0.680) (1.131) (1.156)
Age-at-IPO 0.006 -0.336* 0.007 0.008
(0.009) (0.194) (0.009) (0.009)
Age-at-IPO²
0.002*
(0.001)
Age-at-IPO log 0.181
(0.900)
Profit margin 1.112 1.132 6.550
(1.050) (1.033) (5.432)
Profit margin*Age-at-IPO -0.059
(0.058)
Employees 0.003 0.003 0.004 0.003 0.003 0.003
(0.002) (0.002) (0.003) (0.002) (0.002) (0.002)
Revenues 0.000 0.000 0.000 0.000 0.000 0.000
(0.000) (0.000) (0.000) (0.000) (0.000) (0.000)
Observations 116 116 116 116 116 116
Log Likelihood 58.703 59.154 51.818 58.051 57.476 56.203
Cox & Snell R-squared 0.078 0.074 0.131 0.083 0.088 0.098
Nagelkerke R-squared 0.176 0.168 0.295 0.187 0.198 0.220
Omnibus Tests of Model
Coefficients 9.429 8.979 16.314 10.081 10.656 11.929
P-value 0.024 0.030 0.003 0.018 0.031 0.036
Hosmer and Lemeshow Test 7.740 18.090 4.441 7.321 2.839 4.470
P-value 0.459 0.021 0.815 0.502 0.944 0.812
Standard errors in parentheses *** Significant at the 0.01 level ** Significant at the 0.05 level * Significant at the 0.10 level
Model 1B and 2B investigate whether a linear relationship between age-at-IPO and 5-year post-IPO survival exists for Internet companies. Both models pass the Omnibus Tests of Model Coefficients (p < 0.05), indicating the overall goodness of fit for the model (Pallant, 2013). Nevertheless, the Hosmer and Lemeshow Test does not support model 2B.17 When looking at the regression coefficients of model 1B and 2B, it becomes apparent that none of
17 The Hosmer-Lemeshow Goodness of Fit Test indicates poor fit of the model when it is significant (p < 0.05),
the independent variables in the model are significant. Thus, a linear relationship between age-at-IPO and 5-year post-IPO firm survival does not exist for the sample. Consequently, hypothesis H2 is not supported.
Model 3B adds a quadratic age-at-IPO term to model 1B to test for a U-shaped relationship between Age-at-IPO and Survival. This follows from the evidence found for the dependent variable Excess log return (hypothesis H1) that was tested with the linear regression model 1A. In fact, model 3B shows improvements with the independent variables being significant at the 0.10 level. The regression coefficient of the linear ageatIPO term is negative (ß = -0.336, p < 0.10), whereas the squared age-at-IPO term is positive (ß = 0.002, p < 0.10). Model 3B has a highly significant result for the Omnibus Tests (p = 0.003) and insignificance for the Hosmer-Lemeshow test (p = 0.815). The Cox & Snell and Nagelkerke R-squared values indicate that between 13.1% and 29.5% of the variability in post-IPO firm survival is explained by the model, which is the highest range of all binary regression models that I conducted.
Model 4B assesses the relationship between the independent variable Profit margin and the dependent variable Survival. Hypothesis H4 predicts that a positive relationship exists, which would imply that firms with higher profitability in the IPO year are more likely to survive in
the long term. Even though the variable’s regression coefficient is positive, it is not statistically significant (ß = 1.112, p > 0.05). Also in model 5B, profit margin is not significant (ß = 1.132, p > 0.05). Consequently, hypothesis H4 is not supported.
Model 6B tests for a moderation effect of Profit margin on the relationship between Age-at-IPO and Survival. Therefore, the interaction variable Profit margin*Age-at-IPO is added to model 5B. The coefficient for Age-at-IPO in this model is 0.008, which means that for every additional month of age-at-IPO, the likelihood of survival increases by 0.8%. The coefficient of the interaction variable is negative (-0.059), which would indicate that profitability decreases the strength of the relationship between Age-at-IPO and Survival as predicted. Nevertheless, none of the coefficients in this model are significant and thus, there is no evidence for a moderation effect. Therefore, insufficient support is found for hypothesis H5. As in the linear regression models of section 5.2, the control variables are not significant for any of the models. This further suggests that for Internet companies, size in the year of the IPO is not associated significantly with post-IPO performance, in particular firm survival.
5.4 Quintile analysis
When looking at the average excess log returns in table 5, which are used as the primary measure of long-term performance in this study, the same pattern is evident. Quintile 1 and 2 have the highest average excess log returns with 8.63% and -0.18% respectively. On the opposite side, quintiles 3 and 4 show the worst performance with -93.03% and -90.19% average excess log returns. The average excess log return of quintile 3 (-90.19%) is much lower relatively to its average excess return (15.02%). As period holding returns of individual stocks can have a minimum value of -100%, whereas there is no theoretical maximum, average excess returns are highly influenced by large positive returns above 100%. Through the log-transformation of excess returns, the magnitude of companies with very good performance is decreased and more emphasis is on firms that perform badly (Hudson & Gregoriou, 2015). Evidently, in the third quintile, there are more firms with negative holding period returns than in other quintiles, which makes the log-transformed values worse.18
Table 8: Long-term performance of age-at-IPO quintiles
Quintile Number of firms
Age-at-IPO (in months)
Average excess return
Average excess log return
Number of firms surviving
Percentage of firms surviving
1 22 28-71 68.39% 8.63% 21 95.45%
2 24 72-92 -29.16% -93.03% 20 83.33%
3 23 93-112 15.02% -90.19% 20 86.96%
4 24 113-137 5.27% -36.29% 22 91.67%
5 23 138-317 37.06% -0.18% 23 100%
TOTAL 116 115.53 18.35% -43.04% 106 91.34%
These findings confirm the evidence presented from linear regression models and they are in line with hypothesis H1, which predicts a U-shaped relationship between age-at-IPO and the post-IPO performance. Figure 4 illustrates this relationship.
18 For a detailed overview of observations for age-at-IPO and excess log returns see the scatterplots in Appendix
Figure 5: Excess (log) return per quintile of age-at-IPO
Furthermore, I conducted a one-way analysis of variance (ANOVA)19 in order to analyze whether the differences between the five groups with respect to average excess log returns are statistically significant. Overall, the analysis shows that the groups differ significantly at the 0.05 level.20Levene’s test for homogeneity of variances, which assesses if the variance in
scores is equal for each group, shows a significance level of 0.001 (Pallant, 2013). This means that the homogeneity of variance assumption is violated (Pallant, 2013). Therefore, I consult the Robust Tests of Equality of Means as suggested by Pallant (2013).21 Both, the Welch and the Brown-Forsythe test are significant at the 0.05 level. Thus, I find sufficient
evidence that the quintile groups’ means differ significantly with respect to the variable
average excess log returns.
19 A one-way ANOVA is used in order to investigate whether more than two groups differ significantly with
regards to their mean scores of a continuous dependent variable. The test compares the variance between the groups to the variance within each group. An F-statistic is calculated through dividing the total variance between the groups by the total variance within the groups. Thus, the larger the F-statistic, the more variance exists between the different groups as caused by the independent variable (Pallant, 2013).
20 Detailed results of the ANOVA can be seen in Appendix F.
21 The two Robust Tests of Equality of Means, Welch and Brown-Forsythe, should be used when the assumption
of the homogeneity of variance is violated (Pallant, 2013). -120% -100% -80% -60% -40% -20% 0% 20% 40% 60% 80%
28-71 (Q1) 72-92 (Q2) 93-112 (Q3) 113-137 (Q4) 138-317 (Q5)
E x ce ss r etu rn
Quintiles of time-to-IPO in months