419
Instituto Oceanográfico da Universidade de São Paulo, Caixa Postal 9075, 01065-970 São Paulo, SP, Brazil. e-mail: mraquel@usp.br
Diel feeding pattern and diet of rough scad
Trachurus lathami
Nichols, 1920
(Carangidae) from the Southwestern Atlantic
Maria Raquel de Carvalho and Lucy Satiko Hashimoto Soares
Diel changes in feeding activity and dietary composition of the rough scad Trachurus lathami were investigated through the analysis of stomach contents of 307 fish sampled over a 24-h period on the continental shelf off Ubatuba (23o 35´S 45oW).
Stomach contents were analyzed by frequency of occurrence (O%), percent number (N%), percent mass (M%), and feeding index (FI% = O% * M%). Rough scad fed on mollusks (Gastropoda, Crepidula sp.), crustacean (Ostracoda, Copepoda, deca-pod larvae), chaetognat and teleostean fish. The main items were calanoid copedeca-pods (Eucalanussp. and Centropagessp.). According to the analysis of the stomach fullness and prey digestion, T. lathami is both a diurnal and nocturnal feeder, showing some seasonal variation in feeding time. According to the Chronobiology concept, it was raised the hypothesis of circadian rhythm in feeding of this fish, probably synchronized by light/dark cycle.
O estudo da dieta e do padrão diário e sazonal de atividade alimentar do chicharro Trachurus lathami foi realizado através de análises dos conteúdos estomacais de 307 peixes amostrados em estações fixas de coleta de 24 horas na plataforma continental ao largo de Ubatuba (23o 35´S 45oW). Os conteúdos estomacais foram analisados através da freqüência numérica (N%), massa
porcentual (M%) e freqüência de ocorrência (O%) dos itens alimentares, e índice alimentar (O% * M%). A espécie caracterizou-se por ingerir principalmente copépodes calanóides (ex. Eucalanussp. e Centropagessp.), além de outros crustáceos (Ostracoda, larva de decápodes), moluscos (Gastropoda: Crepidula sp.), quetognatos e peixes teleósteos. De acordo com o grau de repleção estomacal e grau de digestão das presas, T. lathami ingeriu alimento tanto na fase clara quanto na fase escura do dia, apresentando variação sazonal no horário de tomada de alimento. De acordo com os conceitos da Cronobiologia foi levantada a hipótese de ritmo circadiano na atividade alimentar, provavelmente sincronizado pelo ciclo claro/escuro.
Key words: Food Habits, Feeding Ecology, Stomach Contents, Rhythms, Southeast Brazil.
Introduction
The critical and limiting resources for all animals are food and time. Food provides energy and nutrients for reproduc-tion, and to develop, maintain, and protect the somatic body. Time is necessary for foraging, as well as for other activities, such as resting and reproduction (Wootton, 1990). Accord-ing to chronobiologists, the majority of organisms present a circadian rhythm in their activities and this organization is the result of an evolutionary process that expresses a synchronicity among geophysical, environmental and bio-logical events (Marques & Menna-Barreto, 2003). Among marine, estuarine, and freshwater fishes, there are several records of feeding activity with circadian rhythm (see Neilson & Perry, 1990; Boujard & Leatherland, 1992, Sánchez-Vázquez
et al., 1997, Gerkema et al., 2000).
Studies on diel feeding in the natural environment are
ba-sic tools to understand the autoecology of fish species. And studies on diet composition may contribute to clarify prey-predator relationships, and to elaborate trophic models for the assessment of stocks (Christensen & Pauly, 1992).
Most species of Trachurus are widely distributed in both temperate and tropical coastal waters. Fifteen species are rec-ognized (Suda et al., 1995). Only Trachurus lathami Nichols 1920 occurs in the south-western Atlantic from the Gulf of Maine (United States of America) down to the north of Ar-gentina. It is a demersal-pelagic species, with maximum size about 40 cm of length and 0.5 kg of mass (Menezes & Figuei-redo, 1980), occurring in waters from 50 to 100m in depth, at temperatures between 15o and 17o C and salinity between 35.5
and 35.8 (Saccardo & Katsuragawa, 1995; Mello et al., 1992).
Considering that there are few studies on diet composition ofT. lathami (Pedreira, 1997; Crispino, 1995) and there are no studies about diel feeding of this species, we proposed to iden-tify its pattern of daily feeding activity, and to describe the variation of its diet composition during the course of the day.
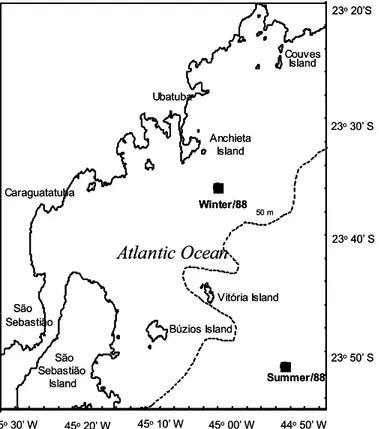
Study area. The study site is located on the continental shelf of the coastal system off Ubatuba (23°35’S, 45°00’W), Brazil, southwestern Atlantic (Fig. 1).
Different water masses are present in this area during sum-mer and winter. During sumsum-mer, there is a two-layer vertical stratification due to the seasonal thermocline: the upper layer consists of warmer and less saline Coastal Water – CW (T=22-24oC; S=35-35.4) and the lower of colder South Atlantic
Cen-tral Water – SACW (T=14-15oC; S=35.6-35.8). During the
win-ter, only Coastal Water is present on the inner shelf (Castro & Miranda, 1998).
Materials and Methods
Sampling.Rough scad were sampled during the periods 22-24 July 1988 and 4-6 December 1988 on the continental shelf off Ubatuba, São Paulo State, Brazil (Fig. 1). On each cruise, samples were collected in two consecutive 24-hour periods at 3-hour intervals, through 30 min trawls.
From the total catch, a sample of at least 30 specimens were randomly separated for biological analysis, size consid-ered suitable for this type of study (eg. Livingston, 1982); all available individuals were collected from the small samples. A total of 307 stomachs were considered in this study (Table 1). The specimens were frozen, and the total length and total mass of each individual were measured in the laboratory. The stomachs were removed and preserved in 10% buffered for-malin solution.
Regional samples of this species are deposited in Museu
Fig. 1. Sampling area on the southeastern Brazilian shelf and the trawl stations location.
Table 1. Sampling information for Trachurus lathami from Brazilian shelf off Ubatuba.
Ubatuba
Anchieta Island
Vitória Island
Búzios Island
São Sebastião
Island Sebastião Caraguatatuba
45o30’ W 45o20’ W 45o10’ W 44o50’ W
23o20’S
23o50’ S
45o00’ W
23o40’ S
23o30’ S
50 m
Summer/88
São
Winter/88
Couves Island
Atlantic Ocean
UbatubaAnchieta Island
Vitória Island
Búzios Island
São Sebastião
Island Sebastião Caraguatatuba
45o30’ W 45o20’ W 45o10’ W 44o50’ W
23o20’S
23o50’ S
45o00’ W
23o40’ S
23o30’ S
50 m
Summer/88
São
Winter/88
Couves Island
Atlantic Ocean
Winter time (h) phase stomach size range (mm) <115mm >115mm mean mass (g)
(n) (n) (n)
22/07/88 15:13 to 15:43 afternoon 17 104-128 8 9 16.69 22/07/88 18:17 to 22:15 night 37 110-157 3 34 22.31 23/07/88 00:10 to 00:40 night 6 111-136 1 5 16.74 23/07/88 10:46 to 11:16 morning 26 104-153 5 21 17.99 23/07/88 15:23 to 15:53 afternoon 2 112-114 2 0 14.25
Total 88 104-157 19 69 17.60
Summer time (h) phase stomach size range (mm) <115mm >115mm mean mass (g)
(n) (n) (n)
12/4/1988 14:06 to 17:37 afternoon 36 53-92 36 0 3.11 12/4/1988 23:04 to 23:34 night 1 149 0 1 31.80 12/5/1988 02:43 to 03:13 night 5 65-155 1 4 22.12 12/5/1988 05:11 to 05:41 dawn 29 79-175 4 25 30.07 12/5/1988 08:55 to 11:40 morning 35 56-154 33 2 4.93 12/5/1988 15:05 to 17:39 afternoon 37 54-167 17 20 22.20 12/5/1988 20:01 to 20:31 night 10 56-168 3 7 32.68 12/6/1988 02:05 to 02:35 night 9 53-170 5 4 15.99 12/6/1988 05:13 to 05:43 dawn 28 55-170 15 13 19.56 12/6/1988 08:00 to 08:30 morning 29 48-97 29 0 3.38
Total 219 53-175 143 76 18.58
de Zoologia da Universidade de São Paulo (MZUSP 65886, MZUSP 65888, MZUSP 25887).
prey) was assigned for individual items, according to Soares & Apelbaum (1994). The state of digestion of the total stom-ach content was assigned based on the proportion of prey in a particular state in the content: fresh, more than 75% of the prey in a fresh state; partially digested, 25-75% of fresh con-tent and digested, less than 25% of fresh prey.
Data analysis. Diel feeding activity was analyzed according to data on stomach’s fullness levels (%), stomach index of fullness (BM% = mass of the stomach content X mass of the fish-1 X 100), state of digestion of the stomach content (%),
and number and frequency of fresh prey.
The samples were joined into a single 24-hour cycle per sampling period; the midpoint of each hauling period was used as a reference point in time. Sampling times that were less than half an hour apart were brought together into a single sample, and the midpoints averaged (Table 1). Varia-tions in the BM% and number of fresh prey between sam-pling periods of the day were tested by Kruskall-Wallis’ non-parametric test variance analysis (Zar, 1996) to assess the influence of the sampling time on feeding activity.
The stomach contents were analyzed using: frequency of occurrence (O%), percent number (N%), percent mass (M%) (Hyslop, 1980), and a feeding index (FI% = O%* M%) (Kawakami and Vazzoler, 1980). Cluster analysis (UPGMA method), using Shoener’s percent similarity index (PS), was used to analyze the diel changes in prey composition (Magurran, 1988; Linton et al., 1981). Values of PS vary from 0, when no food is shared, to 1, when there are the same proportional food resources. As suggested in literature (eg. Wallace, 1981; Cabral, 2000) values PS > 60% should be considered similar.
Results
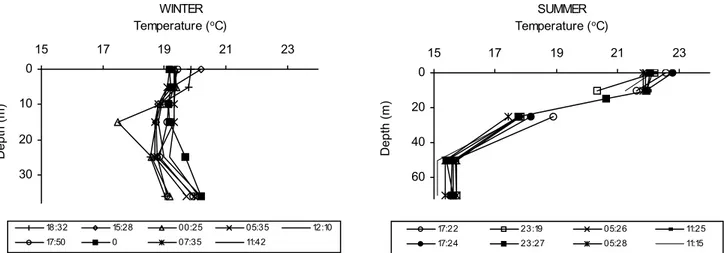
Oceanographic conditions. In this study, during the winter, water temperature ranged from 19 to 21oC and salinity from 32
to 35, presenting a homogeneous profile throughout the day. In the summer, two water masses were present, one of them
with temperatures between 21 and 23oC and salinity between
35.3 and 35.9, and the other with temperatures between 15 and 19oC and salinity between 35.5 and 36. The temperature
profiles are shown in Fig. 2.
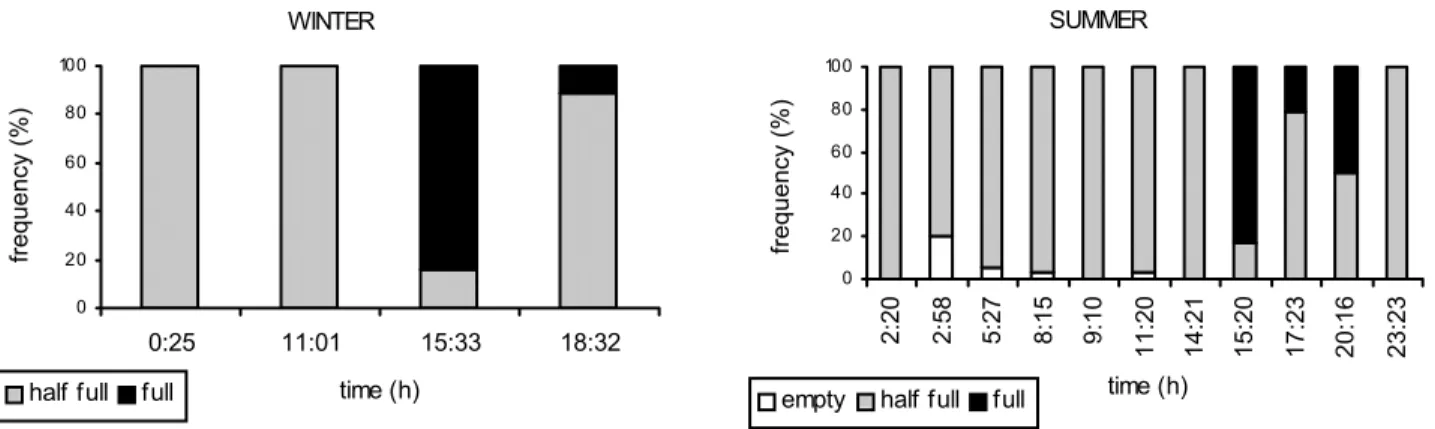
Diel feeding activity. The stomach’s fullness levels and index of fullness showed the same diel pattern during the winter and summer (Figs. 3-4). Full stomachs occurred in the afternoon and at night. Empty stomachs occurred only in the summer, in the early morning and at dawn. Data on index of fullness re-vealed a pattern of daytime feeding, attaining maximum values during the afternoon in the winter (Kruskall-Wallis test: c2=47,09;
P<0.0001) and summer (Kruskall-Wallis test: c2=138.93; P=0).
The index of fullness presented the same tendency along the day, in winter and summer, when fishes were divided in adults (>115 mm) and juvenile (<115 mm), following the esti-mative of the size of first maturity (Saccardo & Katsuragawa, 1995) (Fig. 5).
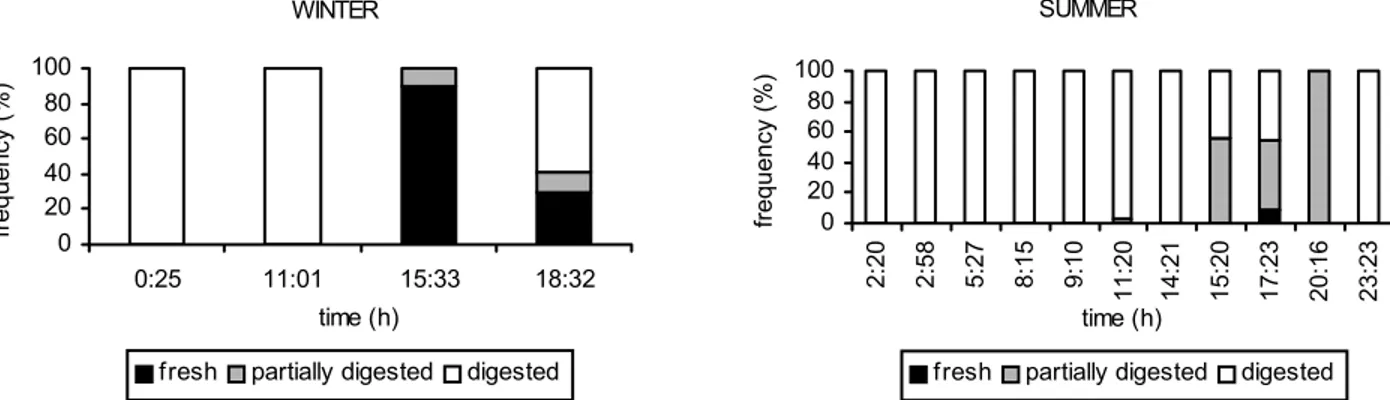
The proportion of stomachs containing fresh prey was highest in the afternoon (15:33h) and at night (18:32h) in the winter. During the summer, stomachs with fresh or partially digested prey were highest at afternoon (15:20h, 17:23h) and at night (20:16h) just stomachs with partially digested prey occurred (Fig. 6).
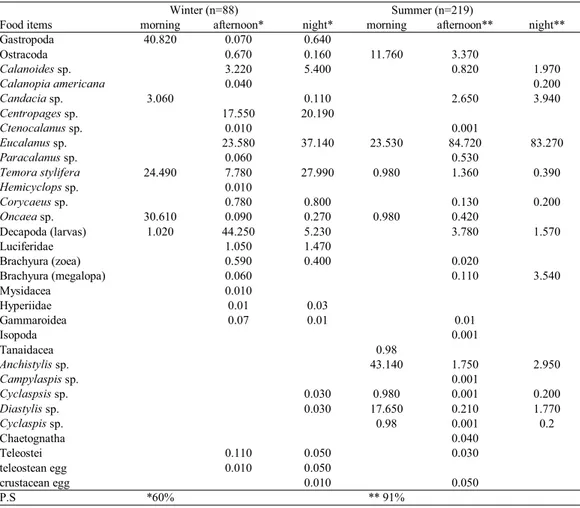
Diet.The diet of T. lathami was composed of Mollusca, Crus-tacea, Chaetognatha, and Teleostei fish (eggs and larvae.
Among Arthropoda there was a greater abundance of Crustacea, represented by Ostracoda and Copepoda (Tab. 2). The diet composition was similar over the feeding activ-ity time (afternoon and night) during the winter and summer, and consisted mainly of calanoid copepods (Eucalanussp.
andCentropages sp.) and decapod larvae (Tab. 3).
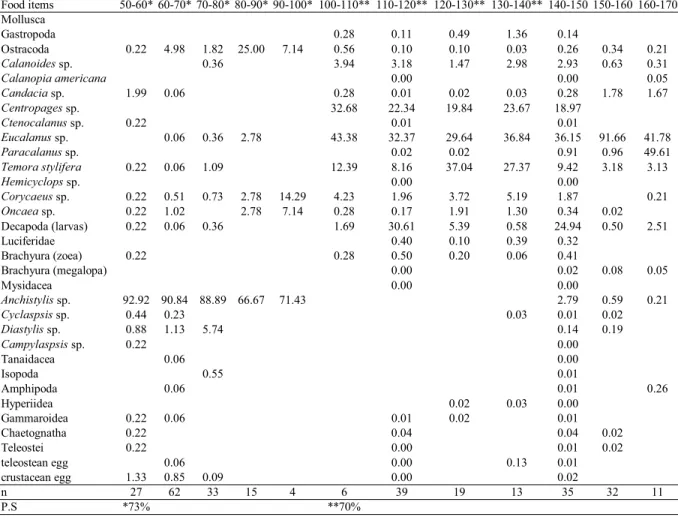
Two similar groups of length class were detected based on diet composition. Specimens of the classes of 50 to 90mm presented similar diet composition, mainly cumaceans, and the classes of 100 to 130 mm ingested essentially calanoid copepods (Tab. 4).
Fig. 2. Fluctuation of water temperature at different times of the day, in winter (23o 35.6´S/ 44o 59´W) and summer (23o 51.3´S/
44o 47.6´W) 1988, on the shelf off Ubatuba. 0
10
20
30
15 17 19 21 23
WINTER Temperature (oC)
D
epth (m)
18:32 15:28 00:25 05:35 12:10
17:50 0 07:35 11:42
0
20
40
60
15 17 19 21 23
SUMMER Temperature (oC)
D
epth (m)
17:22 23:19 05:26 11:25
Table 2. Frequency of occurency (O%), percent mass (M%), and feeding index (FI%) of food items of Trachurus lathami
collected in winter and summer from Brazilian shelf off Ubatuba.
Fig. 3. Proportion of the stomach fullness levels of Trachurus lathami from Ubatuba shelf by sampling period in winter (22-24/ 07/1988 - 23o 35.6´S/ 44o 59´W) and summer (04-06/12/1988 - 23o 51.3´S/44o 47.6´W).
Discussion
Trachurus lathami presented distinct phases of feeding and nonfeeding time during the 24-hour period, suggesting a circadian rhythm in feeding activity. Evening and nocturnal feeding activity were observed. We can say that even in the summer and in the winter, the feeding activity occurred, mainly, at afternoon and night phases. This similar result can be ex-plained by the fact of the distinct points where the sample was collected (38m in winter and 72m in summer) were located in an
intermediate area. This area presents different oceanographic conditions (Castro & Miranda, 1998), but this species in large schools can occupy all of this area, including the different points cited (Almeida, 2001; Saccardo & Katsuragawa, 1995). The majority of the fish known as “horse-mackerel” (Trachurus spp.) present diurnal feeding habits (Shuntov, 1969; Pillar & Barange, 1998). Daily variation in feeding activ-ity is often recorded in other carangids, and they usually present a pattern of feeding activity with greater intensity around twilight (Danemann, 1993; Helmer et al., 1995).
Winter (n=88) Summer (n=219)
Food items O% M% FI% O% M% FI%
Gastropoda 22.730 0.179 0.558
Crustacea 48.860 23.034 67.480 34.522
Ostracoda 15.910 0.179 0.552 18.400 0.334 2.282
Copepoda 48.860 16.167
Calanoides sp. 29.550 0.974 3.681 7.980 0.223 1.224
Calanopia americana 2.270 0.038 0.028 0.610 0.008 0.071
Candacia sp. 3.410 0.090 0.050 11.040 0.485 3.073
Centropages sp. 38.640 3.228 17.984
Ctenocalanus sp. 2.270 0.013 0.009 0.610 0.008 0.002
Eucalanus sp. 32.950 5.840 26.400 14.720 12.160 83.218
Paracalanus sp. 3.410 0.038 0.042 1.230 0.645 0.326
Temora stylifera 43.180 2.729 12.450 14.110 0.183 1.004
Hemicyclops sp. 1.140 0.013 0.005
Corycaeussp. 31.820 0.167 0.780 5.520 0.048 0.152
Oncaea sp. 25.000 0.128 0.394 8.590 0.088 0.277
Decapoda (larvas) 30.680 5.790 35.146 7.980 0.875 2.920 Luciferidae 15.910 0.525 1.131
Brachyura (zoea) 20.450 0.167 0.540 1.230 0.024 0.012 Brachyura (megalopa) 2.270 0.064 0.047 2.450 0.231 1.353
Mysidacea 1.140 0.013 0.005
Anchistylis sp. 38.650 0.159 2.845
Campylaspis sp. 0.610 0.008 0.002
Cyclaspsis sp. 2.270 0.013 0.060
Diastylis sp. 2.270 0.013 0.060 13.500 0.088 1.056
Cyclaspis sp. 1.840 0.024 0.089
Chaetognatha 1.230 0.048 0.024
Teleostei 2.270 0.282 0.096 0.610 0.064
teleostean egg 3.410 0.038 0.017
crustacean egg 1.140 0.013 0.003 3.070 0.024 0.030
WINTER
0 20 40 60 80 100
0:25 11:01 15:33 18:32
time (h)
frequency (%)
half full full
SUMMER
0 20 40 60 80 100
2:20 2:58 5:27 8:15 9:10 11:20 14:21 15:20 17:23 20:16 23:23
time (h)
frequency (%)
The circadian rhythms in fish may be associated with vari-ous factors such as light, temperature, salinity, and availabil-ity of prey or with association of these factors. The light has been suggested as a strong and universal influence, acting powerfully in the synchronization of these physiological and behavioral rhythms (McFarland, 1986; Boujard & Leatherland, 1992; Marques & Menna-Barreto, 2003). Diurnal and noctur-nal feeding activity must be related to the difference in the
Fig. 4. Stomach index of fullness expressed as BM% (mass of the stomach content x mass of the fish -1 x 100) of Trachurus lathami by sampling period from Ubatuba shelf, in winter (22-24/07/1988 - 23o 35.6´S/ 44o 59´W) and summer (0406/12/1988
-23o 51.3´S/44o 47.6´W).
intensity of light, which brings alternation in the period of time of the light and dark phases of the day (Boujard & Leatherland, 1992).
Hunter (1968) suggested, however, that with adequate light, as when there is a full moon, some fish are able to feed at the surface at night. In the present study, data were collected dur-ing periods of the waxdur-ing or wandur-ing of the moon, therefore without interference of moonlight in the feeding activity of the
Table 3. Feeding index of food items of Trachurus lathami collected in winter and summer from Brazilian shelf off Ubatuba. *and **Percent similarity index (PS) > 60%.
Winter (n=88) Summer (n=219)
Food items morning afternoon* night* morning afternoon** night** Gastropoda 40.820 0.070 0.640
Ostracoda 0.670 0.160 11.760 3.370
Calanoides sp. 3.220 5.400 0.820 1.970
Calanopia americana 0.040 0.200
Candacia sp. 3.060 0.110 2.650 3.940
Centropages sp. 17.550 20.190
Ctenocalanus sp. 0.010 0.001
Eucalanus sp. 23.580 37.140 23.530 84.720 83.270
Paracalanus sp. 0.060 0.530
Temora stylifera 24.490 7.780 27.990 0.980 1.360 0.390
Hemicyclops sp. 0.010
Corycaeus sp. 0.780 0.800 0.130 0.200
Oncaea sp. 30.610 0.090 0.270 0.980 0.420 Decapoda (larvas) 1.020 44.250 5.230 3.780 1.570
Luciferidae 1.050 1.470
Brachyura (zoea) 0.590 0.400 0.020
Brachyura (megalopa) 0.060 0.110 3.540
Mysidacea 0.010
Hyperiidae 0.01 0.03
Gammaroidea 0.07 0.01 0.01
Isopoda 0.001
Tanaidacea 0.98
Anchistylis sp. 43.140 1.750 2.950
Campylaspis sp. 0.001
Cyclaspsis sp. 0.030 0.980 0.001 0.200
Diastylis sp. 0.030 17.650 0.210 1.770
Cyclaspis sp. 0.98 0.001 0.2
Chaetognatha 0.040
Teleostei 0.110 0.050 0.030
teleostean egg 0.010 0.050
crustacean egg 0.010 0.050
P.S *60% ** 91%
WINTER
0 0.5 1 1.5
0:25 11:01 15:33 18:32 22:00
tim e (h)
%BM
SUMMER
0 0.5 1 1.5
2:
20
2:
58
5:
27
8:
15
9:
10
11:
20
14:
21
15:
20
17:
23
20:
16
23:
23
tim e (h)
fish. Fluctuations in temperature and salinity during the day were not reflected in the daily cycle. It may be conjectured, however, that the light, during the photoperiod must act as an abiotic factor responsible for the synchronization between the environmental events and the feeding activity of T. lathami. The vertical migration shown by the species, which migrates to the surface layer during the night and remains at the bottom
during the morning (Saccardo, 1987), may also be synchro-nized by the cycle of availability of prey. Beyond this fact, the migration of prey may also occur in such a way as to synchro-nize it to the light/dark cycle (Neilson & Perry, 1990). The feed-ing phase of T. lathami is the same of those that have been registered in the main catches of this species, denoting the higher vulnerability on these times (Almeida, 2001).
Table 4. Diet composition of Trachurus lathami expressed by feeding index (FI%) according of lenght classes (mm) of fish collected in winter and summer on Brazilian shelf off Ubatuba. * and ** Percent similarity index (PS) > 60%.
Fig. 5. Mean of stomach index of fullness expressed as BM% (mass of the stomach content x mass of the fish -1 x 100) of adult
(> 115mm) and juvenile (< 115mm) Trachurus lathami by sampling period from Ubatuba shelf, in winter and summer.
Food items 50-60* 60-70* 70-80* 80-90* 90-100* 100-110** 110-120** 120-130** 130-140** 140-150 150-160 160-170
Mollusca
Gastropoda 0.28 0.11 0.49 1.36 0.14
Ostracoda 0.22 4.98 1.82 25.00 7.14 0.56 0.10 0.10 0.03 0.26 0.34 0.21
Calanoides sp. 0.36 3.94 3.18 1.47 2.98 2.93 0.63 0.31
Calanopia americana 0.00 0.00 0.05
Candacia sp. 1.99 0.06 0.28 0.01 0.02 0.03 0.28 1.78 1.67
Centropages sp. 32.68 22.34 19.84 23.67 18.97
Ctenocalanus sp. 0.22 0.01 0.01
Eucalanus sp. 0.06 0.36 2.78 43.38 32.37 29.64 36.84 36.15 91.66 41.78
Paracalanus sp. 0.02 0.02 0.91 0.96 49.61
Temora stylifera 0.22 0.06 1.09 12.39 8.16 37.04 27.37 9.42 3.18 3.13
Hemicyclops sp. 0.00 0.00
Corycaeussp. 0.22 0.51 0.73 2.78 14.29 4.23 1.96 3.72 5.19 1.87 0.21
Oncaea sp. 0.22 1.02 2.78 7.14 0.28 0.17 1.91 1.30 0.34 0.02 Decapoda (larvas) 0.22 0.06 0.36 1.69 30.61 5.39 0.58 24.94 0.50 2.51
Luciferidae 0.40 0.10 0.39 0.32
Brachyura (zoea) 0.22 0.28 0.50 0.20 0.06 0.41 Brachyura (megalopa) 0.00 0.02 0.08 0.05
Mysidacea 0.00 0.00
Anchistylis sp. 92.92 90.84 88.89 66.67 71.43 2.79 0.59 0.21
Cyclaspsis sp. 0.44 0.23 0.03 0.01 0.02
Diastylis sp. 0.88 1.13 5.74 0.14 0.19
Campylaspsis sp. 0.22 0.00
Tanaidacea 0.06 0.00
Isopoda 0.55 0.01
Amphipoda 0.06 0.01 0.26
Hyperiidea 0.02 0.03 0.00
Gammaroidea 0.22 0.06 0.01 0.02 0.01
Chaetognatha 0.22 0.04 0.04 0.02
Teleostei 0.22 0.00 0.01 0.02
teleostean egg 0.06 0.00 0.13 0.01
crustacean egg 1.33 0.85 0.09 0.00 0.02
n 27 62 33 15 4 6 39 19 13 35 32 11
P.S *73% **70%
WINTER
0 0.5 1 1.5 2 2.5 3
0 2 4 6 8 10 12 14 16 18 20 22 24
time (h)
% BM
> 115mm
< 115mm
SUMMER
0 0.5 1 1.5 2 2.5 3
0 2 4 6 8 10 12 14 16 18 20 22 24
time (h)
% BM
> 115mm
Overall, the diet of T. lathami was similar in the two phases of feeding activity, being mainly composed of calanoid cope-pods, which are the most abundant copepod in the study area (Veja-Pérez, 1993). In relation to Eucalanidae copepods, they are abundant along the year (Hernandez, 1999; Oliveira, 1999), which might explain their occurrence over all the 24-hours cycle, both in winter and in summer.
Difference as the occurrence of decapod larvae only at the twilight and nocturnal phases in the winter, for instance, may be related to the phase in the development of these or-ganisms. In the case of the ingestion of cumaceans mainly in summer, it must be associated with their greater abundance in this season, related to the penetration of the cold water of the SACW (Santos, 1992). In the summer the penetration of the SACW leads to the nutrient enrichment of the euphotic zone water, causing an increase in the production of phytoplank-ton. This primary production sustains a larger biomass of herbivorous zooplankton and offers better conditions for the survival of fish larvae and benthic animals (Pires-Vanin & Matsuura, 1993). Cumaceans present the same pattern of daily vertical migration (Santos & Pires-Vanin, 1999) as T. lathami
(Saccardo, 1987), moving upward during the night and de-scending during the morning. This co-existence explains the prey-predator relationship between cumaceans and T. lathami. Trophic interactions are complex relationships that involve food, fish, predators, biological process and displacement in water (Manteifel et al., 1978). The vertical migration of many species of crustaceans is due to endogenous rhythm syn-chronized by light/dark cycle (Neilson & Perry, 1990) that produces the synchronicity between the movement of the prey and predators.
We may point out that there are clear evidences of tempo-ral organization in the feeding activity of T. lathami in the daily cycle. Based on the evening and nocturnal activity, we can suggest the hypothesis of a circadian rhythm for this species, synchronized by the light/dark cycle and/or by the cycle of availability of food. However, to know if this rhythm is endogenous or exogenous, free-running laboratory experi-ments are needed in order to study the origin of the rhythm. If this feeding rhythm would be detected in constant
condi-tions, without any environmental cycle, it could be consid-ered an endogenous rhythm, characterized by an anticipa-tion of cyclic changes, if not, exogenous rhythm is related with a direct answer to an environmental cycle.
The results related with feeding activity pattern of this study can improve the fisheries resolutions for management of this increasing economical resource.
Acknowledgements
This work was part of M.R.C. Master thesis, supported by Fapesp (Fundação de Auxílio à Pesquisa do Estado de São Paulo) (Proc. 97/12628-0). L.S.H.S. was partially supported by grant of the CNPq (Conselho Nacional de Pesquisa) (Proc. 523249/96-9). We are grateful to the CIRM (Comissão Interministerial para Recursos do Mar) for financial support. Special thanks to Dr Tagea K. Björnberg for helping with identification of copepods.
Literature Cited
Almeida, C. R. T. 2001. Variações temporais na estrutura da comu-nidade de peixes demersais da plataforma continental de Ubatuba, SP. Unpublished Ph.D. Dissertation, Universidade de São Paulo, São Paulo. 85p.
Boujard, T. & J. F. Leatherland. 1992. Circadian rhythms and feeding time in fishes. Environmental Biology of Fishes, 35: 109-131. Cabral, H. N. 2000. Comparative feeding ecology of sympatric Solea solea and S. senegalensis, within the nursery areas of the Tagus estuary, Portugal. Journal of Fish Biology, 57: 1550-1562. Castro, B. M. & L. B. Miranda. 1998. Physical oceanography of
the western Atlantic continental shelf located between 4o N and
34o S – coastal segment (4,W). The Sea, 11: 209-251.
Christensen, V. & D. Pauly. 1992. A guide to Ecopath II software system (version 2.1). Mamilia, ICLARM software 6. Crispino, R. L. 1995. Morfologia funcional dos Teleostei: Etropus
longimanus (Norman, 1933) Bothidae; Eucinostomus argenteus
(Baird and Girard, 1854) Gerreidae; Orthopristis ruber (Cuvier, 1830) Haemulidae; Trachurus lathami (Nichols, 1920) Carangidae eStephanolepsis hispidus (Linnaeus, 1758) Monocanthidae e sua relação com os hábitos alimentares. Unpublished Ph.D. Dissertation, Universidade de São Paulo, São Paulo. 62p.
Fig. 6. Proportion of the state of digestion of stomach content of Trachurus lathami by sampling period from Ubatuba shelf, in winter (22-24/07/1988 - 23o 35.6´S/ 44o 59´W) and summer (04-06/12/1988 - 23o 51.3´S/44o 47.6´W).
WINTER
0 20 40 60 80 100
0:25 11:01 15:33 18:32
time (h)
frequency (%)
fresh partially digested digested
SUMMER
0 20 40 60 80 100
2:20 2:58 5:27 8:15 9:10
11:20 14:21 15:20 17:23 20:16 23:23 time (h)
frequency (%)
Danemann, G. D. 1993. General characteristics of the diet of
Trachinotus rhodopus (Perciformes: Carangidae). Revista de Biologia Tropical, 41(3b): 811-815.
Gerkema, M. P., J. J. Videler, J. de Wiljes, H. van Lavieren, H. Gerritsen & M. Karel. 2000. Photic entrainment of circadian activity patterns in the tropical labrid fish Halichoeres chrysus. Chronobiology International, 17(5): 613-622.
Helmer, J. L., R. L. Teixeira & C. Monteiro-Neto. 1995. Food habits of young Trachinotus (Pisces, Carangidae) in the inner surf-zone of a sandy beach in southeast Brazil. Atlantica. 17: 95-107.
Hernandez, S. 1999. Estudo do zooplâncton da região compreendi-da entre Cabo Frio (RJ) e Santos (SP), com ênfase nas espécies da família Corycaeidae (Copepoda Poecilostomatoida). Unpublished Ph.D. Dissertation, Universidade de São Paulo, São Paulo. 125p.
Hunter, J. R. 1968. Effects of light on schooling and feeding of jack mackerelTrachurus symmetricus. Journal of Fisheries Research - Board Canada, 25(2): 393-407.
Hyslop, E. J. 1980. Stomach contents analysis - a review of methods and their application. Journal of Fish Biology, 17(4): 411-429. Kawakami, E. & G. Vazzoler. 1980. Método gráfico e estimativa do índice alimentar aplicado no estudo de alimentação de peixes. Boletim do Instituto Oceanográfico, Universidade de São Pau-lo, São PauPau-lo, 29(2): 205-207.
Linton, L. R., R.W. Davies & F. J. Wrona. 1981. Resource utilization indices: an assessment. Journal of Animal Ecology, 50: 283-292. Livingston, R.J. 1982. Trophic organization os fishes in a coastal seagrass system. Marine Ecological Progress Series, 7(1): 1-12. Magurran, A. E. 1988. Ecological diversity and its measurement.
Cambridge, University Press, 179p.
Manteilfel, B. P., I. I. Girsa, & D. S. Pavlov. 1978. On rhythms of fish behaviour. Pp. 215-224. In: J. E. Thorpe (Ed.). Rhythmic Activity of fishes. London, Academic Press, 312p.
Marques, N. & L. Menna-Barreto (orgs.). 2003. Cronobiologia: princípios e aplicações. São Paulo, EDUSP, 435p.
Mcfarland, W. N. 1986. Light in the sea - correlations with behaviors of fishes and invertebrates. American Zoologist, 26: 389-401. Mello, R. M., J. P. Castello & K. M. Freire. 1992. Asociacion de
especies pelagicas en el sur de Brasil durante inverno y prima-vera. Frente Maritimo, 11(Sec.A): 63-69.
Menezes, N. A. & J. L. Figueiredo. 1980. Manual de peixes mari-nhos do sudeste do Brasil. IV. Teleostei (3). São Paulo, Museu de Zoologia da Universidade de São Paulo, 96p.
Neilson, J. D. & R. I. Perry. 1990. Diel vertical migrations of marine fishes: an obligate facultative process? Advances in Marine Biology, 26: 115-168.
Oliveira, M. R. 1999. Zooplâncton da plataforma continental su-deste do Brasil, entre Mongaguá-SP (24o 05’S) e o Cabo de
Santa Marta Grande-SC (28o 40’S), com especial referência aos
copépodos Eucalanidae. Unpublished Ph.D. Dissertation, Uni-versidade de São Paulo, São Paulo. 147p.
Pedreira, M. M. 1997. Alimentação e hábito alimentar de larvas de
Trachurus lathami (família Carangidae), na região de Ubatuba, Estado de São Paulo. Unpublished Ph.D. Dissertation, Univer-sidade de São Paulo, São Paulo. 129p.
Pillar, S. C. & M. Barange. 1998. Feeding habits, daily ration and vertical migration of the Cape horse mackerel off South Africa. South African Journal of Marine Science, 19: 263-274. Pinkas, L. 1971. Food habits study. Fishery Bulletin, 152: 5-10. Pires-Vanin, A M. S. & Y. Matsuura. 1993. Estrutura e função do
ecossistema da plataforma continental da região de Ubatuba, Esta-do de São Paulo: Uma introdução. Publicação Especial Esta-do Instituto Oceanográfico, Universidade de São Paulo. São Paulo, 1: 1-8. Saccardo, S. A. 1987. Morfologia, distribuição e abundância de
Trachurus lathami Nichols, 1920 (Teleostei: Carangidae) na região sudeste-sul do Brasil. Boletim do Instituto Oceanográfi-co, Universidade deSão Paulo, São Paulo, 35(1): 65-95. Saccardo, S. A. & M. Katsuragawa. 1995. Biology of the rough scad
Trachurus lathami, on the southeastern coast of Brazil. Scientia Marina, 59(3-4): 265-277.
Sánchez-Vázquez, F. J., J. A. Madrid, S. Zamora & M. Tabata. 1997. Feeding entrainment of locomotor activity rhythms in the goldfish is mediate by a feeding-entrainable circadian oscillator. Journal of Comparative Physiology. A, 181: 121-132.
Santos, M. F. L. 1992. Aspectos ecológicos de Cumacea (Crustacea, Peracarida) da região de Ubatuba, litoral norte do Estado de São Paulo-Brasil. Unpublished Ph.D. Dissertation, Universidade de São Paulo, São Paulo. 151p.
Santos, M. F. L. & A. M. S. Pires-Vanin. 1999. The Cumacea community of the southeastern Brazilian continental shelf: structure and dynamics. Scientia Marina, 63(1): 15-25. Shuntov, V. P. 1969. Some features of the ecology. Journal of
Ichthyology, 9: 801-809.
Soares, L. S. H. & R. Apelbaum. 1994. Atividade alimentar diária da cabrinhaPrionotus punctatus (Teleostei: Triglidae) do litoral de Ubatuba, Brasil. Boletim do Instituto Oceanográfico, Universi-dade de São Paulo, São Paulo, 42(1/2): 85-98.
Suda, Y., T. Machii & H. Orrego. 1995. Some fishery and biological aspects of jack mackerels, genus Trachurus (Carangidae). Scientia Marina, 59(3-4): 571-580.
Vega-Pérez, L. A. 1993. Estudo do zooplâncton da região de Ubatuba, estado de São Paulo. Publicação Especial do Instituto Oceano-gráfico, Universidade de São Paulo, São Paulo, 10: 65-84. Wallace, R.K., Jr. 1981. An assesment of diet overlad indices.
Transaction of American Fisheries Society, 110: 72-76. Wootton, R. J. 1990. Ecology of teleost fishes. London, Chapman
& Hall, 404p.
Zar, J. H. 1996. Biostatistical analysis. 3rd ed., New Jersey, Prentice
Hall, 662p.