Transcriptional profile of fibroblasts obtained from the primary site, lymph
node and bone marrow of breast cancer patients
Paulo Roberto Del Valle
1, Cintia Milani
1, Maria Mitzi Brentani
1, Maria Lucia Hirata Katayama
1,
Eduardo Carneiro de Lyra
2, Dirce Maria Carraro
3, Helena Brentani
4, Renato Puga
3, Leandro A. Lima
3,
Patricia Bortman Rozenchan
1, Bárbara dos Santos Nunes
1, João Carlos Guedes Sampaio Góes
2and Maria Aparecida Azevedo Koike Folgueira
11
Departamento de Radiologia e Oncologia, Faculdade de Medicina, Universidade de São Paulo,
São Paulo, SP, Brazil.
2Instituto Brasileiro do Controle do Câncer, São Paulo, SP, Brazil.
3Centro Internacional de Pesquisa e Ensino, Hospital A.C. Camargo, São Paulo, SP, Brazil.
4
Departamento de Psiquiatria, Faculdade de Medicina, Universidade de São Paulo, São Paulo, SP, Brazil.
Abstract
Cancer-associated fibroblasts (CAF) influence tumor development at primary as well as in metastatic sites, but there have been no direct comparisons of the transcriptional profiles of stromal cells from different tumor sites. In this study, we used customized cDNA microarrays to compare the gene expression profile of stromal cells from primary tumor (CAF, n = 4), lymph node metastasis (N+, n = 3) and bone marrow (BM, n = 4) obtained from breast cancer pa-tients. Biological validation was done in another 16 samples by RT-qPCR. Differences between CAF vs N+, CAF vs BM and N+ vs BM were represented by 20, 235 and 245 genes, respectively (SAM test, FDR < 0.01). Functional analysis revealed that genes related to development and morphogenesis were overrepresented. In a biological vali-dation set, NOTCH2 was confirmed to be more expressed in N+ (vs CAF) and ADCY2, HECTD1, HNMT, LOX, MACF1, SLC1A3 and USP16 more expressed in BM (vs CAF). Only small differences were observed in the transcriptional profiles of fibroblasts from the primary tumor and lymph node of breast cancer patients, whereas greater differences were observed between bone marrow stromal cells and the other two sites. These differences may reflect the activities of distinct differentiation programs.
Keywords: bone marrow, breast neoplasm, fibroblast, gene expression profiling, lymph node, mesenchymal stromal cells, tumor
microenvironment.
Received: December 16, 2013; Accepted: April 19, 2014.
Introduction
Fibroblasts are mesenchymal cells derived from the mesoderm and are involved in maintaining tissue architec-ture. These cells secrete a variety of soluble factors that modulate surrounding cell functions.
Cancer-associated fibroblasts (CAF) are the most prominent cell type in the stroma of primary tumors. These CAFs are qualitatively different from normal fibroblasts (Orimoet al., 2005) and heterotypic interactions between
cancer cells and stromal cells lead to malignant cell prolif-eration and metastasis. Indeed, the loss of tumor suppressor genes such as PTEN (Trimboliet al., 2009) or TP53 (Patocs et al., 2007) in stromal fibroblasts results in the activation
of pathways leading to epithelial cell carcinogenesis or regional node involvement.
The impact of CAFs on patient prognosis provides in-sight into their tumor-specific effects (Paulsson and Micke, 2014). The total fibroblast content of breast tumors and the tumor-stroma ratio (< 50% vs.> 50% stroma) have an
inde-pendent impact on recurrence-free and overall survival (de Kruijf, 2011). A higher proportion ofaSMA myofibroblasts
in breast tumors is also associated with higher proliferation of tumor cells and an unfavorable prognosis (Surowiaket al.,
2007). In addition, a metabolic partnership between cata-bolic fibroblasts and anacata-bolic cancer cells creates a nutri-ent-rich environment, even under hypoxia, that supports tumor growth (Martinez-Outschoornet al., 2014).
Several hypotheses have tried to establish the origin of CAFs. First, it is well known that resident fibroblasts, when in contact with malignant cells, become activated
myofibroblasts that express specific markers suchaSMA
www.sbg.org.br
Send correspondence to Maria Aparecida A. Koike Folgueira. De-partamento de Radiologia e Oncologia, Faculdade de Medicina, Universidade de São Paulo, Avenida Dr. Arnaldo 455, 4º andar, sala 4124, 01246-903 São Paulo, SP, Brazil. E-mail: [email protected].
(alpha smooth muscle actin) (Kalluri and Zeisberg, 2006). Second, epithelial or endothelial cells can trans-differen-tiate to acquire a mesenchymal phenotype in a process known as epithelial or endothelial mesenchymal transition (Petersenet al., 2003; Zeisberget al., 2007; Guarinoet al.,
2009). Third, mesenchymal stem cells (derived from bone marrow or adipose tissue) are recruited to the tumor site to create a favorable microenvironment, in a process similar to wound healing, thereby giving rise to 20-40% of CAFs (Karnoubet al., 2007; Mishraet al., 2008; Shimodaet al.,
2010; Quanteet al., 2011).
In breast cancer, the involvement of regional lymph nodes is associated with poor prognosis (Kimet al., 2006;
Edge and Compton, 2010). Normal lymph nodes contain specific fibroblasts known as reticular cells that are special-ized in maintenance of the nodes reticular fiber architecture and the maturation of lymphocytes that express specific chemokines (Vegaet al., 2006). However, little is known
about the role of fibroblasts in lymph node metastasis. In ac-cordance with the primary tumor site, involved lymph nodes show an altered microenvironment that includes the pres-ence of activated fibroblasts (Yeunget al., 2013). In
addi-tion, lymph node fibroblasts may also induce the prolifera-tion and migraprolifera-tion of breast cancer cells (Santoset al., 2011).
The origin of fibroblasts in metastatic lymph nodes is speculative, but one possibility is that they originate from the same sources hypothesized for the primary tumor site. Moreover, recent observations suggest that cancer cells carry fibroblasts during their migration to metastatic sites such that these co-traveling cells may facilitate tumor pro-gression in secondary organs (Dudaet al., 2010).
Bone marrow (BM) is a common homing organ and a reservoir for disseminated tumor cells in breast cancer (BC). Although only a small fraction of patients present overt BM metastasis, 70% of advanced breast cancer patients develop bone metastasis. Bone marrow is a source of mesenchymal stem cells (MSc) that can give rise to cells of mesodermal lineages (El-Haibi and Karnoub, 2010) such as adipocytes, osteocytes and chondrocytes. Besides playing an important pro-tumorigenic role in the microenvironment of bone me-tastasis (Martinezet al., 2013), these mesenchymal stem
cells can also home to sites of tumorigenesis and integrate into the tumor stroma (El-Haibi and Karnoub, 2010).
It is still unclear whether the transcriptional profile can reveal the cellular origin of CAFs. Given that bone mar-row stromal cells are a candidate progenitor cell source, the main goal of this work was to compare the gene expression profiles of stromal cells from the primary tumor, lymph nodes and bone marrow of breast cancer patients.
Material and Methods
Patients
This study was done in accordance with the Declara-tion of Helsinki (1964) and was approved by the
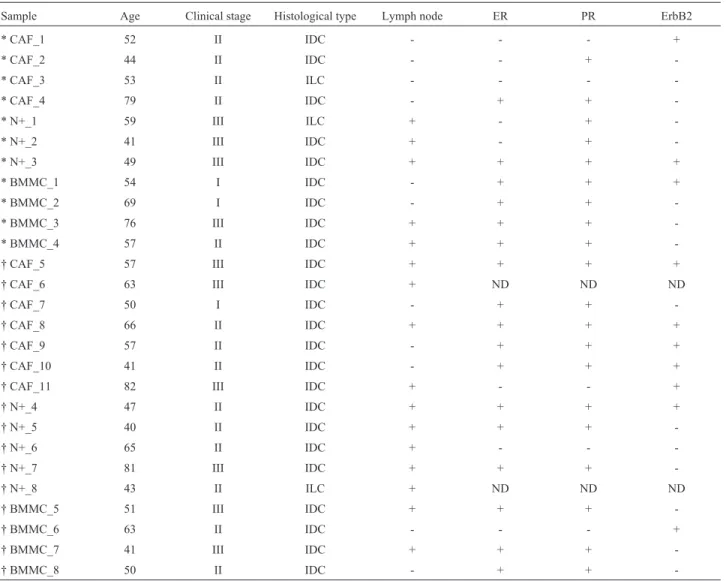
Institu-tional Ethics Committees (Comitê de Ética do Hospital das Clínicas da Faculdade de Medicina da Universidade de São Paulo, CAPPesq process nos. 110/02, 368/03, 102/05, 0848/08 and 055/11; and Comitê de Ética do Instituto Brasileiro do Controle do Câncer; approved on 08/02/2002 and 07/27/2008). Twenty-seven breast cancer patients pro-vided signed informed consent and were enrolled in the study. Samples from 11 patients were destined for microarray experiments and from 16 patients were used in biological validation studies. Primary tumor, lymph node metastasis and bone marrow samples were obtained from 11, 8 and 8 patients, respectively (Table 1). The patients re-ceived no neoadjuvant chemotherapy or radiotherapy prior to sample collection. All patients were treated at the Insti-tuto Brasileiro de Controle do Câncer (IBCC) in São Paulo city, Brazil.
Primary cell culture
All tumor samples (primary tumor, lymph node and bone marrow) were collected during breast surgery. Involve-ment of the primary site and lymph node was confirmed histologically. The samples were cut into small pieces and fibroblast primary cultures were established through explant methodology. The mesenchymal origin of the cells was con-firmed by the expression of vimentin and lack of expression of pan-cytokeratin and CD45. The culture conditions were as previously described (Rozenchanet al., 2009; Santoset al.,
2011; Camposet al., 2013).aSMA expression was detected
in all samples from primary tumor and lymph nodes and has been described in previous reports (Rozenchanet al., 2009;
Santoset al., 2011; Camposet al., 2013).
Bone marrow aspirates from the sternal area were col-lected during the breast surgical procedure. Stromal cells were recovered from the mononuclear cell layer by using a
Ficoll-PaqueTMPlus solution gradient (Amersham
Biosci-ences, Amersham, England) (Sekiya et al., 2002) and
plated in 75 cm2culture flasks. The cultures were main-tained in Iscove’s Modified Dulbecco’s Medium (IMDM) (Gibco, New York, USA), supplemented with HEPES
(25 mM), ampicillin (100 mg/mL), streptomycin
(100 mg/mL) and 10% fetal bovine serum (Gibco).
One-half of the supernatant with non-adherent cells was re-moved weekly and replaced with fresh medium until a con-fluent layer was obtained. After three cell passages, mor-phologically homogeneous cultures containing only fibroblastoid cells were obtained and used for further stud-ies. The mesenchymal origin was confirmed by the expres-sion of human vimentin (clone Vim 3b4, 1:100; Dako Cor-poration, Carpinteria, USA) and lack of expression of CD-45 (clone 2B11/PD7/26, 1:500; Dako) and cytokeratin (AE1/AE3, 1:50; Dako).
Detection of occult tumor cells
cyto-keratin 19 (KRT19) in cDNA samples (Table S1). The sensitivity was determined by serially diluting MDA-MB231 cells that express KRT19 in peripheral blood mononuclear cells from a healthy donor; with this approach it was possible to detect one epithelial tumor cell in a mil-lion. An external amplicon of 798 bp was generated by 35 cycles in the first reaction of the nested-PCR. The product of the first reaction was then subjected to a second amplifi-cation of 30 cycles that generated a final product of 461 bp in bone marrow aspirates containing occult tumor cells.
RNA extraction and reverse transcriptase reaction
Total RNA was extracted using TRIZOL® reagent
(Invitrogen); purity was assessed by measuring the absor-bance at 260 and 280 nm (260/280 ratio > 1.7) and intact-ness was assessed by visualizing the 28S and 18S bands (28S/18S ratio > 1.5) after electrophoresis in 1.5% agarose gels. cDNAs for microarray validation were reverse
tran-scribed from 2mg of total RNA in a 20mL reaction, using
2mL of random hexamers (0.5mg/mL) and 200 U of reverse
transcriptase (Superscript II, Invitrogen).
cDNA microarray assembly, hybridization and analysis
Total RNA from stromal cell primary cultures was processed through a two-round RNA amplification proce-dure done by combining antisense RNA (aRNA) amplifica-tion with a template-switching effect, according to a previously described protocol (Wanget al., 2000; Baughet
al., 2001). Three to five micrograms of aRNA was then
used in a reverse transcriptase reaction in the presence of Cy3- or Cy5-labeled dCTP (GE Heathcare, Piscataway, NJ, USA) and SuperScript II (Invitrogen). The Hb4A normal epithelial mammary cell line was used as a reference. Hy-bridizations were done on customized cDNA microarray Table 1- Patients characteristics.
Sample Age Clinical stage Histological type Lymph node ER PR ErbB2
* CAF_1 52 II IDC - - - +
* CAF_2 44 II IDC - - +
-* CAF_3 53 II ILC - - -
-* CAF_4 79 II IDC - + +
-* N+_1 59 III ILC + - +
-* N+_2 41 III IDC + - +
-* N+_3 49 III IDC + + + +
* BMMC_1 54 I IDC - + + +
* BMMC_2 69 I IDC - + +
-* BMMC_3 76 III IDC + + +
-* BMMC_4 57 II IDC + + +
-† CAF_5 57 III IDC + + + +
† CAF_6 63 III IDC + ND ND ND
† CAF_7 50 I IDC - + +
-† CAF_8 66 II IDC + + + +
† CAF_9 57 II IDC - + + +
† CAF_10 41 II IDC - + + +
† CAF_11 82 III IDC + - - +
† N+_4 47 II IDC + + + +
† N+_5 40 II IDC + + +
-† N+_6 65 II IDC + - -
-† N+_7 81 III IDC + + +
-† N+_8 43 II ILC + ND ND ND
† BMMC_5 51 III IDC + + +
-† BMMC_6 63 II IDC - - - +
† BMMC_7 41 III IDC + + +
-† BMMC_8 50 II IDC - + +
slides containing 4608 human genes (Brentaniet al., 2005)
(GEO accession number GPL1930) in a GeneTac Hybrid-ization Station (Genomic Solutions). Dye swap was done for each sample analyzed to control for dye bias. Hybridiza-tion was done at 65 °C. Hybridized arrays were scanned with a confocal laser scanner (Arrayexpress, PerkinElmer Life and Analytical Science Inc., Boston, MA, USA) and the data were recovered with Quantarray software (PerkinElmer). Quantified signals were then submitted to log transformation and to Lowess normalization.
Microarray data analysis
To identify differences among stromal cells from pri-mary tumor, lymph node and bone marrow, data obtained from the three sites were normalized together and only genes present in 100% of the samples were submitted to SAM (significance analysis of microarray) multiclass sta-tistical test using FDR < 0.01. Subsequently, to identify specific differences, differentially expressed genes were further analyzed with the SAM two class test, with FDR < 0.01. Hierarchical clustering based on Euclidian distances and complete linkage was done using the differ-entially expressed genes, with reliability assessed by the bootstrap technique (TMEV software). Functional analysis was done using the DAVID (Database for Annotation, Vi-sualization and Integrated Discovery) v.6.7 and IPA
(Inge-nuity Pathway Analysis©, Ingenuity Systems, Inc.). To
identify differences in bone marrow according to the pres-ence of occult cells, we used the HT self-self statistical test for low sample numbers (Vêncio and Koide, 2005).
RT-qPCR
Primer sets were designed using Primer Blast (Table S1). Sequences present in different exons were selected. Quantitative RT-PCR was done using a Power Sybr Green PCR master mix (Applied Biosystems) in an ABI HT 7900 thermo cycler (Applied Biosystems). All samples were tested in duplicate and average values were used for quanti-fication. Relative expression was calculated by the 2-DDCt method (Livak and Schmittgen, 2001). The gene PPIA was selected as a reference gene and the Ct average (for the same transcript) of all samples was used as a reference.
Results
Patients
Twenty-seven patients provided written informed consent and were enrolled in the study. Patient age ranged from 40 to 82 years (median: 54 years). According to the clinical stage, the majority (17 patients) were stage II, ten patients were stage III and three were stage I. Sixteen pa-tients had lymph node metastasis at surgery. Immuno-histochemical evaluation of the tumors indicated that five patients were negative for hormonal receptors (estrogen or progesterone receptors), whereas 20 patients were positive
for at least one hormonal receptor, 15 patients were nega-tive and ten patients were posinega-tive for the ErbB2 receptor; it was not possible to evaluate the receptor status of two pa-tients (Table 1).
Influence of occult tumor cells in primary cultures of bone marrow mesenchymal cells
As bone marrow may be a homing organ and a reser-voir for disseminated tumor cells in breast cancer, we used nested-PCR to screen bone marrow aspirates for cytoke-ratin 19 expression, a marker of occult tumor cells. Among eight patients who had bone marrow aspirates collected during surgery, three tested positive for cytokeratin 19 ex-pression (BMMC_3, BMMC_4, BMMC_6, Table 1).
We then examined whether bone marrow mesen-chymal cell gene expression was associated with the pres-ence of occult malignant cells in bone marrow. After establishing primary cultures, samples from two patients with lymph node involvement and the presence of occult tumor cells in bone marrow and samples from two patients with no lymph node involvement and a lack of occult tumor cells were selected. Twenty-one differentially expressed genes with a 1.38- to 7.20-fold change in expression were identified and included nine upregulated (PTHLH, TLOC1, NCOA6, C17orf57, ANAPC11, MAST4, POLR3E, CPNE1 and B4GALT5) and 12 downregulated (MRPL2, NAT10, DAP, RNF2, FLOT2, FKBP10, SLIT3, EBNA1BP2, SLC35B2, MICAL2, GPR3 and TSPAN17) genes in bone marrow mesenchymal cells from patients with occult tumor cells. However, none of the selected genes were confirmed as differentially expressed when evaluated by RT-qPCR (data not shown). These results in-dicate that the presence of occult malignant cells does not significantly affect the molecular characteristics of bone marrow stromal cells.
Gene expression profile of mesenchymal cells from bone marrow, primary tumor and lymph node
the cell origin, a second analysis was done by comparing two groups at a time using the SAM two-class test.
Comparison of fibroblasts obtained from the primary tumor and lymph node identified 20 differentially ex-pressed genes (eight less exex-pressed and 12 more exex-pressed in the primary tumor). When fibroblasts from the primary tumor and bone marrow were compared, 235 differentially expressed genes were observed (101 less expressed and 134 more expressed in bone marrow), and when fibroblasts from lymph node and bone marrow were compared, 245 differentially expressed genes were identified (105 less ex-pressed and 140 more exex-pressed in bone marrow stromal cells) (Table S2). These findings showed that (1) the gene expression profiles of CAFs and N+ were quite similar, (2) the majority of genes were differentially expressed in com-parisons of stromal cells from each of these two tumor sites (CAFs and N+) with bone marrow mesenchymal cells, and (3) bone marrow stromal cells had the most differential pro-file among the three sites (Table S2).
Functional annotation and selection of candidate genes
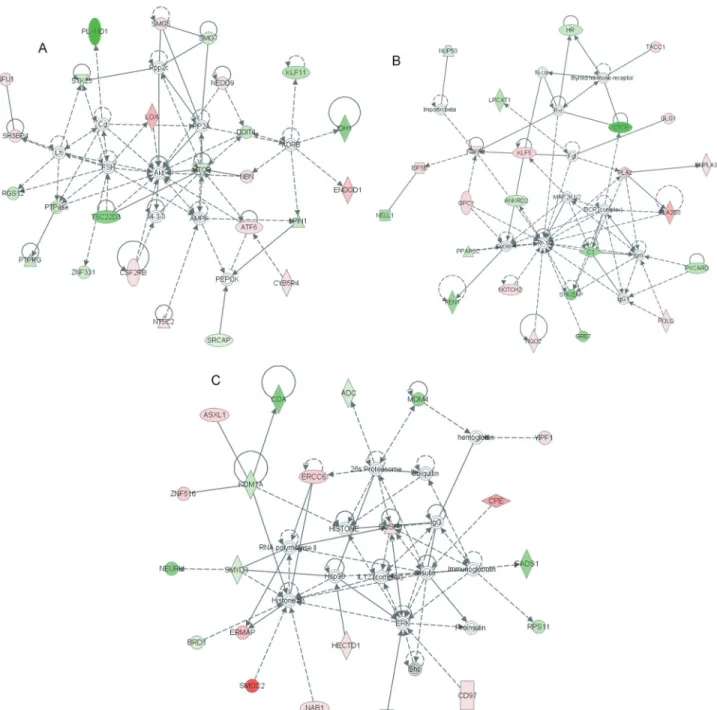
An important issue when analyzing gene lists is to de-tect enriched functions. For this analysis, the 267 genes dif-ferentially expressed among bone marrow mesenchymal cells, CAFs and N+, were grouped as more expressed in bone marrow stromal cells and more expressed in CAFs and N+. These genes were then used as input data and bio-logical processes from Gene Ontology were screened for enrichment. Functions enriched among genes less pressed in bone marrow mesenchymal cells (and more ex-pressed in CAFs and N+) included negative regulation of nucleobase, nucleoside, nucleotide and nucleic acid meta-bolic processes, negative regulation of transcription and apoptosis (Table S3) and functions enriched among genes more expressed in bone marrow mesenchymal cells (as compared with CAFs or N+) included mesoderm forma-tion, response to wounding, regeneration and embryonic morphogenesis, with the latter including only a few genes such as NOTCH2, EYA2, MACF1, TXNRD1, C17ORF28 and HECTD1 (Table S4). In agreement with these findings, Ingenuity Pathway Analysis (IPA) indicated a high score for networks composed of genes related to skeletal and muscular system development (Figure 2A), connective tis-sue disorders (Figure 2B) and cellular development (Figu-re 2C), as well as other networks (Figu-related to development (Table S5).
Expression of candidate genes in another series of samples
The expression of some genes (ADCY2, ANTXR1, CYR61, DNAH1, DUSP1, FGFR1, HECTD1, HNMT, KLF5, LOX, MACF1, MYH9, NOTCH2, SLC1A3, TACC1, TXNRD1 and USP16) was also evaluated by an-other methodology (RT-qPCR) in some samples not
lyzed by microarray (biological validation set, indicated in Table 1). The selection of these genes was based on their re-lation to morphogenesis and differentiation, or on a fold-change in expression > 2. In this analysis, NOTCH2 and SLC1A3 were significantly more expressed in fibroblasts from lymph nodes (N+) when compared to primary tumor samples (CAF) (Figure 3A); ADCY2 and SLC1A3 were
confirmed more expressed in bone marrow (BMMC) than in primary tumor fibroblasts (CAF) (Figure 3B) and ADCY2 was significantly more expressed in bone marrow stromal cells (BMMC) when compared to lymph node fibroblasts (N+) (Figure 3C).
son between primary tumor and bone marrow stromal cells, the expression of other genes was further tested in samples of the biological validation set from these tumor sites. This analysis confirmed that HECTD1, HNMT, LOX, MACF1 and USP16 were more expressed in bone marrow stromal cells (Figure 3D).
Discussion
The main goal of this work was to compare the gene expression profiles of stromal cells from the primary tumor, lymph node and bone marrow of breast cancer patients. In this analysis, 267 genes were differentially expressed among fibroblasts from primary tumor, lymph node and bone marrow. These genes represented ~8% of the genes analyzed and appropriately discriminated among fibro-blasts according to their origin. In contrast to small trans-criptional differences between fibroblasts from the primary tumor and lymph nodes, a marked difference was observed when fibroblasts from these two sites were compared with bone marrow mesenchymal cells.
Transcriptional profile analysis has shown that fibro-blasts from different anatomic sites and distinct donors
ex-hibit topographic differentiation (Chang et al., 2002).
Moreover, the fibroblast gene expression program follows a specific anatomic segmentation pattern that is homoge-neous among samples, regardless of differences among host tissue donors (Rinnet al., 2006). These observations
indicate that the positional memory of fibroblasts may be determined during embryogenesis. In the case of lymph
node reticular cells, transcriptional differences were also observed in early passages, when compared to dermal fibroblasts; such differences can affect nearly 8% of ana-lyzed genes (Vegaet al., 2006). In addition, differences in
the transcription profile of reticular cells from lymph nodes obtained from different organs have also been observed (Fletcheret al., 2011). In this case, topographic differences,
which were greater than differences among tissue donors,
probably involved the HOX gene family (Chang et al.,
2002; Rinnet al., 2006).
Unexpectedly, only a small transcriptional difference (~0.6% of the arrayed genes) was observed as differentially expressed between fibroblasts from the primary tumor and lymph node compared to a more striking difference be-tween bone marrow stromal cells and fibroblasts from the other two sites. Similarity between the gene expression pro-files of fibroblasts from these two sites could be explained by the presence of tumor cells that modulate their micro-environment in a similar way in the primary tumor and lymph node. Cancer cells are known to release growth
fac-tors,e.g., bFGF, VEGF, PDGF, EGF, TGFB and others,
that modulate fibroblast functions such as proliferation and activation (Mueller and Fusenig, 2004; Kalluri and Zeis-berg, 2006). In addition, malignant cells may markedly in-fluence the CAF gene expression pattern (Rozenchanet al.,
2009; Santoset al., 2011) and their metabolism (Pavlideset al., 2009; Sotgiaet al., 2012).
However, this similarity may also be explained by the fibroblasts origin that involves a common source, including
Figure 3- Gene expression of fibroblast samples. (A) Primary tumor (CAF, n = 6 or 7)vs.lymph node (N+, n = 3 or 4). (B) Primary tumor (CAF, n = 6 or
7)vs.bone marrow (BMMC, n = 3 or 4). (C) Lymph node (N+, n = 3 or 4)vs.bone marrow (BMMC, n = 3 or 4). (D) Primary tumor (CAF, n = 3)vs.bone marrow (BMMC, n = 3). Relative expression based on 2-DDCt. PPIA was used as a reference gene, and average Ct values for the same transcript were used
the epithelial-mesenchymal transition, the co-migration of CAFs and cancer cells to metastatic sites, and the migration and differentiation of mesenchymal stem cells from the bone marrow to tumor sites. None of these is necessarily exclusive, but may occur simultaneously, in different pro-portions, during tumor-stroma co-evolution (Hanahan and Weinberg, 2011).
Up to 20% of tumor-associated fibroblasts may
origi-nate from bone marrow mesenchymal stem cells (Quanteet
al., 2011). By using a mouse model of gastric cancer and
the tracking of bone marrow mesenchymal stem cells with a reporter gene that allows their discrimination from resi-dent cells in the tumor microenvironment, it was shown that only myofibroblasts derived from bone marrow mesen-chymal stem cells could survive more than four passages in culture; resident myofibroblasts could not survive beyond the fourth passage (Quanteet al., 2011).In addition, condi-tioned media from cancer cells can influence the differenti-ation of mesenchymal stem cells into CAFs (Mishraet al.,
2008).
In agreement with these findings, in the present work the expression of some genes involved in mesoderm forma-tion, response to wounding, regeneration and embryonic morphogenesis was enhanced in bone marrow mesen-chymal cells when compared with CAF or N+. These genes include HECTD1 (HECT domain containing E3 ubiquitin protein ligase 1), involved in negative regulation of the
Wnt-Axin pathway (Tran et al., 2013), MACF1
(micro-tubule-actin crosslinking factor 1) involved in the regula-tion of cell migraregula-tion after ErbB2 stimularegula-tion (Benseddiket
al., 2013), LOX (lysyl oxidase) involved in creating a
fibrotic environment favorable to tumor cell colonization (Cox et al., 2013) and SLC1A3 (solute carrier family 1
[glial high affinity glutamate transporter], member 3) in-volved in the response to wounding. The genes ADCY2 (adenylate cyclase 2 [brain]) involved in signal transduc-tion from membrane receptors, HNMT (histamine N-methyltransferase) involved in histamine metabolism and USP16 (ubiquitin specific peptidase 16) involved in histone deubiquitination and cell cycle were also found to be more expressed in bone marrow mesenchymal cells.
This work represents the first attempt to characterize the transcriptional profiles of fibroblasts from different sites in breast cancer patients, including primary cultures of stromal cells from bone marrow and lymph node, which are very difficult to establish and maintain in culture. The ma-jority of studies that have investigated the origin of cancer fibroblasts have used mice (Quanteet al., 2011; Kiddet al.,
2012) and their findings are sometimes difficult to translate to humans. On the other hand, studies that have examined the differentiation of bone marrow mesenchymal cells to CAFs have used mainly bone marrow from health donors and have not considered the influence of the tumor on this site (Mishraet al., 2008). One of the shortcomings of the
present study was the incomplete agreement between the
expression data obtained by microarray and RT-qPCR. One possible explanation for this discrepancy is that fibroblast primary cultures change their transcriptional pattern over
time, especially lymph node stromal cells (Vega et al.,
2006), and the RT-qPCR expression data were obtained from fibroblasts in later passages than those used for the microarray. Although unpaired samples were used in this work, it was previously shown that samples obtained from different sites of the same individual, or subjected to differ-ential experimental conditions, may cluster together (50% of the samples) or in different branches (another 50%) (Folgueiraet al., 2005; Perouet al., 2000), thereby blurring
transcriptional differences attributed to tissue specificities. In the present work, the analysis of unpaired tissue samples allowed the identification of differentially expressed genes that were homogeneously expressed within the groups.
In summary, only small differences were observed in the transcriptional profiles of fibroblasts from the primary tumor and lymph node of breast cancer patients. In contrast, the difference in gene expression between these two tissues and bone marrow stromal cells was much greater. The dif-ferentially expressed genes identified here may reflect a distinct differentiation profile or adaptations that bone mar-row mesenchymal cells may undergo to become CAFs. However, functional studies are needed to confirm the in-fluence of these genes in the differentiation of bone marrow mesenchymal cells into CAFs.
Acknowledgments
The authors thank Cristina Piñeiro Grandal for edit-ing the figures. This work was supported by Fundação de Amparo à Pesquisa do Estado de São Paulo (FAPESP), Coordenação de Aperfeiçoamento de Pessoal de Nível Su-perior (CAPES) and Conselho Nacional de Desenvolvi-mento Científico e Tecnológico (CNPq).
References
Baugh LR, Hill AA, Brown EL and Hunter CP (2001) Quantita-tive analysis of mRNA amplification by in vitro transcrip-tion. Nucleic Acids Res 29:E29.
Benseddik K, Sen Nkwe N, Daou P, Verdier-Pinard P and Ba-dache A (2013) ErbB2-dependent chemotaxis requires microtubule capture and stabilization coordinated by dis-tinct signaling pathways. PLoS One 8:e55211.
Brentani RR, Carraro DM, Verjovski-Almeida S, Reis EM, Neves EJ, de Souza SJ, Carvalho AF, Brentani H and Reis LF (2005) Gene expression arrays in cancer research: Methods and applications. Crit Rev Oncol Hematol 54:95-105. Campos LT, Brentani H, Roela RA, Katayama ML, Lima L,
Rolim CF, Milani C, Folgueira MA and Brentani MM (2013) Differences in transcriptional effects of 1a,25 dihy-droxyvitamin D3 on fibroblasts associated to breast carcino-mas and from paired normal breast tissues. J Steroid Biochem Mol Biol 133:12-24.
differentia-tion, and positional memory in human fibroblasts. Proc Natl Acad Sci USA 99:12877-12882.
Cox TR, Bird D, Baker AM, Barker HE, Ho MW, Lang G and Erler JT (2013) LOX-mediated collagen crosslinking is re-sponsible for fibrosis-enhanced metastasis. Cancer Res 73:1721-1732.
de Kruijf EM, van Nes JG, van de Velde CJ, Putter H, Smit VT, Liefers GJ, Kuppen PJ, Tollenaar RA and Mesker WE (2011) Tumor-stroma ratio in the primary tumor is a prog-nostic factor in early breast cancer patients, especially in tri-ple-negative carcinoma patients. Breast Cancer Res Treat 125:687-696.
Duda DG, Duyverman AM, Kohno M, Snuderl M, Steller EJ, Fukumura D and Jain RK (2010) Malignant cells facilitate lung metastasis by bringing their own soil. Proc Natl Acad Sci USA 107:21677-21682.
Edge SB and Compton CC (2010) The American Joint Committee on Cancer: The 7th edition of the AJCC cancer staging man-ual and the future of TNM. Ann Surg Oncol 17:1471-1474. El-Haibi CP and Karnoub AE (2010) Mesenchymal stem cells in the pathogenesis and therapy of breast cancer. J Mammary Gland Biol Neoplasia 15:399-409.
Fletcher AL, Malhotra D, Acton SE, Lukacs-Kornek V, Belle-mare-Pelletier A, Curry M, Armant M and Turley SJ (2011) Reproducible isolation of lymph node stromal cells reveals site-dependent differences in fibroblastic reticular cells. Front Immunol 2:35.
Folgueira MA, Carraro DM, Brentani H, Patrão DF, Barbosa EM, Netto MM, Caldeira JR, Katayama ML, Soares FA, Oliveira CT,et al.(2005) Gene expression profile associated with
re-sponse to doxorubicin-based therapy in breast cancer. Clin Cancer Res 11:7434-7443.
Guarino M, Tosoni A and Nebuloni M (2009) Direct contribution of epithelium to organ fibrosis: Epithelial-mesenchymal transition. Hum Pathol 40:1365-1376.
Hanahan D and Weinberg RA (2011) Hallmarks of cancer: The next generation. Cell 144:646-674.
Kalluri R and Zeisberg M (2006) Fibroblasts in cancer. Nat Rev Cancer 6:392-401.
Karnoub AE, Dash AB, Vo AP, Sullivan A, Brooks MW, Bell GW, Richardson AL, Polyak K, Tubo R and Weinberg RA (2007) Mesenchymal stem cells within tumour stroma pro-mote breast cancer metastasis. Nature 449:557-563. Kidd S, Spaeth E, Watson K, Burks J, Lu H, Klopp A, Andreeff M
and Marini FC (2012) Origins of the tumor micro-environment: Quantitative assessment of adipose-derived and bone marrow-derived stroma. PLoS One 7:e30563. Kim SI, Park BW and Lee KS (2006) Comparison of
stage-specific outcome of breast cancer based on 5th and 6th AJCC staging system. J Surg Oncol 93:221-227.
Livak KJ and Schmittgen TD (2001) Analysis of relative gene ex-pression data using real-time quantitative PCR and the 2(-DDCT) method. Methods 25:402-408.
Martinez LM, Vallone VB, Labovsky V, Choi H, Hofer EL, Feldman L, Bordenave RH, Batagelj E, Dimase F, Villafane AR,et al.(2013) Changes in the peripheral blood and bone marrow from untreated advanced breast cancer patients that are associated with the establishment of bone metastases. Clin Exp Metastasis 31:213-232.
Martinez-Outschoorn UE, Lisanti MP and Sotgia F (2014) Cata-bolic cancer-associated fibroblasts transfer energy and
bio-mass to anabolic cancer cells, fueling tumor growth. Semin Cancer Biol 25C:47-60.
Mishra PJ, Humeniuk R, Medina DJ, Alexe G, Mesirov JP, Gane-san S, Glod JW and Banerjee D (2008) Carcinoma-asso-ciated fibroblast-like differentiation of human mesenchymal stem cells. Cancer Res 68:4331-4339.
Mueller MM and Fusenig NE (2004) Friends or foes - Bipolar ef-fects of the tumour stroma in cancer. Nat Rev Cancer 4:839-849.
Orimo A, Gupta PB, Sgroi DC, Arenzana-Seisdedos F, Delaunay T, Naeem R, Carey VJ, Richardson AL and Weinberg RA (2005) Stromal fibroblasts present in invasive human breast carcinomas promote tumor growth and angiogenesis through elevated SDF-1/CXCL12 secretion. Cell 121:335-348.
Patocs A, Zhang L, Xu Y, Weber F, Caldes T, Mutter GL, Platzer P and Eng C (2007) Breast-cancer stromal cells with TP53 mutations and nodal metastases. N Engl J Med 357:2543-2551.
Paulsson J and Micke P (2014) Prognostic relevance of can-cer-associated fibroblasts in human cancer. Semin Cancer Biol 25C:61-68.
Pavlides S, Whitaker-Menezes D, Castello-Cros R, Flomenberg N, Witkiewicz AK, Frank PG, Casimiro MC, Wang C, Fortina P, Addya S,et al.(2009) The reverse Warburg
ef-fect: Aerobic glycolysis in cancer associated fibroblasts and the tumor stroma. Cell Cycle 8:3984-4001.
Perou CM, Sorlie T, Eisen MB, van de Rijn M, Jeffrey SS, Rees CA, Pollack JR, Ross DT, Johnsen H, Akslen LA,et al.
(2000) Molecular portraits of human breast tumours. Nature 406:747-752.
Petersen OW, Nielsen HL, Gudjonsson T, Villadsen R, Rank F, Niebuhr E, Bissell MJ and Ronnov-Jessen L (2003) Epithe-lial to mesenchymal transition in human breast cancer can provide a nonmalignant stroma. Am J Pathol 162:391-402. Quante M, Tu SP, Tomita H, Gonda T, Wang SS, Takashi S, Baik
GH, Shibata W, Diprete B, Betz KS,et al.(2011) Bone mar-row-derived myofibroblasts contribute to the mesenchymal stem cell niche and promote tumor growth. Cancer Cell 19:257-272.
Rinn JL, Bondre C, Gladstone HB, Brown PO and Chang HY (2006) Anatomic demarcation by positional variation in fibroblast gene expression programs. PLoS Genet 2:e119. Rozenchan PB, Carraro DM, Brentani H, de Carvalho Mota LD,
Bastos EP, Ferreira EN, Torres CH, Katayama ML, Roela RA, Lyra EC,et al.(2009) Reciprocal changes in gene
ex-pression profiles of cocultured breast epithelial cells and pri-mary fibroblasts. Int J Cancer 125:2767-2777.
Santos RP, Benvenuti TT, Honda ST, Del Valle PR, Katayama ML, Brentani HP, Carraro DM, Rozenchan PB, Brentani MM, de Lyra EC,et al.(2011) Influence of the interaction
between nodal fibroblast and breast cancer cells on gene ex-pression. Tumour Biol 32:145-157.
Sekiya I, Larson BL, Smith JR, Pochampally R, Cui JG and Prockop DJ (2002) Expansion of human adult stem cells from bone marrow stroma: Conditions that maximize the yields of early progenitors and evaluate their quality. Stem Cells 20:530-541.
Sotgia F, Whitaker-Menezes D, Martinez-Outschoorn UE, Flo-menberg N, Birbe RC, Witkiewicz AK, Howell A, Philp NJ, Pestell RG and Lisanti MP (2012) Mitochondrial metabo-lism in cancer metastasis: Visualizing tumor cell mitochon-dria and the “reverse Warburg effect” in positive lymph node tissue. Cell Cycle 11:1445-1454.
Surowiak P, Murawa D, Materna V, Maciejczyk A, Pudelko M, Ciesla S, Breborowicz J, Murawa P, Zabel M, Dietel M,et al.(2007) Occurence of stromal myofibroblasts in the
inva-sive ductal breast cancer tissue is an unfavourable prognos-tic factor. Anprognos-ticancer Res 27:2917-2924.
Tran H, Bustos D, Yeh R, Rubinfeld B, Lam C, Shriver S, Zilberleyb I, Lee MW, Phu L, Sarkar AA, et al. (2013)
HectD1 E3 ligase modifies adenomatous polyposis coli (APC) with polyubiquitin to promote the APC-axin interac-tion. J Biol Chem 288:3753-3767.
Trimboli AJ, Cantemir-Stone CZ, Li F, Wallace JA, Merchant A, Creasap N, Thompson JC, Caserta E, Wang H, Chong JL,et al.(2009) Pten in stromal fibroblasts suppresses mammary epithelial tumours. Nature 461:1084-1091.
Vega F, Coombes KR, Thomazy VA, Patel K, Lang W and Jones D (2006) Tissue-specific function of lymph node fibro-blastic reticulum cells. Pathobiology 73:71-81.
Wang E, Miller LD, Ohnmacht GA, Liu ET and Marincola FM (2000) High-fidelity mRNA amplification for gene profil-ing. Nat Biotechnol 18:457-459.
Yeung TM, Buskens C, Wang LM, Mortensen NJ and Bodmer WF (2013) Myofibroblast activation in colorectal cancer lymph node metastases. Br J Cancer 108:2106-2115. Zeisberg EM, Potenta S, Xie L, Zeisberg M and Kalluri R (2007)
Discovery of endothelial to mesenchymal transition as a
source for carcinoma-associated fibroblasts. Cancer Res 67:10123-10128.
Internet Resources
Primer Blast, http://www.ncbi.nlm.nih.gov/tools/primer-blast. DAVID (Database for Annotation, Visualization and Integrated
Discovery) v.6.7, http://david.abcc.ncifcrf.gov/tools.jsp (ac-cess date - Sept 14, 2013).
Supplementary Material
The following online material is available for this article: Table S1 - Primers used in this work.
Table S2 - Differentially expressed genes.
Table S3 - Functional annotation of biological processes of less expressed genes in stromal cells derived from bone marrow.
Table S4 - Functional annotation of biological processes of more expressed genes in stromal cells derived from bone marrow.
Table S5 - Top networks observed in Ingenuity Pathway Analysis (IPA).
Figure S1 - Heat map of differentially expressed genes that gave no signal.
This material is available as part of the online article from http://www.scielo.br/gmb.
Associate Editor: Jeremy A. Squire