Universidade Federal de Minas Gerais Instituto de Ciências Biológicas
Programa de Pós-Graduação em Ecologia, Conservação e Manejo de Vida Silvestre
Tese de Doutorado
R
ELAÇÕES DE HABITATS FÍSICOS
,
PARÂMETROS FÍSICOS E QUÍMICOS
DA ÁGUA COM RIQUEZA
,
DISTRIBUIÇÃO E CONTEÚDO ALIMENTAR DE
MACROINVERTEBRADOS BENTÔNICOS EM RIACHOS DE CABECEIRA NO
C
ERRADO
WANDER RIBEIRO FERREIRA
Relações de fatores ambientais de habitats físicos com riqueza, distribuição e conteúdo alimentar de macroinvertebrados bentônicos em riachos de
cabeceira no Cerrado
Tese apresentada ao Programa de Pós-Graduação em Ecologia, Conservação e Manejo de Vida Silvestre do Instituto de Ciências Biológicas da Universidade Federal de Minas Gerais, como requisito parcial para obtenção do título de Doutor em Ecologia.
Orientador: Prof. Dr. Marcos Callisto (UFMG)
Co-orientador: Prof. Dr. Leandro Gonçalves Oliveira (UFG)
Financiamentos e apoios:
Bolsa:
Ciência e sabedoria são coisas muito diferentes.
Ciência é conhecimento do mundo. Sabedoria é
degustação do mundo. A ciência se faz com os
olhos. A sabedoria, com a boca.
I
A
GRADECIMENTOS
Esta tese representa uma trajetória de muita dedicação e é mérito de um esforço em conjunto de pessoas que me apoiaram ao longo de toda a minha permanência no Laboratório de Ecologia de Bentos. Deixo aqui os meus sinceros agradecimentos:
Ao Professor Marcos Callisto que me orientou e não mediu esforços em me ajudar ao longo da minha carreira acadêmica abrindo portas, criando oportunidades e apontando caminhos. Muito obrigado pelo apoio, amizade e confiança durante todos esses anos. Deixo aqui a minha imensa admiração e gratidão.
Ao meu co-orientador Professor Leandro Gonçalves Oliveira pelo apoio e amizade e participação na realização desta tese.
À CAPES pela bolsa.
Aos Amigos João Lopes e Fernanda da CEMIG pelo apoio e parceria.
Aos amigos e parceiros Bob Hughes e Phil Kaufmann pelo apoio, colaboração e importantes contribuições nos manuscritos desta tese. Por receberem em suas casas, eu e meus amigos, em um momento de muita alegria durante um Workshop realizado no US-EPA em Corvallis em 2011.
Ao amigo e parceiro Carlos Bernardo (CBM Alves – Cacá) pela amizade e apoio. Sempre acreditou em nosso trabalho nos prestigiando com suas palavras incentivadoras e sempre de bom humor com suas piadas.
II
companheiros que tive o prazer de compartilhar muitas alegrias em campo. Às amigas Gisele e Marina pela simpatia e apoio. Ao amigo José Francisco Gonçalves Junior que hoje é Professor na UNB, pelos vários conselhos e por quem tenho admiração. À amiga Josi, hoje Professora na UEPB, pelo carinho e apoio. Às amigas Laryssa e Rafaela da Paraíba pelo carinho e convivência. Agradeço a todos esses amigos que de alguma forma contribuíram para que eu me tornasse uma pessoa melhor.
Em especial à minha esposa e companheira Elaine por quem tenho muito amor e admiração. Sempre me apoiou nos momentos difíceis, valorizando o meu trabalho. Dela tenho absorvido e aprendido muito da sua experiência de vida, dedicação, perseverança, humildade e carisma. Agradeço muito a Deus por tê-la colocado em meu caminho tornando-a minha companheira.
Em especial ao meu irmão Wellington, amigo e companheiro, pelo apoio. Ele é um dos responsáveis por eu ter chegado até aqui. Sempre me fez acreditar no caminho dos estudos e sempre insistiu com bons conselhos para que eu estudasse na busca de conhecimento e profissionalismo.
Aos meus Pais e irmãos e parentes que sempre expressaram amor e carinho por mim. Tenho muito orgulho de todos.
Aos amigos da UFLA (laboratório do Professor Paulo Pompeu), PUC-Minas (laboratório do Professor Gilmar Santos) e CEFET-MG (Professora Hersília Santos e seus orientandos), parceiros de projeto. Pessoas que tive o maior prazer de conhecer e que tive muitas alegrias nos trabalhos em campo.
III
À Renata Ferreira e equipe da Fundep, pelo apoio e gerenciamento de nossos projetos.
Aos membros da banca avaliadora: Professores Manuel Graça, Luiz Hepp, Etham Barbosa, José Francisco Gonçalves Junior, José Fernandes e Paulina Barbosa. Por quem eu tenho muita admiração.
Aos meus amigos do mestrado na Unimontes pelo companheirismo e intercâmbio cultural. Aos professores dos quais eu tive o prazer de ser aluno.
Aos coordenadores do Projeto Manuelzão, motoristas e demais colegas pelo apoio e parceria.
À Deus por ter me proporcionado a alegria da construção de uma história de vida com todos vocês.
Muito obrigado!
IV
SUMÁRIO
RESUMO ... 1
ABSTRACT ... 3
INTRODUÇÃO ... 5
CONTEXTUALIZAÇÃO ... 9
OBJETIVOS ... 10
ÁREA DE ESTUDO E SÍNTESE DO PROCEDIMENTO AMOSTRAL ... 11
REFERÊNCIAS BIBLIOGRÁFICAS ... 15
CAPÍTULO 1 Importance of environmental factors on the richness and distribution of benthic macroinvertebrates in tropical headwater streams ……….. 22 CAPÍTULO 2 Is the diets of a typical shredder related to the physical habitat of headwaters streams in the Brazilian Cerrado? ...……… 55 CONCLUSÕES ………. 80
PERSPECTIVAS FUTURAS ……….. 81
1
RESUMO
Os ecossistemas lóticos são heterogêneos e complexos. As condições físicas variam da nascente à foz, incluindo características da largura, profundidade, declividade, velocidade de fluxo, temperatura e energia. Estas variações e dinâmica de nutrientes contribuem para determinar a composição funcional e distribuição de macroinvertebrados. Os objetivos desta tese foram avaliar o quanto as variáveis ambientais de habitats físicos explicam (i) a riqueza e distribuição de Ephemeroptera, Plecoptera e Trichoptera (EPT) e (ii) os itens alimentares encontrados no conteúdo estomacal de larvas de Phylloicus (Plecoptera: Calamoceratidae). Foram amostradas comunidades de macroinvertebrados bentônicos, quantificados os habitat físicos e mensurados parâmetros físicos e químicos de qualidade de água em 80 sítios amostrais selecionados aleatoriamente em duas bacias hidrográficas no Cerrado (alto rio Araguari e alto rio São Francisco), sudeste do Brasil. Métricas de habitats como largura do leito sazonal, porcentagem de seixos, proporção de abrigos, declividade, porcentagem de trechos com fluxo lento, largura média da área molhada e oxigênio dissolvido foram selecionadas por modelos de regressão múltipla (MLR) e contribuíram significativamente para explicar a riqueza de EPT em ambas as bacias. Métricas de habitats físicos foram mais importantes do que parâmetros de qualidade de água na estruturação de gêneros de EPT nas duas bacias. Foi estudada a dieta de Phylloicus
2
do alto rio Araguari e variou entre riachos e entre instares nas duas bacias; material mineral foi maior no conteúdo das larvas nos riachos na bacia alto rio Araguari e variou entre riachos nas duas bacias. As principais métricas de habitats físicos relacionadas aos itens alimentares foram largura média do leito sazonal, largura média x profundidade, porcentagem de matéria orgânica total, cobertura ripária e presença de abrigo como pedaços de madeira grande. As larvas de Phylloicus apresentaram diferentes estratégias de alimentação nas duas bacias. Esta tese evidenciou a importância dos habitats físicos na distribuição da riqueza de EPT e as relações dos habitats com o conteúdo do trato digestivo de larvas de Phylloicus. Os resultados desta tese contribuem com informações das influências de habitats físicos para estruturação de comunidades de macroinvertebrados bentônicos e grupos tróficos funcionais em ecossistemas aquáticos.
3
ABSTRACT
Stream ecosystems are heterogeneous and complex. The physical conditions vary from headwater to mouth, including characteristics of width, depth, slope, flow velocity, temperature and energy. These variations and nutrient dynamics contribute to determine the functional composition and distribution of macroinvertebrates. The objectives of this thesis were to assess how environmental variables of physical habitats explain (i) the richness and distribution of Ephemeroptera, Plecoptera and Trichoptera (EPT) and (ii) the food items found in the stomach contents of larvae of Phylloicus
4
physical habitat metrics related to food items were mean bankfull width, mean width x depth, percentage of total organic matter, riparian cover and shelter as the presence of large wood debris. Phylloicus larvae showed different feeding strategies in the two basins. This thesis showed the importance of physical habitats in the distribution of EPT richness and relations of habitats with the gut contents of Phylloicus larvae. The results of this thesis contribute with information regarding the influences of physical habitat for structuring benthic macroinvertebrate communities and functional trophic groups in aquatic ecosystems.
22
Abstract. It is essential to understand the interactions between local environmental factors (e.g., physical habitat and water quality) and aquatic assemblages to conserve biodiversity in tropical and subtropical headwater streams. Therefore, we evaluated the relative importance of multiple physical and chemical habitat variables influencing the richness of typically more sensitive Ephemeroptera, Plecoptera and Trichoptera (EPT) assemblages in wadeable Brazilian Cerrado (savanna) streams. To do so, we sampled macroinvertebrate assemblages and quantified physical and chemical habitat in 79 randomly selected sites in two Cerrado basins in southeastern Brazil. The environmental variables, selected by multiple regression models (MLRs) via corrected Akaike Information Criteria (AICc), contributed significantly to the variation in EPT taxa richness. The variance explained by physical habitat variables in the Upper Sao Francisco Basin (adjusted r2 = 0.53) was slightly greater than in the Upper Araguari Basin (adjusted r2 = 0.46), and both were greater than the variance explained by a combined biome model
Capítulo 1
“Importance of environmental factors on the richness and distribution of
23
(adjusted r2 = 0.39). In our study, physical habitat variables were more important than water quality variables in structuring EPT genera in savanna streams with catchments dominated by agriculture or pasture land uses. We conclude that regional models can be improved by incorporating basin-specific information, in this way refining biological assessments and better understanding the interactions that maintain biodiversity in stream networks.
Key-words: EPT assemblages, physical habitat, hydromorphology, stream conservation, macroinvertebrate bioindicators, Cerrado headwater streams
Introduction
Agriculture, pasture, and riparian deforestation hinder stream conservation through their effects on instream habitat conditions (Dovciak and Perry 2002, Pinto et al. 2006, Egler et al. 2012). Both physical habitat structure and water quality have received attention in recent years as important elements for assessing environmental quality and as agents structuring aquatic biotic assemblages (Karr and Dudley 1981, Sály et al. 2011; Ligeiro et al. 2013). To conserve headwater streams, it is essential to assess and understand the interactions among physical habitat features, water chemistry, and aquatic assemblages (Maddock 1999; Nerbonne and Vondracek 2001, Pinto et al. 2009). Site-scale research has shown that physical habitat complexity (e.g., structural cover, substrates, and water flow) influence assemblage composition, richness, and temporal stability as well as ecological processes (Hughes et al. 2010, Kaufmann and Faustini 2012, Kovalenko et al. 2012).
24
organisms are often used to assess water body condition in spatially extensive biomonitoring programs (Hering et al. 2006, Paulsen et al. 2008, USEPA 2013), through the use of multimetric indices (Baptista et al. 2007, Klemm et al. 2003, Stoddard et al. 2008, Ferreira et al. 2011, Mugnai et al. 2011, Oliveira et al. 2011), and predictive models (Feio et al. 2009, Moya et al. 2011, Chen et al. In Press).
Ephemeroptera, Plecoptera and Trichoptera (EPT) taxa are sensitive indicators of high quality ecological conditions because of their low tolerance to stressors (Usseglio-Polatera et al. 2000, Callisto et al. 2001, Klemm et al. 2003, Ferreira et al. 2011). The EPT also play important roles in nutrient cycling (Righi-Cavallaro et al. 2010), in processing coarse organic matter (Graça et al. 2001, Boyero et al. 2011), and in the diet of vertebrates and other invertebrates (Ferro and Sites 2007). Altered environmental conditions can adversely affect EPT taxa richness and composition. For example, riparian vegetation removal may increase erosion, turbidity, water temperature, streambed sedimentation, and habitat losses (Chapman and Chapman 2002, Kaufmann et al. 2009). Increased fine sediments are detrimental to many EPT taxa (Bryce et al. 2010) and reductions in wood and leaves reduce the food and shelter for EPT assemblages (Melody and Richardson 2007).
25
habitat (Dovciak and Perry 2002, Wantzen et al. 2006). Thus, the objective of this study was to evaluate the relative importance of site-scale physical habitat and water quality variables driving EPT generic richness in Brazilian Cerrado streams. The aim is to use this information to better manage headwater streams and their catchments. Because two adjacent basins in the same biome can differ in land uses, ecological conditions, geomorphology and precipitation, we hypothesized that 1) the two studied basins would differ in EPT assemblage structure and composition, 2) different sets of habitat metrics would explain EPT richness in each basin, and 3) that a combined model would explain less variability.
Methods Study Area
26 Figure 1. Study area and site locations in the Upper Araguari (A) and Upper São Francisco (B)
Basins.
Site Selection
We selected sites as described by Stevens and Olsen (2004) for the USA Wadeable Stream Assessment (Olsen and Peck 2008, USEPA 2013). Following this methodology, randomly selected sites are drawn from a digital hydrographic map to produce a spatially balanced network of sites with a minimum distance of 1 km between sites. We sampled 40 sites in September 2009 in the Upper Araguari Basin and 39 sites in September 2010 in the Upper São Francisco Basin.
Physical Habitat
27
established perpendicular to the longitudinal axis of the streams, defining ten sections of the same length. In each transect and along the sections we measured stream physical habitat variables as described in Peck et al. (2006). At the eleven transects, we recorded channel dimensions (e. g., wetted and bankfull width and depth), bank angle, riparian vegetation (e.g., percent cover of tree, understory, ground layer), presence and proximity of human disturbances (e.g., buildings, trash, land use), and presence of fish cover (e.g., undercut banks, trees and fallen branches, filamentous algae, aquatic macrophytes). We determined bed substrate (e.g., sand, gravel, boulder) at 100 points, In addition, we measured flow type (e.g., pools, riffles), thalweg depths, sinuosity and channel slope between each transect. We generated quantitative physical habitat metrics as described in Kaufmann et al. (1999); however, relative bed stability was calculated as in Kaufmann et al. (2009).
Water Quality
Temperature, electrical conductivity, pH, turbidity and total dissolved solids were measured in situ using a multiparameter probe (Yellow Springs - YSI - 650 MDS - Probe 6920). In the laboratory, we determined the concentrations of total phosphorus, total nitrogen and dissolved oxygen (APHA et al. 2005) from a water sample taken from each site and retained in a chilled cooler.
Benthic Macroinvertebrates
28
use of a stereomicroscope (80x) with the aid of taxonomic keys (Merritt and Cummins 1996, Wiggins 1996, Hamada and Couceiro 2003, Salles et al. 2004, Pés et al. 2005, Mugnai et al. 2010, Falcão et al. 2011).
Data Analyses
Selection of physical habitat and water quality variables
We first analyzed the data from the two basins separately, and limited regression analyses to 4 predictor variables (10% of the number of sites per basin) to avoid model over fitting (Gotelli and Ellison, 2004). Then we analyzed all 79 sites in the two studied basins of Cerrado biome, restricting the number of predictor metrics to 8. In each case, we followed the procedures suggested by Marzin et al. (2012a) and first separated a total of 158 habitat metrics into six groups of metrics that describe key stream habitat characteristics (channel morphology, bed substrate, flow type, riparian vegetation, fish cover, and water quality). Then, within each group of metrics, we examined correlation matrices (Pearson product moment) to eliminate redundant metrics (> |0.8| correlation), retaining the most ecologically meaningful ones. For instance, the % pools metric was highly correlated with the % trench pools metric (r = |0.94|), so we chose % pools because we consider it a more comprehensive metric describing slowly flowing habitat types. After this screening step we retained a total of 83 metrics (15 in the channel morphology group, 15 in the bed substrate group, 6 in the flow type group, 19 in the riparian vegetation group, 23 in the fish cover group, and 5 in the water quality group).
29
30 Table 1. Description of physical habitat metrics and physical-chemical water variables. Significant results are
followed by an asterisk (n/a: not assessed).
Variable code
PCA: factor coordinates - based on correlations
Habitat groups and metric names
Upper Araguari Basin
Upper São Francisco
Basin t-test
Upper Araguari Basin
Upper São Francisco Basin Channel morphology Mean (SD) Mean (SD) p 1st axis (23.94%) 1st axis (30.73%)
xdepth_s Mean depth of cross-section (cm) 20.63 (10.36) 27.77 (11.68) 0.005* -0.61 -0.54 xwidth Mean wetted width (m) 2.54 (1.08) 3.68 (2.44) 0.005* -0.69 -0.89 xbkf_w Mean bankfull width (m) 5.20 (1.74) 6.50 (3.61) 0.044* -0.40 -0.85 rp100 Mean residual depth (cm) 10.27 (5.63) 23.72 (12.81) < 0.001* -0.82 0.04 xslope Channel water surface slope – reach mean (%) 1.01 (0.62) 0.60 (0.59) 0.003* 0.45 -0.28 Sinu Channel sinuosity (m/m) 3.53 (15.48) 1.05 (0.07) 0.314 0.04 0.54
Bed substrate (32.09%) (35.13%)
xembed Mean embeddedness of channel & margin (%) 64.08 (19.67) 58.38 (24.81) 0.259 0.56 0.79 vembed Standard deviation of embeddedness in channel
+ margin (%) 35.77 (9.73) 35.63 (11.22) 0.955 -0.27 -0.48 lrbs Relative bed stability -2.52 (0.86) -2.06 (1.33) 0.070 -0.78 -0.59 lsub_dmm Substrate - log10 (geometric mean diameter
mm) -0.76 (0.87) -0.64 (1.47) 0.645 -0.92 -0.96 pct_cb Substrate % cobbles (diameter 64 – 250 mm) 0.05 (0.07) 0.06 (0.1) 0.618 -0.69 -0.45
Riparian (25.32%) (34.73%)
xcdenmid Mean mid-channel canopy density (%) 77.06 (21.54) 73.03 (24.83) 0.440 0.70 -0.32 vcdenmid Standard deviation – mid-channel canopy
density (%) 13.35 (10.50) 14.16 (8.59) 0.708 -0.57 0.21 xcmg Riparian vegetation canopy+mid+ground cover
(%) 102.59 (30.81) 94.28 (43.19) 0.325 -0.31 -0.78
Flow type (37.16%) (49.21%)
pct_gl Glide (% of reach) 0.12 (0.17) 0.38 (0.31) < 0.001* 0.45 0.76 pct_pool Pools – all types (% of reach) 0.28 (0.16) 0.52 (0.37) < 0.001* 0.61 0.86 pct_slow Slow water habitat (% glide + pool) 0.40 (0.20) 0.89 (0.12) < 0.001* 0.88 -0.80
Shelter (20.22%) (29.32%)
pct_bf Coarse litter (%) 0.001 (0.01) 0.07 (0.15) 0.006* n/a -0.17 c1w_msq Large wood debris in bankfull channel
(number/m2– all sizes) 0.07 (0.013) 0.05 (0.07) 0.296 -0.74 -0.77
xfc_brs Brush and small debris (areal proportion) 11.98 (0.0, 87.5) 7.01 (9.49) 0.088 0.14 -0.81 xfc_ucb Undercut banks (areal proportion) 5.06 (5.41) 3.65 (5.28 0.242 0.54 -0.40 xfc_ant Anthropogenic fish cover (areal proportion) 5.66 (17.02) 6.71 (11.82) 0.749 -0.39 0.22
Water quality (31.54%) (33.09%)
31
To identify the best predictor variables for explaining EPT generic richness, we performed a multiple linear regression (MLR) for each basin and for all 79 studied sites combined. Because the predictors were measured over a variety of numerical scales they were mean centered and standardized before performing the analyses. We used the best-subsets procedure (Harrell and Frank 2001) for creating MLR models, including a maximum of four explanatory variables in the models made for each individual basin and eight explanatory variables in the model made for the two basins combined, in this way avoiding model overfitting. We used the corrected Akaike Information Criteria (AICc) values for searching for the best models (Burnham and Anderson 2002). The AICc is suitable for small datasets like ours. We also checked if the models could be simplified, i.e., if the number of explanatory variables could be reduced in each case. When the difference between the AICc values of two models (•AICc) is ≤ 2, the reduced
model can be considered equivalent and, in this manner, preferable. For these analyses, we used Statistica for Windows (StatSoft, Inc. 1984-2004, version 7).
For each basin we also used the PCA1s coordinate values as surrogate variables
representing each of the dimensions of habitat quantified by the “habitat groups” (table
1) in a canonical correspondence analysis (CCA) to assess EPT assemblage composition relative to the site environmental conditions. The CCAs were performed using just EPT genera with counts greater then 10 individuals, to avoiding misinterpretation of the results. Invertebrate abundances were square root transformed because of the wide range in abundances. The CCAs were performed in R version 2.15.1 (Team 2012), package vegan (Oksanen et al. 2012).
32
abundances, with log2 X + 1 transformed data (following Anderson et al. 2006), and the Jaccard dissimilarity on presence/absence data. We also conducted t-tests to detect significant differences (p < 0.05) in EPT richness, density, and habitat and water quality metrics between the two basins. We used PERMANOVA tests (Permutational Multivariate Analysis of Variance, Anderson 2001), with 10,000 simulations, to test the difference in EPT assemblage composition between the two basins. The t-tests, the MDS, and the PERMANOVAS were also performed in R version 2.15.1.
Results
Physical & Chemical Variables
In general, sites in the two basins had good quality water, with low values for TDS, nitrogen and phosphorus, and high concentrations of dissolved oxygen. The largest differences in water quality between the two basins were observed for electrical conductivity (t(1, 77) = -3.55, p < 0.001), total dissolved solids (t(1, 77) = -4.63, p < 0.001), and water temperature (t(1, 77) = 7.75, p < 0.001). Sites in the Upper São Francisco Basin had higher mean electrical conductivity (76.1 •S cm-1) and total dissolved solids (41.1 mg L-1) whereas Upper Araguari sites had higher mean water temperature (20.3 °C) (Table 1).
33
EPT Assemblages
34
Table 2. EPT taxa list from sites of the Upper Araguari and Upper São Francisco Basins. Genera collected from only one basin are indicated in bold italic.
Upper Araguari Basin Upper São Francisco Basin
Ephemeroptera Individual Plecoptera Individual Trichoptera Individual Ephemeroptera Individual Plecoptera Individual Trichoptera Individual
Americabaetis 211 Anacroneuria 288 Alisotrichia 1 Americabaetis 1761 Anacroneuria 210 Alisotrichia 3
Apobaetis 10 Gripopteryx 33 Atopsyche 5 Apobaetis 84 Gripopteryx 1 Anchitrichia 3
Askola 49 Kempnyia 57 Austrotinodes 9 Askola 16 Macrogynoplax 1 Atopsyche 48
Aturbina 26 Paragrypopteryx 278 Barypenthus 34 Asthenopus 56 Austrotinodes 5
Baetodes 87 Tupiperla 215 Chimarra 25 Aturbina 365 Chimarra 749
Caenis 116 Grumicha 2 Baetodes 190 Cyrnellus 27
Callibaetis 4 Helicopsyche 4 Caenis 1156 Helicopsyche 33
Camelobaetidius 19 Hydroptila 4 Callibaetis 1438 Hydroptila 145
Campylocia 9 Itaura 12 Camelobaetidius 84 Leptonema 41
Cloeodes 167 Leptonema 42 Campsurus 88 Macronema 86
Criptonympha 64 Macronema 12 Campylocia 31 Macrostemum 7
Farrodes 151 Macrostemum 9 Cloeodes 1117 Marilia 99
Hagenulopsis 33 Marilia 100 Criptonympha 33 Metrichia 71
Hydrosmilodon 2 Metrichia 4 Farrodes 757 Mortoniella 6
Hylister 1 Mortoniella 185 Hagenulopsis 38 Nectopsyche 80
Leptohyphes 71 Nectopsyche 81 Hermanella 32 Neotrichia 2
Massartella 37 Neotrichia 2 Hexagenia 6 Ochrotrichia 2
Miroculis 52 Ochrotrichia 3 Hydrosmilodon 353 Oecetis 48
Needhamella 1 Oecetis 22 Latineosus 20 Oxyetira 68
Paracloeodes 64 Oxyetira 7 Leptohyphes 26 Phylloicus 44
Rivudiva 1 Phylloicus 53 Massartella 43 Polycentropus 116
Terpides 6 Polycentropus 3 Miroculis 317 Polyplectropu
s
95
Thraulodes 786 Polyplectropus 35 Needhamella 1 Protoptila 3
Traverella 1 Protoptila 5 Paracloeodes 184 Smicridea 591
Traverhyphes 589 Smicridea 526 Paramaka 6 Taraxitrichia 1
Tricorythodes 60 Triplectides 116 Simothraulopsis 40 Triplectides 18
Tricorythopsis 468 Spiritiops 8 Wormaldia 1
Ulmeritoides 104 Terpides 1
Varipes 15 Thraulodes 631
Waltzoyphius 21 Traverhyphes 2729
Zelusia 67 Tricorythodes 200
Tricorythopsis 45
Ulmeritoides 267
Waltzoyphius 339
35 Figure 2. Distribution of (A) EPT richness and (B) individual densities in sites of the Upper
Araguari Basin and Upper São Francisco Basin.
36
important in the Upper Araguari Basin, and the percent of slow water and dissolved oxygen were important in the Upper São Francisco Basin. The combined model again included size (mean bankfull width) and substrate (% cobble) variables, together with mean slope and the variation (SD) in mid-channel canopy density. We analyzed regression residuals to evaluate the validity of model assumptions.
Table 3. Best subsets multiple linear regression (MLR) models of environmental variables explaining EPT richness.
Sites Model Metrics Beta Beta Std. Err. AICc ∆AICc
Upper Araguari Basin
Four variables
xbkf_w 0.40 0.13
271.65
1.16
pct_cb 0.43 0.12
xfc_brs 0.29 0.12
xslope -0.28 0.13
R2 adj. = 0.51; F
(4.38) = 11.19; p < 0.001
Three variables
Metrics Beta Beta Std. Err.
272.81
xbkf_w 0.51 0.12
pct_cb 0.32 0.12
xfc_brs 0.23 0.19
R2 adj. = 0.46; F
(4.38) = 12.19; p < 0.001
Upper São Francisco Basin
Four variables
Metrics Beta Beta Std. Err.
256.04 -
pct_slow -0.64 0.14
lrbs 0.33 0.11
xwidth 0.34 0.13
DO -0.36 0.14
R2 adj. = 0.53; F
(4.39) = 13.15; p < 0.001
Combined Upper Araguari and Upper São Francisco Basins Eight variables
Metrics Beta Beta Std. Err.
530,932
0,005
xbkf_w 0.44 0.10
vcdenmid -0.16 0.10
Pct_cb 0.21 0.10
xslope -0.22 0.10
xembed -0.17 0.10
pct_pool 188.87 71.34
Pct_gl 168.18 63.50
Pct_slow -180.64 68.20 R2 adj. = 0.44; F
(8.79) = 8.69; p < 0.001
Four variables
Metrics Beta Beta Std. Err.
530,927
xbkf_w 0.53 0.10
xslope -0.19 0.10
Pct_cb 0.26 0.10
vcdenmid -0.20 0.10
R2 adj. = 0.39; F
37
The CCA axes accounted for little of the variability of EPT assemblages in both basins, achieving a total explanation of only 21% in the Upper Araguari Basin (8% and 4% for axes 1 and 2, respectively, Figure 3a). In this basin, Hagenulopsis,
Camelobaetidius and Varipes abundances were correlated with the channel morphology PCA axis. The abundances of those organisms were higher in streams having lower average depths, lower average widths, lower average bankfull widths, and higher slopes and sinuosities. Cloeodes and Polyplectropus abundances were associated with the riparian PCA1 axis and Chimarra, Leptohyphes, and Phylloicus
abundances were associated with the flow type PCA1 axis. Bed substrate and water quality PCA1 were associated with Itaura and Leptonema abundances.
In the Upper São Francisco Basin, the CCA axes explained 24% of the total variability in EPT assemblages (axes l and 2 explaining only 9% and 4% of the variability, respectively, Figure 3b). The abundances of Cyrnellus, Campsurus, and
Macronema were associated with the channel morphology and water quality PCA1s.
Those results indicate that those genera were associated with streams of smaller widths, depths and slopes; lower dissolved oxygen concentrations; and higher sinuosities and turbidities. Triplectides and Asthenopus abundance was associated with the bed substrate PCA1 axis; Hermanella, Camelobaetidius, and Leptohyphes
38 Figure 3. Multivariate relationships (CCAs) between EPT genera and environmental
axes in sites of (A) the Upper Araguari Basin and (B) the Upper São Francisco Basin.
39
greater overlap of stream sites of the two basins, although the separation of the basins was also confirmed by the PERMANOVA test (F(1, 77) = 7.99, p < 0.001).
40
Discussion
Despite significantly greater EPT densities and fewer genera-depauperate sites in the Upper São Francisco Basin (Figure 2), the two basins had similar total EPT generic richness. Nonetheless we found some distinct genera in each basin (Table 2) and the dissimilarity indices revealed differences between the two basins in the structure and composition of their EPT assemblages (Figure 4). The significance of those differences were confirmed in the MDS plots and the PERMANOVA tests, thereby supporting our first hypothesis (EPT assemblage structure and composition differed between basins).
41
The importance of the many naturally varying metrics we analyzed in our models supports the use of such variables or their surrogates in predictive models used in bioassessments. If natural variables in minimally disturbed sites are not incorporated in developing model expectations for macroinvertebrate assemblage condition in disturbed or test sites, the biological assessments will be confounded and inaccurate. For this reason the effects of natural variability on various biological metrics are incorporated in predictive multimetric models to assess the effects of anthropogenic disturbances on assemblages (e.g., Pont et al. 2009, Moya et al. 2011, Marzin et al. 2012a, b, Chen et al. In Press). Future studies should include these approaches, combining field data with laboratory experiments (Woodward et al. 2012) and predictive modeling.
42
physicochemical parameters (e.g., electrical conductivity, total dissolved solids) and different flow types (Table 1), may have affected site level EPT richness and abundance.
Streambed sediment size is a major factor governing macroinvertebrate richness and abundance. Bryce et al. (2010) described the importance of sediment size for structuring benthic macroinvertebrate assemblages and recommended levels of fine sediments that would protect sediment-sensitive macroinvertebrate and fish taxa in mountain streams of the western USA. Duan et al. (2008) reported a positive relationship between benthic macroinvertebrates, pebbles, and cobbles, which are more stable substrates than sand and fine sediments.
Water quality and the relative occurrence of stream habitat types also affect macroinvertebrate assemblage composition. For example, Hydroptila (Trichoptera: Hydroptilidae), are more frequently found in slowly flowing waters and pools (Dolédec et al. 2007). In the case of water quality, the distribution and composition of benthic assemblages is affected by dissolved oxygen (Baptista et al. 2007, Ferreira et al. 2011), and conductivity (Kennedy et al. 2004; Pond 2010).
43
that help us understand assemblage structure, independently of which analysis explains the greater amount of variability.
In summary, our study showed the importance of site-scale physical habitat factors in understanding differences in EPT assemblage richness of headwater Cerrado streams. Because we used a randomized and spatially balanced survey design, we can confidently assume that the ecological data were representative of the studied region (Stevens and Olsen 2004). We believe that the information contained in this study may be useful for suggesting improved ecological assessment programs, watershed management practices, aquatic ecosystem rehabilitation measures, and protection strategies for Brazilian Cerrado aquatic biota, especially those that limit the amount of sand and fine sediments entering streams.
Acknowledgements
We are grateful to the Peixe-Vivo CEMIG Program, CAPES, CNPq, FAPEMIG, and Fulbright-Brasil for financial support. Tony Olsen, Marc Weber, and Phil Larsen of the Corvallis EPA Laboratory (Oregon, USA) kindly assisted in developing spatial sampling designs and selecting wadeable stream sample sites in our Brazilian basins. We thank Juliana França, Déborah Silva and Ana Paula Eller for water quality analyses; Carlos Bernardo Mascarenhas Alves for logistical support; colleagues from the Federal University of Minas Gerais Benthic Ecology Laboratory, Federal Center of Technological Education of Minas Gerais, Federal University of Lavras, and Pontifical Catholic University of Minas Gerais for help with field collections; and researchers at the U.S. EPA Western Ecology Division, Corvallis, Oregon for discussions during an October 2010 workshop. Our manuscript was improved based on reviews by Bob Ozretich and Michael Griffith of the USEPA, and two anonymous Freshwater Science
44 Health and Environmental Effects Research Laboratory’s Western Ecology Division
45
Literature Cited
ANDERSON, M. J. 2001. A new method for non-parametric multivariate analysis of
variance. Austral Ecology 26:32–46.
ANDERSON,M.J.,K.E.ELLINGSEN, AND B.H.MCARDLE. 2006. Multivariate dispersion as a measure of beta diversity. Ecology Letters 9: 683-693.
APHA (American Public Health Association). 2005. Standard methods for the examination of water and wastewater, 21st edition. American Public Health Association. Washington, DC.
BAPTISTA, D. F., D. F. BUSS, M. EGLER, A. GIOVANELLI, M. P. SILVEIRA, AND J. L.
NESSIMIAN. 2007. A multimetric index based on benthic macroinvertebrates for
evaluation of Atlantic Forest streams at Rio de Janeiro State, Brazil. Hydrobiologia 575: 83–94.
BARBOUR, M.T.,J.GERRITSEN,G. E.GRIFFITH, R.FRYDENBOURG,E. MCCARRON,J. S.
WHITE, AND M. L. BASTIAN. 1996. A framework for biological criteria for Florida
streams using benthic macroinvertbrates. Journal of the North American Benthological Society 15: 185–211.
BARBOUR, M.T., J. GERRITSEN, B. D. SNYDER, AND J.B. STRIBLING. 1999. Rapid
bioassessment protocols for use in streams and wadeable rivers: periphyton, benthic macroinvertebrates and fish. 2nd edition. EPA 841-B-99-002. US Environmental Protection Agency, Office of Water, Washington, DC.
BONADA, N., N.PRAT, V. H. RESH, AND B. STATZNER. 2006. Developments in aquatic
insect biomonitoring: a comparative analysis of recent approaches. Annual Review of Entomology 51: 495-523.
BOYERO, L., R. G. PEARSON, D. DUDGEON, M. A. S. GRAÇA, M. O. GESSNER, R. J.
46
E. CHAUVET, A. RAMÍREZ, J. CHARÁ, M. S. MORETTI, J. F. GONÇALVES, JR., J. E.
HELSON,A.M.CHARÁ -SERNA,A.C.ENCALADA,J.N.DAVIES,S.LAMOTHE,A.CORNEJO,
A.O.Y.LI, L.M.BURIA,V. D.VILLANUEVA,M.C.ZÚÑIGA, AND C.M.PRINGLE. 2011.
Global distribution of a key trophic guild contrasts with common latitudinal diversity patterns. Ecology Letters 92: 1893-1848.
BRASIL. 1992. Normais climatológicas (1960-1990). Brasília: Ministério da
Agricultura e Reforma Agrária, Secretaria Nacional de Irrigação, Departamento Nacional de Meteorologia. 84p.
BRYCE,S.A.,G.A.LOMNICKY, AND P.R.KAUFMANN. 2010. Protecting sediment-sensitive
species in mountain streams through the application of biologically based streambed criteria. Journal of the North American Benthological Society 29: 657-672.
BURNHAM,K., AND D.ANDERSON. 2002. Model selection and multimodel inference: a
practical information-theoretical approach. Springer. New York, New York, USA.
CALLISTO, M., M. MORETTI, AND M. GOULART. 2001. Macroinvertebrados bentônicos como ferramenta para avaliar a saúde de riachos. Revista Brasileira de Recursos Hídricos 6: 71-82.
CHEN, K., R.M. HUGHES, S. XU, J. ZHANG, D. CAI, and B. WANG. In Press. Evaluating
performance of macroinvertebrate-based predictive and null modeled multimetric indices (MMI) using multi-season and multi-year samples. Ecological Indicators. CHAPMAN, L. J., AND C. A. CHAPMAN. 2002. Tropical forest degradation and aquatic
47
DINIZ-FILHO J. A. F., L. M. BINI, G. OLIVEIRA, B. S. BARRETO, M. M. F. P. SILVA, L. C.
TERRIBILE,T. F.L.V.B. RANGEL,M. P.PINTO, N.P. R.SOUSA,L.C. G. VIEIRA,A. S.
MELO,P.DEMARCO JR.,C.M.VIEIRA,D.BLAMIRES,R.P.BASTOS,P.CARVALHO,L.G.
FERREIRA,M.P.C.TELLES,F.M.RODRIGUES,D.M.SILVA,N.J.SILVA JR., AND T.N. SOARES. 2009. Macroecologia, biogeografia e áreas prioritárias para conservação
no Cerrado. Oecologia Brasiliensis 13: 470-497.
DOHET, A., L. ECTOR, H. CAUCHIE, AND L. HOFFMANN. 2008. Identification of benthic invertebrates and diatom indicator taxa that distinguish different stream types as well as degraded from reference conditions in Luxembourg. Animal Biology 58: 419-417.
DOLÉDEC, S., N. LAMOUROUX, U. FUCHS, AND S. MÉRIGOUX. 2007. Modelling the
hydraulic preferences of benthic macroinvertebrates in small European streams. Freshwater Biology 52: 145-164.
DOVCIAK, A. L., AND J. A. PERRY. 2002. In search of effective scales for stream
management: does agroecoregion, watershed, or their intersection best explain the variance in stream macroinvertebrate communities? Environmental Management 30: 365–377.
DUAN, X., Z. WANG, AND S. TIAN. 2008. Effect of streambed substrate on macroinvertebrate biodiversity. Frontiers of Environmental Science & Engineering in China 2: 122-128.
EGLER,M.,D.F.BUSS,J.C.MOREIRA, AND D.F.BAPTISTA. 2012. Influence of agricultural
48
FALCÃO,J.N.,F.F.SALLES, AND N.HAMADA. 2011. Baetidae (Insecta, Ephemeroptera)
ocorrentes em Roraima, Brasil: novos registros e chaves para gêneros e espécies no estágio ninfal. Revista Brasileira de Entomologia 55: 516-548.
FEIO, M. J., R. H. NORRIS, M. A. S. GRAÇA, AND S. NICHOLS. 2009. Water quality assessment of Portuguese streams: regional or national predictive models? Ecological Indicators 9: 791-806.
FERREIRA, W. R., L. T. PAIVA, AND M. CALLISTO. 2011. Development of a benthic multimetric index for biomonitoring of a neotropical watershed. Brazilian Journal of Biology 71: 15-25.
FERRO,M.L., AND R.W.SITES.2007. The Ephemeroptera, Plecoptera, and Trichoptera
of Missouri State Parks, with notes on biomonitoring, mesohabitat associations, and distribution. Journal of the Kansas Entomological Society 80: 105-129.
GOTELLI, N. J. AND A. M. ELLISON. 2004. A primer of ecological statistics. Sinauer
Associates Inc., Sunderland, Massachusetts 479p.
GRAÇA, M. A. S., R. C. F. FERREIRA, AND C. N. COIMBRA. 2001. Litter processing along a
stream gradient: the role of invertebrates and decomposers. Journal of the North American Benthological Society 20: 408-420.
HAMADA, N., AND S. R. M.COUCEIRO. 2003. An illustrated key to nymphs of Perlidae (Insecta, Plecoptera) genera in Central Amazonia, Brazil. Revista Brasileira de Entomologia 47: 477-480.
HARRELL JR., AND E.FRANK. 2001. Regression Modeling Strategies, with Applications
to Linear Models, Logistic Regression, and Survival Analysis. 1st edition. Springer-Verlag, New York.
HERING, D., R. JOHNSON, S. KRAMM, S. SCHMUTZ, K. SZOSZKIEWICZ, AND P. F. M.
49
macroinvertebrates, and fish: a comparative metric-based analysis of organism response to stress. Freshwater Biology 51: 1757-1785.
HUGHES,R.M.,A.T.HERLIHY, AND P.R.KAUFMANN. 2010. An evaluation of qualitative
indexes of physical habitat applied to agricultural streams in ten U. S. States. Journal of the American Water Resource Association 46: 792-806.
KARR, J., AND D. R. DUDLEY. 1981. Ecological perspectives on water quality goals.
Environmental Management 5: 55-68.
KAUFMANN, P. R., AND J. M. FAUSTINI. 2012. Simple measures of channel habitat
complexity predict transient hydraulic storage in streams. Hydrobiologia 685: 69–95. KAUFMANN,P.R.,D.P.LARSEN, AND J.M.FAUSTINI, 2009. Bed stability and sedimentation
associated with human disturbances in Pacific Northwest streams. Journal of the American Water Resources Association 45:434-459.
KAUFMANN, P. R., P. LEVINE, E. G. ROBISON, C. SEELIGER, AND D. V. PECK.1999.
Quantifying physical habitat in wadeable streams. EPA/620/R-99/003. U. S. Environmental Protection Agency, Washington, D. C.
KENNEDY,A.J.,D.S.CHERRY, AND R.J.CURRIE. 2004. Evaluation of ecologically relevant
bioassays for a lotic system impacted by a coal-mine effluent, using Isonychia. Environmental Monitoring and Assessment 95: 37−55.
KLEMM,D.J.,K.A.BLOCKSOM,F.A.FULK,A.T.HERLIHY,R.M.HUGHES,P.R.KAUFMANN,
D.V. PECK, J. L. STODDARD, W.T. THOENY, M. B. GRIFFITH, AND W.S. DAVIS. 2003.
Development and evaluation of a macroinvertebrate biotic integrity index (MBII) for regionally assessing Mid-Atlantic highlands streams. Environmental Management 31: 656-669.
KLINK, C. A., AND R. B. MACHADO. 2005. Conservation of the Brazilian Cerrado.
50
KOVALENKO, K. E., S. M. THOMAZ, AND D. M. WARFE. 2012. Habitat complexity:
approaches and future directions. Hydrobiologia 685: 1–17.
LAMMERT,M., AND J.D. ALLAN. 1999. Assessing biotic integrity of streams: effects of
scale in measuring the influence of land use/cover and habitat structure on fish and macroinvertebrates. Environmental Management 23: 257-270.
LIGEIRO, R., R. M. HUGHES, P. R. KAUFMANN, D. R. MACEDO, K. R. FIRMIANO, W.
FERREIRA, D. OLIVEIRA, A. S. MELO, AND M. CALLISTO. 2013. Defining quantitative stream disturbance gradients and the additive role of habitat variation to explain macroinvertebrate taxa richness. Ecological Indicators 25: 45-57.
MADDOCK,I.1999. The importance of physical habitat assessment for evaluating river
health. Freshwater Biology 41: 373-391.
MARONEZE,D. M.,T.H.TUPINAMBAS,C.B. M.ALVES,F.VIEIRA,P.S.POMPEU, AND M. CALLISTO. 2011. Fish as ecological tools to complement biodiversity inventories of
benthic macroinvertebrates. Hydrobiologia 673: 29-40.
MARZIN,A.,V.ARCHAIMBAULT,J.BELLIARD,C.CHAUVIN,F.DELMAS, AND D.PONT.2012a. Ecological assessment of running waters: do macrophytes, macroinvertebrates, diatoms and fish show similar responses to human pressures? Ecological Indicators 23: 56-65.
MARZIN,A.,P.VERDONSCHOT, AND D.PONT.2012b. The relative influence of catchment,
riparian corridor and local anthropogenic pressures on fish and macroinvertebrate assemblages in French rivers. Hydrobiologia DOI 10.1007/s10750-012-1254-2. MELODY,K.J. AND J.S.RICHARDSON.2007. Riparian forest havesting and its influence
51
MERRITT,R.W., AND K.W.CUMMINS. 1996. An introduction to the aquatic insects of North
America. 3rd edition. Kendall/Hunt Publishing Company, Dubuque, Iowa.
MOYA, N.,R. M. HUGHES, E. DOMINGUEZ, F. M. GIBON, E. GOITIA, AND T. OBERDORFF.
2011. Macroinvertebrate-based multimetric predictive models for evaluating the human impact on biotic condition of Bolivian streams. Ecological Indicators 11: 840-847.
MUGNAI,R.,D.F.BUSS,R.B.OLIVEIRA,C.SANFINS,A.L.CARVALHO, AND D.F.BAPTISTA. 2011. Application of the biotic index IBE-IOC for water quality assessment in wadeable streams in southeast Brazil. Acta Limnologica Brasiliensia 23: 74-85. MUGNAI, R., J. L. NESSIMIAN, AND D. F. BAPTISTA. 2010. Manual de identificação de
macroinvertebrados aquáticos do Estado do Rio de Janeiro. 1a edição. Technical Books Editora. Rio de Janeiro, RJ, Brasil.
MYERS,N.,R.A.MITTERMEIER,C.G.MITTERMEIER,G.A.B.FONSECA, AND J.KENT.2000.
Biodiversity hotspots for conservation priorities. Nature 403: 853-858.
NERBONNE,B.A., AND B.VONDRACEK. 2001. Effects of local land use on physical habitat, benthic macroinvertebrates, and fish in the Whitewater River, Minnesota, USA. Environmental Management 28: 87–99.
OKSANEN,J.,F.G.BLANCHET,R.KINDT,P.LEGENDRE,P.R.MINCHIN,R.B.O'HARA,G.L. SIMPSON, P. SOLYMOS, M. HENRY, H. STEVENS, AND H. WAGNER. 2012. Vegan:
community ecology package. R package version 2.0.4. http://CRAN.R-project.org/package=vegan
OLIVEIRA,R.B.S,R.MUGNAI,C.M.CASTRO,D.F.BAPTISTA , AND R.M.HUGHES. 2011.
52
OLSEN,A. R., AND D.V. PECK. 2008. Monitoring design and extent estimates for the
national Wadeable Stream Assessment. Journal of the North American Benthological Society 27: 822-836.
PAULSEN,S.G.,A.MAYIO,D.V.PECK,J.L.STODDARD,E.TARQUINIO,S.M.HOLDSWORTH, J. V. SICKLE, L. L. YUAN, C. P. HAWKINS, A. T. HERLIHY, P. R. KAUFMANN, M. T.
BARBOUR,D.P.LARSEN, AND A.R.OLSEN. 2008. Condition of stream ecosystems in
the US: an overview of the first national assessment. Journal of the North American Benthological Society 27: 812-821.
PECK,D.V.,A.T.HERLIHY,B.H.HILL,R.M.HUGHES,P.R.KAUFMANN,D.J.KLEMM,J.M.
LAZORCHAK,F.H.MCCORMICK,S.A.PETERSON,P.L.RINGOLD,T.MAGEE, AND M.R.
CAPPAERT. 2006. Environmental Monitoring and Assessment Program - Surface
Waters. Western Pilot Study: field operations manual for wadeable streams. EPA Report EPA EPA/620/R-06/003. U.S. Environmental Protection Agency, Office of Research and Development, Washington, DC.
PÉS,A.M.O.,N.HAMADA, AND J.L.NESSIMIAN. 2005. Chaves de identificação de larvas para famílias e gêneros de Trichoptera (Insecta) da Amazônia Central, Brasil. Revista Brasileira de Entomologia 49: 181-204.
PINTO, B. C. T., F. G. ARAUJO, AND R. M. HUGHES. 2006. Effects of landscape and riparian condition on a fish index of biotic integrity in a large southeastern Brazil river. Hydrobiologia 556: 69-83.
PINTO, B.C.T., F.G.ARAUJO,V.D.RODRIGUES, AND R. M.HUGHES. 2009. Local and
ecoregion effects on fish assemblage structure in tributaries of the Rio Paraíba do Sul, Brazil. Freshwater Biology 54: 2600-2615.
53
PONT,D.,R.M.HUGHES,T.R.WHITTIER, AND S.SCHMUTZ. 2009. A predictive index of
biotic integrity model for aquatic-vertebrate assemblages of western U.S. streams. Transactions of the American Fisheries Society 138: 292-305.
RIGHI-CAVALLARO, K. O., K. F. ROCHE, O. FROEHLICH, AND M. R. CAVALLARO. 2010. Structure of macroinvertebrate communities in riffles of a Neotropical karst stream in the wet and dry seasons. Acta Limnologica Brasiliensia 22: 306-316.
ROSENBERG, D.M. AND RESH, V.H. 1993. Freshwater biomonitoring and benthic macroinvertebrates. Chapman and Hall, New York.
SALLES,F.F.,E.R.DA-SILVA,M.D.HUBBARD, AND J.E.SERRÃO. 2004. As espécies de
Ephemeroptera (Insecta) registradas para o Brasil. Biota Neotropica 4: 1-34. SÁLY,P.,P.TAKÁCS,I.KISS,P.BÍRÓ, AND T.ERÕS. 2011. The relative influence of spatial
context and catchment- and site-scale environmental factors on stream fish assemblage in a human-modified landscape. Ecology of Freshwater Fish 20: 251-262.
STEVENS D.L. AND OLSEN A.R. 2004. Spatially Balanced Sampling of Natural Resources. Journal of the American Statistical Association 99: 262–278.
STODDARD, J. L, A. T. HERLIHY, D. V. PECK, R. M. HUGHES, T. R. WHITTIER, AND E.
TARQUINIO. 2008. A process for creating multi-metric indices for large-scale aquatic surveys. Journal of the North American Benthological Society 27: 878-891.
TEAM,R.D.C. 2012. R: A language and environment for statistical computing. Vienna,
Austria: R Foundation for Statistical computing. Retrieved from http://www.R-project.org/.
54
USSEGLIO-POLATERA, P., M. BOURNAUD, P. RICHOUX, AND H. TACHET. 2000.
Biomonitoring through biological traits of benthic macroinvertebrates: how to use species trait databases?Hydrobiologia422/423: 153–162.
WANTZEN, K. M., A. SIQUEIRA, C. N. CUNHA, AND M. F. P. SÁ. 2006. Stream-valley systems of the Brazilian Cerrado: impact assessment and conservation scheme. Aquatic Conservation: Marine Freshwater Ecosystems 16: 713-732.
WIGGINS,G.B. 1996. Larvae of the North American caddisfly genera (Trichoptera). 2nd edition. University of Toronto Press, Toronto, Canada.
WOODWARD G., M. O. GESSNER, P. S. GILLER, V. GULIS, S. HLADYZ, A. LECERF, B.
MALMQVIST, B. G. MCKIE, S. D. TIEGS, H. CARISS, M. DOBSON, A. ELOSEGI, V.
FERREIRA,M.A.S.GRAÇA,T.FLEITUCH,J.O.LACOURSIÈRE,M.NISTORESCU,J.POZO,
55
Abstract. Macroinvertebrates are important for processing leaf detritus in temperate streams, but their role in tropical streams has been less frequently studied and with conflicting results. We assessed the diet of five instars of Phylloicus (Trichoptera: Calamoceratidae) larvae via stomach content analyses, and classified food items into six categories (CPOM – coarse particulate organic matter; FPOM – fine particulate organic matter, algae; animal tissue; vascular plant tissue, and mineral material). Next, we related food categories to stream physical habitat variables (e.g., riparian vegetation, organic matter availability, and morphological characteristics). We sampled sites in two river basins of the Cerrado (Brazilian savanna) with differing types and intensities of land use. We hypothesized that Phylloicus larvae from the different river basins would have different feeding strategies and that their diets would be related to the physical habitat. We found that CPOM content was higher in Phylloicus larvae of Upper São Francisco sites, and it varied between instars in the two basins. Mineral matter and FPOM were higher in larvae of Upper Araguari sites. FPOM, mineral material, and animal tissue were best explained by multiple linear regression (MLR) models between food items and physical habitat metrics, and plant tissue had the lowest variance. The key physical habitat metrics were mean bankfull height, mean
Capítulo 2
56
width times mean depth, percentage of total organic matter, average riparian cover, and presence of twigs and snags. We found greater biomass of Phylloicus larvae in the Upper São Francisco Basin. We concluded that the larvae had different feeding strategies and fed on different foods in the two river basins. Therefore, trusting in published classifications may be inaccurate, and regional studies of feeding habits are needed for a precise classification of the invertebrate groups in trophic guilds.
57
Introduction
Organic matter from riparian vegetation is the main energy source for detritivorous aquatic organisms of headwater streams and this processing is important for nutrient cycling (Mathuriau and Chauvet, 2002; Gonçalves et al., 2006; Rincon and Martinez, 2006; Davies and Boulton, 2009). The riparian vegetation of Neotropical rivers is rich in plant species, which generate an input of leaf detritus throughout the year (Cheshire et al., 2005; Carvalho and Uieda, 2009; Gonçalves and Callisto, 2013). Leaf decomposition in aquatic ecosystems occurs gradually through the actions of chemical, physical, and biological agents (Gonçalves et al., 2007; França et al., 2009).
Detritivorous invertebrates play an important role in the decomposition of leaves that fall and are transported and accumulated in stream bottoms. Shredder macroinvertebrates feed on these leaves (also known as coarse particulate organic matter - CPOM) and reduce their size, making them available in the form of fine particulate organic matter (FPOM) to other detritivorous organisms and decomposers (Boyero et al., 2011). Usually, shredders exhibit preferences for certain types of leaves according to leaf lignification, nutritional quality, conditioning by microorganisms, and presence of secondary toxic compounds (Graça and Cressa, 2010; Jabiol et al., 2013).
58
In contrast, studies of the importance of shredder macroinvertebrates in tropical streams are scarce (e. g. Gonçalves et al., 2006; Becker et al., 2009; Moretti et al., 2009; Boyero et al., 2011; Chara-Serna et al., 2012) and have conflicting results. Some authors emphasized the importance of shredder invertebrates in the dynamics of organic matter in tropical ecosystems (e. g. Motta and Uieda, 2004; Cheshire et al., 2005; Motta and Uieda, 2005). Chará-Serna et al. (2012), who studied tropical streams in Colombia, highlighted the importance of stomach content analysis to assess the ecological dynamics of shredder macroinvertebrates. On the other hand, there are studies that point to the scarcity of shredders in tropical streams (Wantzen and Wagner, 2006; Gonçalves et al., 2007; Boyero et al., 2011), where bacteria and fungi are likely more important in the decomposition process (Graça, 2001; Mathuriau and Chauvet, 2002; Gonçalves et al., 2006).
The Cerrado (Brazilian savanna) is the second largest biome in Brazil and harbors considerable animal and plant biodiversity , with a high incidence of endemism; at a global scale the Cerrado is considered a biodiversity hotspot (Myers
et al., 2000). However, for over six decades, much of the natural Cerrado vegetation has been replaced by pastures and crops (Diniz-Filho et al., 2009). The removal of the riparian vegetation increases erosion, turbidity, temperature, bed sedimentation and the abundance of aquatic macrophytes, leads to habitat loss, and affects the distribution, richness, and abundance of aquatic invertebrates (Chapman and Chapman, 2002; Kaufmann et al., 2009; Hughes et al., 2010; Kaufmann and Faustini, 2012). For these reasons, shredder diets also can be affected by the availability of CPOM and FPOM.
59
relationship between the composition of food items and physical habitat metrics in Cerrado headwater streams. We studied sites in two river basins that differ in land use and disturbance. The main activity in the Upper Araguari River Basin is agriculture, whereas in the Upper São Francisco River Basin the main activity is livestock ranching on small farms (Ligeiro et al., 2013). We hypothesized that Phylloicus larvae in different river basins have different feeding strategies and that their diets are related to characteristics of the physical habitat, which in turn are related to riparian vegetation, organic matter availability, and stream morphology. Therefore, we sought to test whether prior trophic classifications long-accepted by invertebrate researchers were dependent on the environmental context.
Methods
Study area
60 Figure 1. Study area and location of sampling sites in the Upper Araguari River (A) and Upper
São Francisco River (B) basins, southeastern Brazil.
Site selection
61
Physical habitat
We measured physical habitat structure of the stream sites as described by Peck et al. (2006). The length of each site was defined as the average width multiplied by 40, with 150 m the minimum length sampled. In each site, we established 11 transversal transects, which were equidistant and perpendicular to the stream and defined 10 longitudinal sections of the same length. In each transect, and along the sections, we assessed physical habitat characteristics, such as channel dimensions (e.g., wetted width and depth, bankfull width and depth), riparian forest conditions (e.g., presence and cover of arboreal canopy and understory), presence of cover in the channel (e.g., undercut banks, fallen trees and twigs, filamentous algae, macrophytes), sediment (e.g., fine and coarse sediments), surface flow types (e.g., fine and coarse sediments, pools, glides and riffles), and presence of organic material (e.g., plant detritus, leaf pack). The calculation of metrics based on physical habitat characteristics measured in the field followed Kaufmann et al. (1999).
Collection of benthic macroinvertebrates
In each of the 11 transects we sampled benthic macroinvertebrates with a D-frame net (30 cm wide, 500 µm mesh) in an area of 0.09 m2, totaling 1 m2 of sampled area per site. We fixed the samples in the field in 4% formalin. In our laboratory, we washed the samples through a 500-µm sieve and sorted the organisms.
Determination of size classes of Phylloicus larvae
62
We examined and measured Phylloicus larvae under low magnification (5x), and each micrometric unit (MU) was equal to 0.18 mm. The results were expressed in mm. We classified five larval instars (Oliveira and Froehlich 1997): I = 2.52 to 3.06 mm; II = 3.07 to 5.76 mm; III = 5.77 to 8.46 mm; IV = 8.47 to 11.34 mm; and V ≥ 11.35 mm.
Assessment of stomach contents and quantification of food items in Phylloicus larvae
We extracted the digestive tract of 72 larvae collected in both river basins at 15 sites with a scalpel under a stereoscopic microscope. We diluted and distributed the food items homogeneously on a Sedgewick Rafter counting cell. Next, we separated and quantified the items (count per field) under the microscope at a magnification of 100x. We quantified the items using 20 random fields (Chara-Serna et al., 2012), which corresponded to 40% of the counting cell, and classified them into six categories following Cheshire et al. (2005). The categories were; CPOM (> 50 µm) mainly from leaves, FPOM (< 50 µm), algae, vascular plant tissue including roots, animal tissue (carapaces, cerci, legs), and mineral material.
Biomass assessment
63
Data analysis
Stomach contents of Phylloicus larvae
To test for differences in the composition of food items of Phylloicus larvae among size classes and between the two river basins, we carried out a factorial two-way ANOVA, followed by a post-hoc Tukey test. For each food item, we arcsine-transformed data on the proportion of food items counted in the twenty random fields analysed. We analyzed differences in each food item among sites and size classes, as well as the interaction between sites and size classes.
Physical habitats and stomach contents
We used the Pearson product-moment correlation coefficient with 52 physical habitat metrics. We excluded redundant metrics (r > 0.8) and retained the metrics that were ecologically more meaningful. For example, average percent canopy density at
mid-stream (xcdenmid) was strongly correlated with average percent canopy density at the bank (xcdenbk) (r = 0.88). Therefore, we chose the metric xcdenbk, because it
was considered more comprehensive. Hence, we selected 20 physical habitat metrics for each river basin (Table 1). We used multiple linear regressions to test for a relationship between each proportion of food item (arcsine-transformed data) and the physical habitat predictor variables, considering sites in both river basins. As Phylloicus larvae were found only in 15 sites, we limited the final model to two predictor variables to avoid overfitting. We used the procedure top sub (Harrell, 2001) for creating MLR
models. We used the Akaike information criteria corrected values ( AICc ) to search for the best models (Burnham and Anderson, 2002) and to verify whether the models
64
reduced model was considered equivalent and thus preferable. For these analyses,
we used Statistica for Windows (StatSoft, Inc. from 1984 to 2004 , version 7) and Systat for Windows (version 13.00.05, 2009).
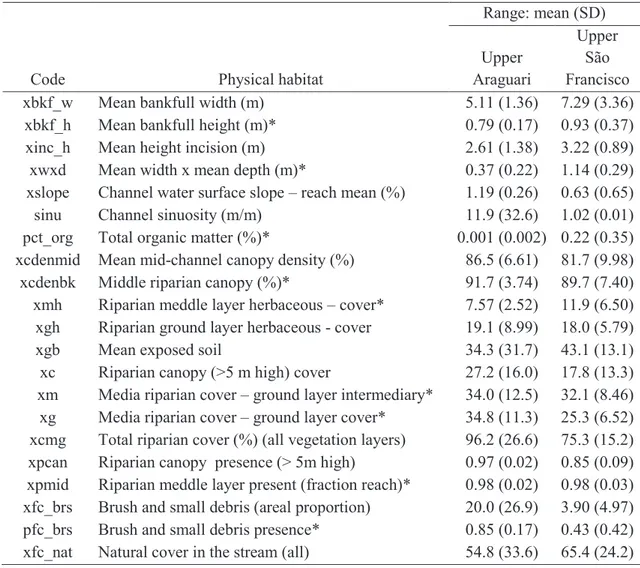
Table 1. Physical habitat metrics. Metrics selected by the MLR model are marked with an asterisk.
Code Physical habitat
Range: mean (SD)
Upper Araguari
Upper São
Francisco
xbkf_w Mean bankfull width (m) 5.11 (1.36) 7.29 (3.36)
xbkf_h Mean bankfull height (m)* 0.79 (0.17) 0.93 (0.37)
xinc_h Mean height incision (m) 2.61 (1.38) 3.22 (0.89)
xwxd Mean width x mean depth (m)* 0.37 (0.22) 1.14 (0.29)
xslope Channel water surface slope – reach mean (%) 1.19 (0.26) 0.63 (0.65)
sinu Channel sinuosity (m/m) 11.9 (32.6) 1.02 (0.01)
pct_org Total organic matter (%)* 0.001 (0.002) 0.22 (0.35)
xcdenmid Mean mid-channel canopy density (%) 86.5 (6.61) 81.7 (9.98)
xcdenbk Middle riparian canopy (%)* 91.7 (3.74) 89.7 (7.40)
xmh Riparian meddle layer herbaceous – cover* 7.57 (2.52) 11.9 (6.50)
xgh Riparian ground layer herbaceous - cover 19.1 (8.99) 18.0 (5.79)
xgb Mean exposed soil 34.3 (31.7) 43.1 (13.1)
xc Riparian canopy (>5 m high) cover 27.2 (16.0) 17.8 (13.3)
xm Media riparian cover – ground layer intermediary* 34.0 (12.5) 32.1 (8.46)
xg Media riparian cover – ground layer cover* 34.8 (11.3) 25.3 (6.52)
xcmg Total riparian cover (%) (all vegetation layers) 96.2 (26.6) 75.3 (15.2)
xpcan Riparian canopy presence (> 5m high) 0.97 (0.02) 0.85 (0.09)
xpmid Riparian meddle layer present (fraction reach)* 0.98 (0.02) 0.98 (0.03)
xfc_brs Brush and small debris (areal proportion) 20.0 (26.9) 3.90 (4.97)
pfc_brs Brush and small debris presence* 0.85 (0.17) 0.43 (0.42)
xfc_nat Natural cover in the stream (all) 54.8 (33.6) 65.4 (24.2)
Results
65
al. (2012). We analyzed 96 larvae: 50 (2.8% of all shredders) from nine Upper Araguari River Basin sites and 46 (6%) from six Upper São Francisco River Basin sites. We found food in the digestive tract of 72 (75%) of the Phylloicus larvae; in 25% of the larvae either there was no food or the digestive tract was damaged. The body length range of the larvae was 3.0 - 18 mm and the dry biomass average was of 71.35 mg in the Upper Araguari River Basin. In the Upper São Francisco River Basin, the body length range was 2.5 - 18 mm and the dry biomass average was 96.17 mg (Table 2). FPOM and CPOM were the predominant food items, and together represented over 90% of the total.
Table 2. Estimated average dry biomass of Phylloicus.
Site
Body length range (mm)
Regression
coefficient Dry mass (mg) n
Dry mass total (mg) a b mean (range)
Upper Araguari Basin 3.0 – 18.0
-20.24 1.93 13.96 (3.55 – 32.50) 50 71.35 Upper São Francisco Basin 2.5 – 18.0 11.54 (2.59 – 32.50) 46 96.17
FPOM was the main food of larvae of all instars collected from Upper Araguari River Basin sites, followed by CPOM (Figure 2). The lowest percentage of FPOM (86%) was found in instar II and the highest percentage (94%), in instar I. The highest percentage of CPOM was found in instar III (7.4%) and the lowest, in instar I (3.6%). The highest percentage of algae was found in instar II (7.3%) and the lowest, in instar IV (0.6%). Fragments of animal tissue, plant tissue, algae, and mineral material were rare (< 0.2%) in the digestive tracts of Phylloicus larvae.
66
(42.4%) and the lowest, in instar I (5.6%). Other food items and mineral material were rare in the digestive tract of Phylloicus larvae (< 6.0 %).
67 Figure 2. Average proportion and standard error of the food items (proportion of fields in the counting cell that presented each item) for different Phylloicus larval instars in the Upper Araguari River and Upper São Francisco River basins. Note the different scales in the Y-axes.
68
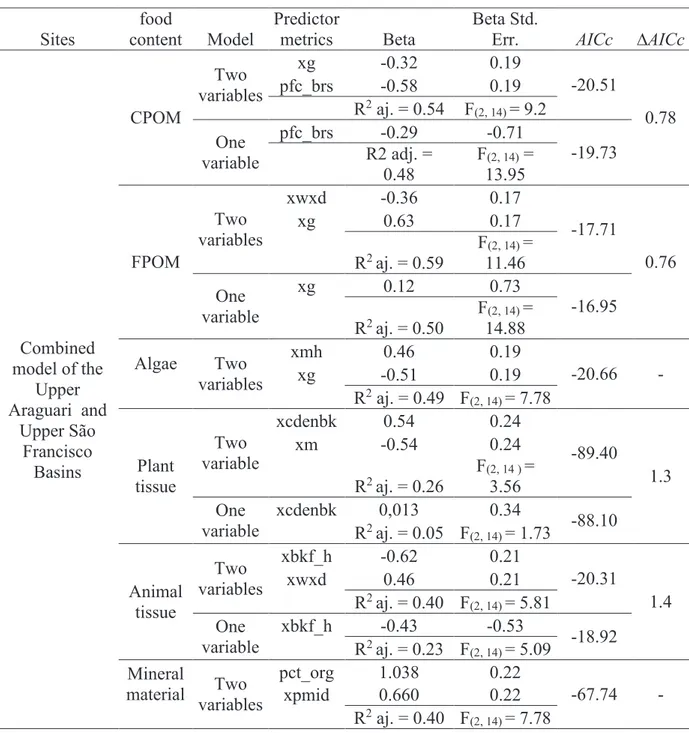
riparian cover, and shelter in the channel (instream brush and small debris presence) (Table 3).
Table 3. Multiple linear regressions (best subsets) that explain the composition of food items of Phylloicus larvae in the Upper Araguari River Basin and the Upper São Francisco River Basin. See Table 1 for metric definitions.
Sites
food
content Model
Predictor
metrics Beta
Beta Std.
Err. AICc ∆AICc
Combined model of the
Upper Araguari and
Upper São Francisco Basins CPOM Two variables
xg -0.32 0.19
-20.51
0.78 pfc_brs -0.58 0.19
R2 aj. = 0.54 F(2, 14) = 9.2
One variable
pfc_brs -0.29 -0.71
-19.73 R2 adj. =
0.48
F(2, 14) = 13.95
FPOM
Two variables
xwxd -0.36 0.17
-17.71
0.76
xg 0.63 0.17
R2 aj. = 0.59
F(2, 14) = 11.46
One variable
xg 0.12 0.73
-16.95 R2 aj. = 0.50
F(2, 14) = 14.88
Algae Two variables
xmh 0.46 0.19
-20.66 -
xg -0.51 0.19
R2 aj. = 0.49 F(2, 14) = 7.78
Plant tissue
Two variable
xcdenbk 0.54 0.24
-89.40
1.3
xm -0.54 0.24
R2 aj. = 0.26
F(2, 14 ) = 3.56 One
variable
xcdenbk 0,013 0.34
-88.10 R2 aj. = 0.05 F(2, 14) = 1.73
Animal tissue
Two variables
xbkf_h -0.62 0.21
-20.31
1.4
xwxd 0.46 0.21
R2 aj. = 0.40 F(2, 14) = 5.81 One
variable
xbkf_h -0.43 -0.53
-18.92 R2 aj. = 0.23 F(2, 14) = 5.09
Mineral
material Two variables
pct_org 1.038 0.22
-67.74 - xpmid 0.660 0.22