ISSN 0104-6632 Printed in Brazil
www.abeq.org.br/bjche
Vol. 31, No. 01, pp. 259 - 270, January - March, 2014
Brazilian Journal
of Chemical
Engineering
SIMULATION OF ETHANOL EXTRACTIVE
DISTILLATION WITH MIXED GLYCOLS
AS SEPARATING AGENT
I. D. Gil
*, L. C. García and G. Rodríguez
Grupo de Procesos Químicos y Bioquímicos, Department of Chemical and Environmental Engineering, Phone: + (57) (1) 3165672, Fax: + (57) (1) 3165617, Universidad Nacional de Colombia - Sede Bogotá.
E-mail:[email protected] (I. D. Gil).
(Submitted: April 19, 2013 ; Revised: June 18, 2013 ; Accepted: June 19, 2013)
Abstract - Extractive distillation is an alternative for ethanol dehydration processes that has been shown to be more effective than azeotropic distillation and, in close proximity, to be very competitive against the process that uses adsorption with molecular sieves. Glycols have been shown to be the most effective solvents in extractive distillation, mainly ethylene glycol and glycerol. In this work, an extractive distillation column was simulated with the Aspen Plus software platform, using the RadFrac module for distillation columns, to investigate the effect on the separation of the ethylene glycol-glycerol mixture composition, the separating agent feed stages, the separating agent split stream feed, and the azeotropic feed temperature. The NRTL model was used to calculate the phase equilibrium of these strongly polar mixtures. A rigorous simulation of the extractive distillation column finally established was also performed, including a secondary recovery column for the mixture of solvents and a recycle loop, to simulate an industrially relevant situation. This simulation allowed establishing the complete parameters to dehydrate ethanol: the optimal stage for separating agent feed is stage 4; the most adequate composition for the glycols mixture is 60 mol% ethylene glycol and 40 mol% glycerol. Finally, energetically efficient operating conditions for each one of the columns were established through a preliminary pinch analysis.
Keywords: Mixed solvents; Ethanol dehydration; Thermal analysis; Glycerol; Ethylene glycol.
INTRODUCTION
Anhydrous ethanol is widely used in the chemical industry as a raw material in chemical synthesis of esters and ethers, and as solvent in production of paint, cosmetics, sprays, perfumery, medicine and food, among others. Furthermore, mixtures of anhy-drous ethanol and gasoline may be used as fuels, reducing environmental contamination and improv-ing gasoline’s octane index, mainly due to the addition of ethanol (Barba et al., 1985; Black et al., 1980; Chianese et al., 1990; Meirelles et al., 1992, Gil et al., 2012).
The ternary diagram for the ethanol/water/gasoline
Brazilian Journal of Chemical Engineering
Figure 1: Liquid-Liquid equilibrium diagram for ethanol/water/gasoline system at 50 °C. (Gil, 2006).
Among the most popular processes used in etha-nol dehydration, heterogeneous azeotropic distilla-tion uses solvents such as benzene, pentane, iso-octane and cyclohexane, among others; extractive distillation with solvents and salts as separating agents; adsorption with molecular sieves; and, processes that use pervaporation membranes (Black et al., 1980; Gomis et al., 2007; Hanson et al., 1988; Jacques et al., 1999; Pinto et al., 2000; Ulrich et al., 1988; Uyazán et al., 2006; Gil et al., 2008; Ravagnani M.A.S.S., et al, 2009). All these processes have had industrial applications and some of them have actu-ally disappeared, due to their inherent high costs of operation, operational problems, and increased energy consumption levels.
Extractive distillation is a partial vaporization process in the presence of a non-volatile separating agent with a high boiling point, which is generally called solvent or separating agent, and which is added to the azeotropic mixture to alter the relative volatility of the key component with no additional formation of azeotropes (Perry, 1992; Black et al., 1972). The principle behind extractive distillation is the introduction of a selective solvent that interacts differently with each of the components of the original mixture and which generally shows a strong affinity with one of the key components (Lee and Gendry, 1997; Doherty and Malone, 2001). In general terms, the solvent is fed at the upper zone of the column, above the feed stream, and retains a
significant concentration throughout the liquid phase. Then it is withdrawn as bottom product and is for-warded to a vacuum-operated regeneration column. Solvents most commonly used in extractive distilla-tion of ethanol include glycols (Perry, 1992; Meirelles
et al., 1992), glycerol (Lee and Pahl, 1985; Uyazán
et al., 2006), gasoline (Chianese and Zinnamosca, 1990) and, in the case of saline extractive distillation, acetate and inorganic salts: CaCl2, AlCl3, KNO3,
(CuNO3)23H2O, Al(NO)39H2O, K2CO3 (Barba et al.,
1985; Furter, 1992; Ligero and Ravagnani, 2003; Llano and Aguilar, 2003; Pinto et al., 2003; Schmit and Vogelpohl, 1983).
consequence of the increased biodiesel production, which generates glycerol as by-product at low prices. Secondly, glycerol has a high viscosity that limits the operation and increases in some cases the energy consumption of the pumping and recovery of gly-cerol streams; for this reason, one part of glygly-cerol is replaced with ethylene glycol, diminishing the viscosity of the entrainer and improving the perform-ance of the two solvents at the same time.
SIMULATION OF EXTRACTIVE DISTILLATION COLUMN Thermodynamic Model
This work was performed via the Aspen Plus process simulator, Version 2006, while calculations of activity coefficients for the mixture were per-formed via the NRTL thermodynamic model, which was validated with experimental data, using the Aspen Split simulator. Initially, the ethanol-water-glycol systems were analyzed separately, to further establish a quaternary-system relationship through
the Residue Curve Map. The analysis was made using pseudobinary phase diagrams, in which the mole ratio of one of the components with respect to the other two is kept constant. In this case, ethanol and water were varied over the whole composition range while the composition of solvent was kept constant. Figure 2 shows the pseudo-binary vapor-liquid equilibrium curve for the ethanol-water-ethylene glycol system which is generated by the simulator with the NRTL thermodynamic model, together with the experimental data reported by Lee and Pahl (1985), Lei et al. (2002), and Ramanujam and Laddha (1960). Likewise, Figure 3 shows equiva-lent results for the ethanol-water-glycerol system, together with the experimental values reported by Lee and Pahl (1985).
The proper correlation of the NRTL model with experimental data supports the definition of the starting point for the thermodynamic modeling of the system, and further certifies the property of ethylene glycol and glycerol to modify the vapor-liquid equi-librium curve, eliminating the azeotrope and obtaining high-purity ethanol. The interaction parameters are shown in Table 1.
Molar Fraction of ethanol in liquid
M o lar F rac ti o n of e th a n o l in va p o r
Molar Fraction of ethanol in liquid
M o lar F rac ti o n of e th a n o l in va p o r
Molar Fraction of ethanol in liquid
Mo la r F rac tio n of et h a n o l in v a por
Molar Fraction of ethanol in liquid
Mo la r F rac tio n of et h a n o l in v a por
Figure 2: Adjustment of experimental data on the pseudo-binary equilibrium of the ethanol-water-ethylene glycol mixture with the Aspen Split simulator, P = 1 atm.
Figure 3: Adjustment of experimental data on the pseudo-binary equilibrium of the ethanol-water-glycerol mixture with the Aspen Split simulator, P = 1 atm.
Table 1: Binary interaction parameters (Aspen Plus 7.2).
Component i Water Water Water Ethanol Ethanol Glycerol
Component j Ethanol Glycerol Ethylene Glycol Glycerol Ethylene Glycol Ethylene Glycol
Aij 3.45780 -1.2515 0.3479 0.0000 14.8420 0.0000
Aji -0.8009 -0.7318 -0.0567 0.0000 -0.1115 0.0000
Bij -586.0809 272.6075 34.8234 442.7130 -4664.4058 -347.5824
Bji 246.1800 170.9167 -147.1373 36.1390 157.5937 298.1435
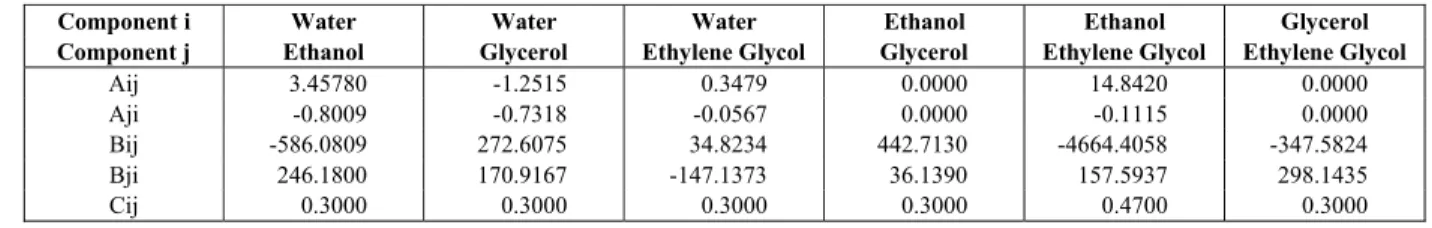
Brazilian Journal of Chemical Engineering Figure 4 displays the residue curve map for the
quaternary system calculated via the NRTL thermo-dynamic model and generated through the Aspen Split simulator. In this case, no formation of new azeotropes is observed; only a distillation region exists, and there is no partial miscibility. Although these features allow carrying out the separation, they are not required to achieve it. Recent studies have shown that the separating agent can form one additional minimum or maximum boiling azeotrope with one of the other components. Rodriguez-Donis
et al. (2010) have demonstrated that the general feasibility criterion to identify the component which will be drawn as the first product cut is also applicable when the entrainer forms new azeotropes. The residue curves map for the ethanol/water/glycols system not only shows that the ethylene glycol-glycerol mixture may be used in extractive distilla-tion operadistilla-tions, but also the system behavior meets the common feasibility rule.
Figure 4: Residue curve map for the ethanol-water-ethylene glycol-glycerol mixture, P = 1 atm.
Input Data
Previous studies (Meirelles et al., 1992; Lee and Pahl, 1985) show that systems using glycols as separating agents in ethanol dehydration feature between 18 and 24 theoretical stages, and also that process results approximately match the behavior of experimental columns. In this study, simulations were performed with 20 theoretical stages in the extractive distillation column. The solvent to feed (S/F) ratio was fixed at 0.8 for all simulations, according to the findings from previous works (Meirelles et al., 1992; Uyazán and Gil, 2003). Basic input data for the simulation of the ethanol dehydration column are included in Table 2. Based on this data, the analysis of the separating agent feed stage was established, as well as that for the split of
the agent stream, the composition of the separating agent, and the feed temperature for the azeotropic mixture, in order to obtain a 0.999 mole fraction composition of ethanol in the distillate.
Table 2: Initial input data for extractive column.
Simulation parameters Value
Azeotropic feed flow, F (kmol/h) 100 Mole fraction of ethanol in the azeotropic feed 0.88
Reflux ratio, R 0.5
Distillate flow, D (kmol/h) 86.8 Number of theoretical stages 20 Solvent-feed ratio, S/F 0.8 Solvent’s input temperature, Ts (ºC) 75 Feed stage of the azeotropic mixture 12
Effect of the Separating Agent Feed Stage and Flow Split
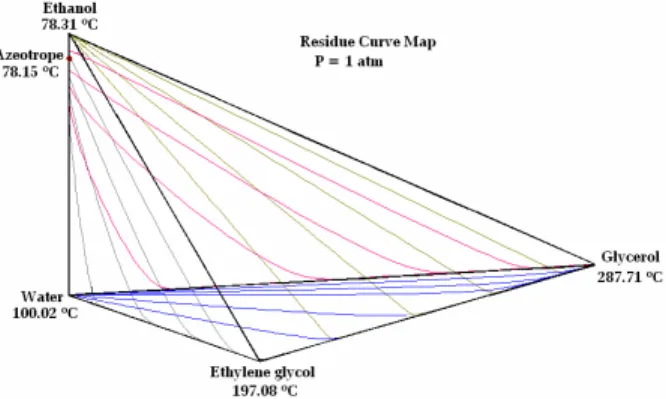
In this simulation, the feed of the separating agent was simultaneously performed through two points in the column, via flows S1 and S2. Eight different combinations at the feed stage and 10 molar ratios (S1/S2) were analyzed. The azeotropic feed was fixed in stage 12. The composition of the separating agent stream was fixed as an equimolar mixture of ethylene glycol and glycerol, with a total flow of 80 kmol/h. Figure 5 shows the flowsheet used for simulations.
Figure 5: Flowsheet for the extractive distillation column.
it is fed in stages 3 through 5, the ethanol concentra-tion values increase. Figure 6(a) shows that, as the distance between the two feed stages increases, the purity of the distillate decreases; furthermore, it shows that the best separation between stages is one, but also that the best thing to do is to refrain from performing the flow split, since this will cause a decrease in the purity of ethanol being produced. The theory indicates that the distance between the two feed stages must be as large as possible, so that the solvent is present throughout most of the column at the concentration to break the azeotrope (Laroche et al., 1992; Knapp et al., 1994). But also a rectifying section is required in order to obtain ethanol, so it is not recommended to set the feed at the top (Rodriguez-Donis et al., 2009). Results included in Figure 6 show that it is better to feed the separating agent in stage 4. Likewise, when the separating agent feed stages approach the top, the energy consump-tion of the reboiler is higher (that is, the amount of heat to be supplied for each kilogram of anhydrous ethanol increases). Furthermore, when Figures 6(a) and 6(b) are compared from the energy and composi-tion perspectives, it is better not to divide the sepa-rating agent stream. In case any flow split occurs, the most favorable alternative implies working with stages 4 and 5, feed a minimum of 40% of the separating agent in stage 4 and the remaining fraction in stage 5.
Effect of the Separating Agent Composition
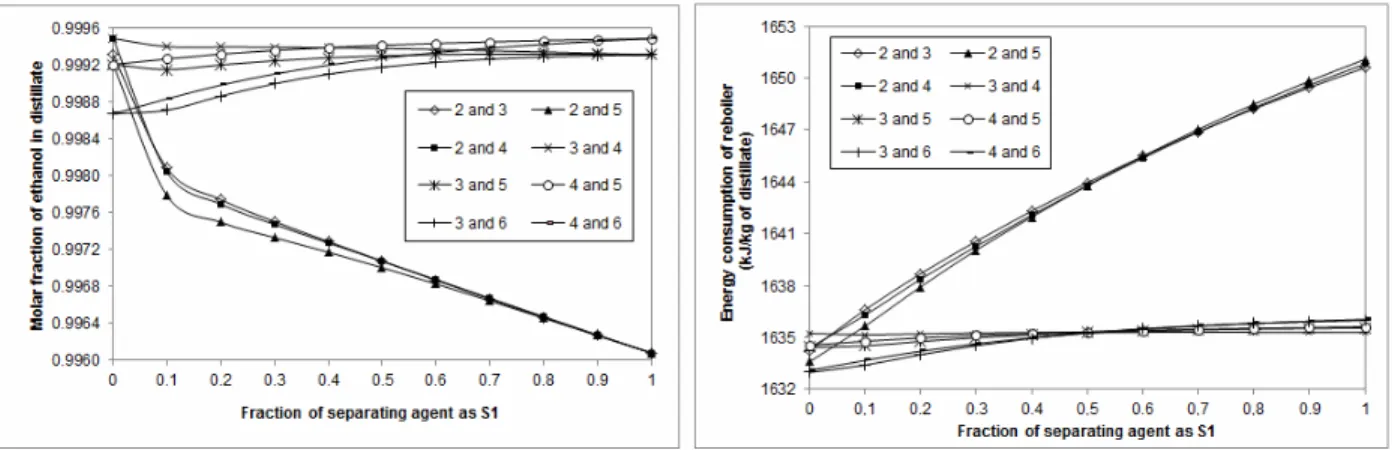
The glycols mixture that was assessed in this survey is made up of ethylene glycol and glycerol. As it was previously illustrated in former works (Uyazán and Gil, 2003; Lee and Pahl, 1985; Uyazán
et al., 2006), these two solvents produce top results, both for modification of the vapor-liquid equilibrium curve and for the extractive distillation operation. The evaluation of a separating agent prepared from these two solvents intends to leverage the superiority of glycerol to perform separations, combining it with a glycol with lower boiling point, so as to prevent high temperatures at the reboiler and to avoid ther-mal degradation of the mixture.
The effects of different mixtures of ethylene glycol and glycerol were analyzed through simula-tions in which the separating agent was fed in stage 4, while all other parameters for the extractive column were set as in the previous case. The whole composition range was studied (see Figure 7) and the results showed that, in those cases in which solvents were used as pure substances, glycerol proved to be more effective than ethylene glycol in achieving a high purity product under the same operating condi-tions, but required higher energy consumption. Figure 7(a) shows the effect of the composition of the separating agent mixture on the distillate purity; a moderate decrease is observed for the lower values of the ethylene-glycol composition, and then becomes more notorious for values above 0.6 in the mole fraction of ethylene glycol. Likewise, Figure 7(b) shows a linear behavior with a negative slope for energy consumption at the reboiler, and a linear behavior with slope approaching zero for energy consumption at the condenser. The aforementioned results support the conclusion that the most adequate composition for the glycols mixture is 60 mol% of ethylene glycol and 40 mol% of glycerol, in order to obtain a distillate stream with 0.999 or higher molar composition of ethanol.
Brazilian Journal of Chemical Engineering
Figure 7: Effect of the composition of glycols mixture. (a) Composition of distillate. (b) Energy consumption.
Effect of Feed Temperature of Azeotropic Mixture
The importance of analyzing the effect of input temperature for the azeotropic mixture on the extractive column relies on the various possibilities that this represents upstream. In certain occasions, azeotropic alcohol may come from the rectification column in the liquid or vapor phase; also, it is possible to establish heat recovery schemes within the process, in order to adjust the thermal condition of the feed. Most studies included in the literature (Meirelles et al., 1992; Lee and Pahl, 1985; Chianese and Zinnamosca, 1990; Uyazán et al., 2006; Gil et al., 2008) use azeotropic feed at the bubble point as the starting point. Although preheating the mixture could increase the cost of the process, it is feasible to consider an integrated heat exchanger network in the system. In this way, the composition could be improved without affecting the operational cost, as shown in the Simulation of the Distillation Se-quence section. At the same time, the feed stream and the solvent streams are thermally fixed, taking advantage of their energy contents.
Based on the aforementioned results, the separating
agent composition was adjusted and the corre-sponding simulations were performed to evaluate the effect of the feed thermal condition on separation. In order to assess this effect, the temperature range from 10 °C to 150 °C was analyzed, so as to cover three mixture conditions. Figure 8 shows the results of the assessment. In general, increases in tempera-ture within the 10 to 70 °C range have no effect on the ethanol composition in the distillate; on the contrary, a decrease in energy consumption of ap-proximately 10% is observed at the reboiler. How-ever, in those cases in which the alcohol is fed as a vapor-liquid mixture, apparently the quality of the mixture may have a significant effect on the en-ergy requirements of the reboiler. A small reduction is evident in the ethanol composition, due to the water that is dragged with the upper vapor flow. Likewise, reduction in the reboiler energy con-sumption may be justified by the smaller vapor flows that are generated at the bottom of the column. Finally, in the superheated vapor zone, composition and energy consumption decrease while the condenser heat duty remains constant for the whole temperature range.
SIMULATION OF THE DISTILLATION SEQUENCE
Simulations of processes which are relevant at the industrial level help to establish the operating condi-tions and the complete flowsheet, in this case, is necessary for the overall ethanol dehydration process to adjust the main operating conditions of the system. Therefore, a second recovery column was simulated in order to generate the separating agent recycling stream into the extractive column. Furthermore, after establishing the final flowsheet, a thermal analysis was performed on the distillation columns with tools available in the simulator, developed according to the Minimum Thermodynamic Condition principle, as defined by Dhole and Linnhoff (1993).
Flowsheet
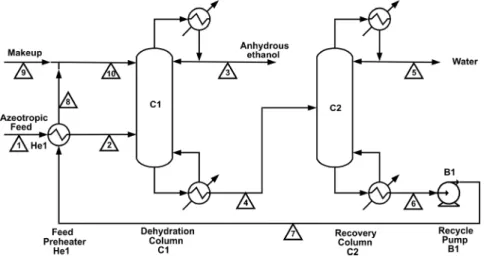
The flowsheet for the distillation sequence simu-lated in Aspen Plus is shown in Figure 9. Parameters for the extractive distillation column are part of the results achieved in the previous section, and are summarized in Table 3, as well as parameters and results for the glycols mixture recovery column. This arrangement features a first column called the dehy-dration column, to which an alcoholic solution is fed at plate 12, with a concentration approaching the azeotropic composition, and to which the separating agent is fed at plate 4. The overhead product for the dehydrating column is alcohol with a concentration exceeding 99.5 mol%. As bottom product, a water-separating agent mixture is achieved; this mixture is
Figure 9: Flowsheet for the extractive distillation using a glycols mixture as separating agent.
Table 3: Operating conditions achieved for the extractive distillation system.
Parameter Value
Azeotropic feed flow (kmol/h) 100
Separating agent flow (kmol/h) 80
Molar fraction of ethylene glycol in separating agent 0.6 Molar fraction of glycerol in separating agent 0.4 Extractive column’s distillate flow (kmol/h) 86.8 Molar fraction of ethanol in distillate 0.99926 Temperature of azeotropic feed (ºC) 20 Temperature of separating agent (ºC) 75 Molar reflux ratio in extractive column 0.5 Number of theoretical stages for the extractive column 20
Azeotropic feed stage 12
Pressure in the extractive column (mmHg) 760
Separating-agent feed stage 4
Solvent/feed ratio (S/F) 0.8
Number of theoretical stages for the recovery column 8 Pressure in the recovery column (mmHg) 150
Feed stage of glycols-water mixture 4
Brazilian Journal of Chemical Engineering driven to a second column, called the recovery
column, which is operated at vacuum pressure in order to separate water from the separating agent, and the latter then recirculated into the dehydration process (stream 5, Figure 9).
Figure 9 shows the flowsheet for the simulation of extractive distillation. The extractive distillation column (C1) and the solvent regeneration column (C2) are modeled; additionally, a recovery scheme is outlined for the heat contained in the recovered separating agent stream (7), which is used to preheat the azeotropic feed (1).
Thermal Analysis
Thermal analysis builds on the minimum thermo-dynamic condition concept for a column. This status corresponds to the column’s reversible operation with no thermodynamic losses (meaning that the column operates at the minimum reflux ratio, with an infinite number of stages and an infinite number of coolers and heaters placed in each of the stages, so that the operation and equilibrium lines coincide at all points) (Dimian, 2003; Samant et al., 2002).
The MTC (Minimum Thermodynamic Condition) is described as the temperature profile vs. enthalpy, or stage vs. enthalpy. These graphs show how the con-denser and reboiler energy duties are distributed throughout the column over the whole temperature interval. Furthermore, MTC may be used to identify
lateral heating and cooling facilities. One column in MTC requires an infinite number of stages with an infinite number of heat exchange facilities in each stage. In this way, the operation line coincides with the equilibrium curve, and their points will overlap throughout the whole composition interval (Dhole and Linnhoff, 1993).
Thermal analysis enables the identification of a se-ries of modifications to the design of any distillation column, as such modifications may be considered by applying a methodology that follows the order de-scribed below (Dimian, 2003; Samant et al., 2002):
1. Proper setting of the feeding stage
2. Changes in operating pressure and reflux ratio 3. Feed conditioning (cooling/heating)
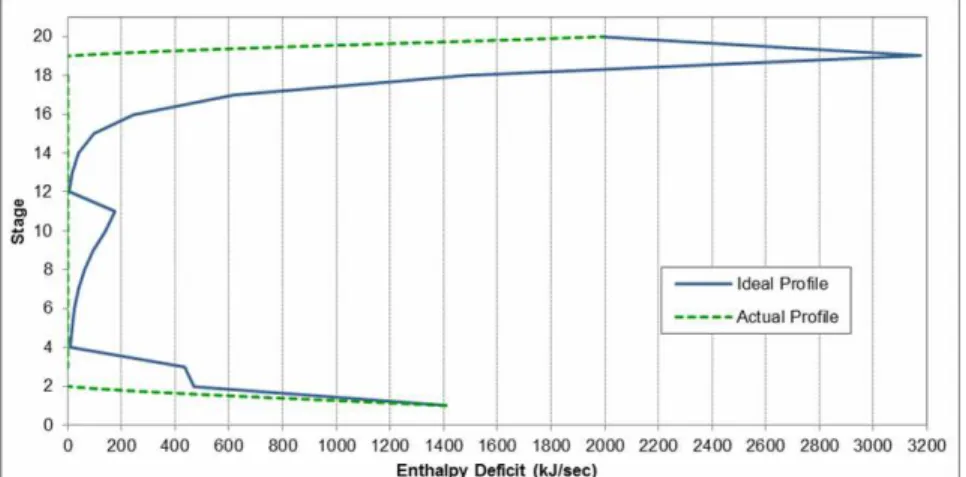
4. Positioning of lateral condensers/reboilers. This survey covered the thermal analysis for the design of the extractive distillation column produced in the previous section. The analysis was initially generated for the base case of the extractive distillation: the stage vs. enthalpy diagram is shown in Figure 10, in which the column heat losses are quantified, according to the operating conditions reported in Table 3. Five cases were analyzed, modifying the values of the main operating variables while the quality of the anhydrous ethanol stream was controlled in order to guarantee high purity ethanol. The modifications made are presented as follows and the main results are summarized in Table 4.
Figure 10: Stage vs. enthalpy diagram for the base case of the extractive distillation column.
Table 4: Results for the thermal analysis of the extractive column.
Case Variable From To Q reb (kJ/kg
anhydrous ethanol)
Q cond (kJ/kg anhydrous ethanol)
Molar fraction of ethanol
1 --- --- --- 1797 1268 0.9992
2 Feed stage 12 16 1799 1268 0.9998
3 Reflux molar ratio 0.5 0.4 1714 1184 0.9997
4 Feed temperature 20 ºC 78.2 ºC 1526 1184 0.9997
The base case diagram shows the formation of a pinch point in stage 11, close to the azeotropic mixture feed point. This profile behavior helps to avoid the need of modifying the location of the feed inlet. Therefore, a second case is set in which all column parameters remain constant while the feed stage changes from stage 12 to stage 16. It should be noted that each modification proposed for the design must not only meet the energy consumption reduc-tion requirement, but also maintain or improve the product purity restrictions set forth. In the case of this survey, the limit is fixed as 0.999 molar composition of ethanol in the distillate.
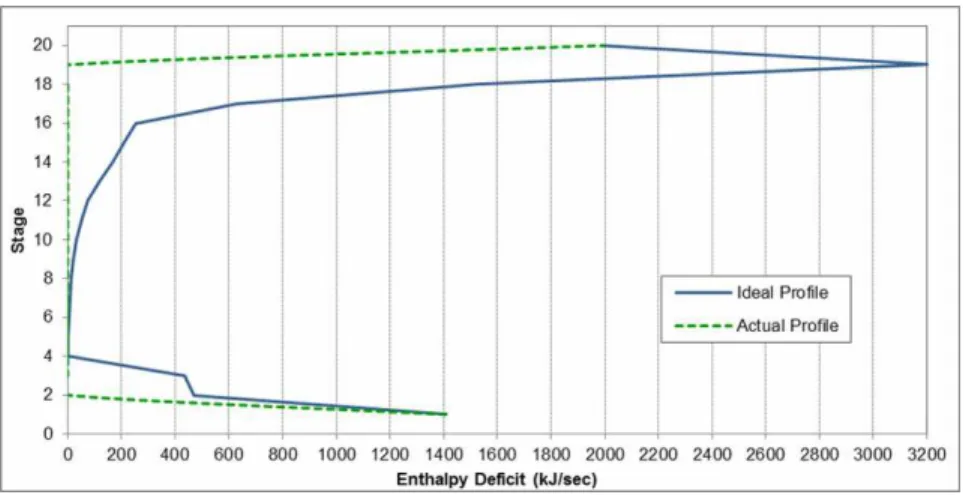
Figure 11 shows the stage vs. enthalpy graph defined for case 2. The results for reboiler and
condenser heat duties show a slight increase in the reboiler duty, which went from 1797 kJ/kg to 1799 kJ/kg of anhydrous ethanol, and a decrease of similar magnitude in the condenser duty. However, the ethanol composition at the distillate increased from 0.9992 to 0.9998, which gives relevance to this modification. Besides, the pinch point in the previ-ous graph was eliminated, and a new possibility to reduce energy consumption through a decrease in the reflux ratio was generated. Figure 12 shows the graph that is generated when the value of the reflux molar ratio is reduced from 0.5 to 0.4 (case 3); please note that the enthalpy deficit values have been reduced, thus implying a reduction in the operation overall energy consumption.
Figure 11: Stage vs. enthalpy graph for the extractive distillation column upon modifying the azeotropic mix feeding stage, from stage 12 to stage 16
Brazilian Journal of Chemical Engineering Finally, the possibility to preheat the feed is
considered, in order to maintain the distillate compo-sition and to diminish the column energy consump-tion levels. The plan is to initially raise the tempera-ture from 20 to 78.2 ºC, so that the feed enters as saturated liquid, and to leverage part of the heat contained in the separating agent recycling stream (see Figure 13). As found in the section of the Effect of feed temperature of the azeotropic mixture, the distillate composition is not affected, while energy consumption is effectively reduced. However, it is still possible to extract more heat from the separating agent stream, and generate a vapor-liquid mixture. Case 5 featured a vapor fraction of 0.25 for the azeotropic feed, and significant reductions were observed, leading to the conclusion that the extrac-tion of the highest amount of heat possible from the recovered separating-agent stream is feasible. In this way, the final adjustment to the flowsheet was a decrease in the input temperature for the separating agent that would enable a satisfactory separation and the effective extraction of the highest amount of heat
possible. Exact values of changes in composition and energy consumption for each of the alternatives pro-posed in the thermal analysis are included in Table 3.
As illustrated, the more significant changes in the energy consumption reduction were detected when the reflux ratio was diminished and the inlet tem-perature for the azeotropic feed was modified. As mentioned before, case 5 showcased the possibility to adjust the amount of heat that is extracted during feed preheating. After performing some simulations, it was possible to determine that the temperature for the separating agent could be fixed at 60 ºC without affecting separation; therefore, it is possible to feed the azeotropic mixture with a vapor fraction of 0.214. Complete results for the system simulation are included in Table 5, according to the process flow-sheet in Figure 9. In Table 5, streams 1 and 2 refer to the azeotropic feed, which is preheated from 20 °C to 78,2 °C. Stream 3 is the distillate, in which the mole fraction of ethanol is too high and stream 7 is the mixture of glycols recovered from the second column in the system.
Figure 13: Stage vs. enthalpy diagram for the base case of the extractive distillation column after modifying the azeotropic feed temperature (from 20 to 78.2 ºC).
Table 5: Final results for the simulation of the distillation sequence.
Stream 1 2 3 4 5 6 7 8 9 10
Flow rate (kmol/h) 100 100 86.8 93.2 13.3 79.9 79.9 79.9 0.1 80 M.F. ethanol 0.8800 0.8800 0.9997 0.0131 0.0919 0.0000 0.0000 0.0000 0.0000 0.0000 M.F. water 0.1200 0.1200 0.0002 0.1286 0.8990 0.0004 0.0004 0.0004 0.0000 0.0000 M.F. ethylene glycol 0.0000 0.0000 0.0001 0.5149 0.0091 0.5991 0.5991 0.5991 1.0000 0.6000 M.F. glycerol 0.0000 0.0000 0.0000 0.3433 0.0000 0.4000 0.4000 0.4000 0.0000 0.4000 Temperature (ºC) 20.000 78.154 78.312 156.724 49.892 163.976 164.058 60.000 60.000 60.000 Vapor Fraction 0.000 0.214 0.000 0.000 0.000 0.000 0.000 0.000 0.000 0.000
CONCLUSIONS
The selected thermodynamic model accurately matches the experimental data on vapor-liquid equi-librium in ternary systems. This study allows the definition of the operating conditions for an extrac-tive distillation process that uses a mixture of glycols as separating agent. In the case of extractive distilla-tion of ethanol, it is not positive to divide the sepa-rating agent stream into two different stages, since single-stage feed provides better results. Further-more, it may be concluded that the optimal stage for separating agent feed is stage 4 and that, as this stage approaches to the overhead, the energy consumption increases and the amount of ethanol present in the distillate decreases. Additionally, it was found that the mixing of ethylene glycol and glycerol is positive for the operation, since the high capacity to retain water by glycerol is leveraged. At the same time, the operating temperatures for the column bottom are kept at moderate levels due to the presence of ethylene glycol, a solvent that features a boiling point lower than that of glycerol. The composition of glycerol in the glycols mixture enables the indirect regulation of the distillate purity and the reboiler energy consumption.
REFERENCES
Barba, D., Brandani, V. and Di Giacomo, G., Hyperazeotropic ethanol salted-out by extractive distillation. Theoretical evaluation and experi-mental check. Chemical Engineering Science, 40(12), p. 2287-2292 (1985).
Black, C. and Distler, D., Dehydration of aqueous ethanol mixtures by extractive distillation. Extrac-tive and azeotropic distillation. Advances in Chem-istry Series, 115, p. 1-15 (1972).
Black, C., Distillation modeling of ethanol recovery and dehydration processes for ethanol and gaso-hol. Chemical Engineering Progress, 76, p. 78-85 (1980).
Chianese, A. and Zinnamosca, F., Ethanol dehydra-tion by azeotropic distilladehydra-tion with mixed solvent entrainer. The Chemical Engineering Journal, 43, p. 59-65 (1990).
Dhole, V. R. and Linnhoff, B., Distillation column targets. Computers and Chemical Engineering, 17(5/6), p. 549-560 (1993).
Dimian, A. C., Integrated design and simulation of chemical processes. Computer Aided Chemical Engineering, 13, Elsevier (2003).
Doherty, M. F. and Malone, M. F., Conceptual Design of Distillation Systems. McGraw Hill. New York (1995).
Furter, W., Extractive distillation by salt effect. Chemi-cal Engineering Communications, 116, p. 35-40 (1992).
García-Herreros, P., Gómez, J. M., Gil, I. D. and Rodríguez, G., Optimization of the design and operation of an extractive distillation system for the production of fuel grade ethanol using glycerol as entrainer. Industrial and Engineering Chemistry Research, 50(7), p. 3977-3985 (2011). Gil, I. D., Diseño, Montaje y Puesta en Marcha de un
Sistema de Destilación Extractiva a Nivel Piloto para la Producción de Alcohol Anhidro. Universidad Nacional de Colombia. Tesis de Maestría (2006). (In Spanish).
Gil, I. D., Gómez, J. M. and Rodríguez, G., Control of an extractive distillation process to dehydrate ethanol using glycerol as entrainer. Computers and Chemical Engineering, 39(6), p. 129-142 (2012). Gil, I., Uyazán, A., Aguilar, J., Rodríguez, G. and
Caicedo, L., Separation of ethanol-water mixtures by extractive distillation with salt and solvent as entrainer: Process simulation. Brazilian Journal of Chemical Engineering. 25(1), p. 207-215 (2008). Gomis, V., Pedraza, R., Francés, O., Font, A. and
Asensi, J., Dehydration of ethanol using azeo-tropic distillation with isooctane. Industrial and Engineering Chemistry Research, 46(13), p. 4572-4576 (2007).
Hanson, N, Lynn, F. and Scott, D., Multi-effect extractive distillation for separating aqueous azeo-tropes. Industrial Engineering Chemical Process Des.Dev., 25, p. 936-941 (1988).
Jacques, K., Lyons, T. and Kelsall, D., The Alcohol Textbook. Nottingham University Press. 3rd Ed., Chapters 17 and 19 (1999).
Knapp, J. P. and Doherty, M. F., Minimum entrainer flows for extractive distillation: A bifurcation theoretic approach.AIChE Journal, 40(2) p. 243-268 (1994).
Kumar, S., Singh, N. and Prasad, R., Anhydrous ethanol: A renewable source of energy. Renewable and Sustainable Energy Reviews, 14, p. 1830-1844 (2010).
Laroche, L., Bekiaris, N., Andersen, H. W. and Morari M., The curious behavior of homogeneous azeo-tropic distillation – implications for entrainer se-lection. AIChE Journal, 38, p. 1309-1328 (1992). Lee, F. and Pahl, R., Solvent screening study and
Brazilian Journal of Chemical Engineering broth. Industrial Engineering Chemical Process
Des. Dev., 24, p. 168-172 (1985).
Lee, F. and Gentry, J., Don’t overlook extractive distillation. Chemical Engineering Progress, p. 56-64 (1997).
Lei, Z., Wang, H., Zhou, R. and Duan, Z., Influence of salt added to solvent on extractive distillation. Chemical Engineering Journal, 87, p. 149-156 (2002).
Ligero, E. L. and Ravagnani, T. M. K., Dehydration of ethanol with salt extractive distillation – a comparative analysis between processes with salt recovery. Chemical Engineering and Processing, 42, p. 543-552 (2003).
Llano, M. and Aguilar, J., Modeling and simulation of saline extractive distillation columns for the production of absolute ethanol. Computers and Chemical Engineering, 27(4), p. 527-549 (2003). Meirelles, A., Weiss, S. and Herfurth, H., Ethanol
dehydration by extractive distillation. Journal Chemistry and Tech Biotechnology, 53, p. 181-188 (1992).
Perry, R., Perry’s Chemical Engineering. United States of America. McGraw-Hill. 7th Ed. (1992). Pinto, R. T. P., Wolf-Maciel, M. R. and Lintomen,
L., Saline extractive distillation process for ethanol purification. Computers and Chemical Engineer-ing, 24, p. 1689-1694 (2000).
Pla-Franco, J., Lladosa, E., Loras, S. and Montón, J. B., Phase equilibria for the ternary systems ethanol, water + ethylene glycol or + glycerol at 101.3 kPa. Fluid Phase Equilibria, 341, p. 54-60 (2013).
Ramanujam, M. and Laddha, G., Vapor liquid equi-libria for ethanol-water-ethylene glycol system.
Chemical Engineering Science, 12(1), p. 65-68 (1960).
Ravagnani, M. A. S. S., Reis, M. H., Maciel Filho, R. and Wolf-Maciel, M. R., Anhydrous ethanol production by extractive distillation: A solvent case study. Process Safety and Environmental Protection, 88(1), p. 67-73 (2010).
Rodriguez-Donis, I., Gerbaud, V. and Joulia, X., Thermodynamic insights on the feasibility of homogeneous batch extractive distillation, 1. Azeotropic mixtures with a heavy entrainer. Industrial and Engineering Chemistry Research, 48(7), p. 3544-3559 (2010).
Samant, K., Sinclair, I. and Keady, G., Integrated thermal and hydraulic analysis of distillation columns. Proceedings from the Twenty-Fourth National Industry Energy Technology Confer-ence. Houston, TX (2002).
Schmit, D. and Vogelpohl, A., Distillation of ethanol-water solutions in the presence of potassium acetate. Separation Science and Technology, 18(6), p. 547-554 (1983).
Ulrich, S. and Pavel, S., Design and operation of a pervaporation plant for ethanol dehydration. Journal of Membrane Science, 36, 463-475 (1988). Uyazán, A. and Gil, I., Simulación de la Deshidrata-ción de Etanol Azeotrópico por DestilaDeshidrata-ción Extrac-tiva. Tesis de Grado para Optar al Título de Inge-niero Químico. Universidad Nacional de Colombia. Bogotá (2003). (In Spanish).