*e-mail: [email protected]
Article presented at the VIII Encuentro Latinoamericano de Fotoquímica y Fotobiologia, La Plata, 2004
Luminescence Spectroscopy Applied to a Study of the Curing
Process of Diglycidyl-Ether of Bisphenol-A (DGEBA)
Rita de Cássia Mendonça Sales, Deborah Dibbern Brunelli*
Department of Chemistry, Instituto Tecnológico de Aeronáutica,
Praça Marechal Eduardo Gomes, 50, Vila das Acácias
12228-900 São José dos Campos - SP, Brazil
Received: November 18, 2004; Revised: March 22, 2005
This work involved the application of luminescence spectroscopy under steady-state conditions to study the curing process of the epoxy resin diglycidyl-ether of bisphenol-A (DGEBA) using the curing agents 4,4’-diaminodiphenylmethane (DDM) and 4,4’-diaminodiphenylsulfone (DDS). Two fluorescence methods were employed: the intrinsic method related to the polymeric matrix and the extrinsic method, using the molecular probe 9-anthroic acid (9-AA). Stoichiometric mixtures, with and without 9-AA, were heated to 120 °C at a 5 °C/min heating rate. These samples were then cured at 120 °C for a further 2 hours and allowed to cool to room temperature for 20 minutes. The results obtained by the two methods indicate that the cross-linking reaction can be monitored by analyzing the spectral changes of the emission bands of DGEBA, curing agents and 9-AA.
Keywords:composites, intrinsic luminescence, extrinsic luminescence, heat treatment
1. Introduction
High performance composites of fiber-reinforced organic resin are increasingly used in the aeronautics and space industries. Char-acterization of the extent of cure and water uptake in polymers and composites before, during and after the manufacturing process is extremely important to improve their mechanical properties1.
Several methods such as differential scanning calorimetry (DSC)2-4, temperature modulated differential scanning calorimetry
(TMDSC)5,6, dielectric analysis (DEA), dynamic-mechanical
analy-sis (DMA)3,7-9 and infrared spectroscopy (FTIR)10,11 have been used
to monitor the curing process of resins and composites. However, thermal and dynamic methodologies are not applicable on-line and are destructive analytical techniques. Although infrared absorption can follow primary changes in chemical reactions, since epoxy cure monitoring is possible through absorption in the primary amine region at 3367 cm-1, it is not useful for monitoring opaque or black samples.
In contrast to other techniques, luminescence spectroscopy is both sensitive and selective, and can be used for the nondestructive analysis of polymerization processes both on- and off-line.
Luminescence spectroscopy has been used to study the curing process and the water uptake of polymeric resins and composites. It has been reported that the spectral shifts of the intrinsic fluorescence of samples can be used to determine the extent of the cure in epoxy composites cured with a commonly used aromatic diamine12.
The technique’s high sensitivity also allows for studies of the glass fiber-matrix interface, using suitable extrinsic fluorophores or molecular probes, which present different photophysical behaviors when located in the polymer matrix or on glass fiber surfaces13.
Hakala et al.14 monitored the curing process and shelf life of the
epoxy-anhydride system, using the luminescence of intramolecular charge-transfer compounds. These researchers observed that the probes displayed blue or red shifts upon polymerization at different temperatures.
Strehmel et al.15 studied a charge transfer probe – the
Tetraeth-ylene glycol diacrylate (TEGDA) system, during the cure process. They noted the appearance of a new band in the blue region, while the
emission in the red region decreased due to the cross-linking reaction involved in changes in the free volume of the polymeric matrix.
The purpose of this work is to study the influence of the heat treatment of stoichiometric mixtures of DGEBA/DDM and DGEBA/ DDS through intrinsic and extrinsic fluorescence methods, using the 9-anthroic acid (9-AA) molecular probe.
2. Materials and Methods
2.1. Preparation of the samples
The following solutions were prepared: 1 x 10⁻² mol/L
DGEBA (diglycidyl-ether of bisphenol-A-D.E.R.331 – Dow Chemical Products Ltd.) in n-butanol (Merck) and 1 x 10⁻³, 1 x 10⁻⁴,
1 x 10⁻⁵ mol/L 9-AA (9-anthroic acid - Aldrich Chemical Company,
Inc.) in DGEBA.
The curing agents DDS (4,4’-diaminodiphenylsulfone – HT 976 – Ciba Geigy Chemical S/A) and DDM (4,4’-diaminodiphenylmeth-ane – D.E.H.50 – Dow Chemical Products Ltd.) were used to prepare stoichiometric mixtures of DGEBA/DDS (10:3 m/m) and DGEBA/ DDM (10:2.7 m/m) with and without 9-AA. The stoichiometric mixtures, with and without 9-AA, were heated to 120 °C at a rate of 5 °C/min using a woven EDG3000 – EDGCON3P. These samples were then heat-treated at 120 °C for another 2 hours and allowed to cool to room temperature for 20 minutes (Figure 1).
2.2. Fluorescence spectra
Fluorescence spectra were measured using a steady-state lumi-nescence spectrometer (FS920 – Edinburgh Analytical Instruments) in the photo-counting mode, equipped with a xenon arc lamp 450 W (Osram Co.) and double holographic grating monochromators of excitation and emission (Czerny-Turner configurations).
bands in the 290-380 nm range. The fluorescence spectra of DGEBA, curing agents (DDM and DDS) and 9-AA were measured in the excitation wavelengths of 313, 370 and 395 nm, respectively.
3. Results and Discussion
3.1. Intrinsic fluorescence method
The intrinsic luminescence of the resin was studied by inves-tigating the photophysical behavior of 1 x 10⁻² mol/L DGEBA in
n-butanol solution (Figure 2). The excitation spectra showed a broad band with its maximum at 294 nm and two shoulders with maxima at 310 and 320 nm (Figure 2.1). The excitation wavelengths at 290 and 310 nm were used to obtain the emission spectra. Two unstructured emission bands with maximum wavelengths at 313 (Figure 2.2.) and 345 nm (Figure 2.3) were found to be dependent on the excitation wavelength.
Some fluorescent probes whose chromophores contain both an electron donor and an electron acceptor via their conjugation through an aromatic ring can form intramolecular charge transfer (ICT) com-plexes. Upon excitation, the bond between the donor and the acceptor
120 °C - Room Temp A= 5 °C/min 120 °C - 120 min
Room Temp - 120 °C A= 5 °C/min
T
emperature (°C)
120
100
80
60
40
20
0 20 40 60 80 100 120 140 160
Time (min)
Figure 1. Heat treatment of the DGEBA/DDS and DGEBA/DDM samples.
300 350 400 450 500 550 600
3 2
1
Wavelength (nm)
Intensity (a.u.)
Figure 2. Excitation and fluorescence spectra of DGEBA in n-butanol (1 x 10⁻² mol/L): 1) excitation monitored at 345 nm and fluorescence excited
at 2) 290 nm and (3) 310 nm.
is twisted within the singlet state lifetime due to intramolecular charge separation. As a result, such molecules emit from two excited singlet states, one coplanar and the other twisted, and typically exhibit dual fluorescence emissions16,17. Since the DGEBA structure (Figure 3)
contains both groups linked by aromatic rings, it may suggest the formation of ICT complexes in the macromolecule, which would explain the two emission bands17.
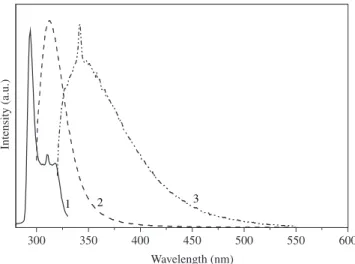
Figure 4 shows the excitation spectra of the DGEBA and DDM mixture before and after the 2 hours (5 °C/min heating rate) 120 °C heat treatment. The excitation spectra of the DGEBA and DDM mixture before the heat treatment show a band at 329 nm (Figure 4.1) relating to the DGEBA and a band with 336 and 359 nm maxima (Figure 4.3) assigned to the DDM. After the heat treatment, the ex-citation spectra of the DGEBA and DDM mixture show an increase in the relative intensity of the band at 331 nm (Figure 4.2), which was assigned to the DGEBA. A significant red shift of the excitation maximum (Figure 4.4) to 395 nm was observed and attributed to DDM emission.
Figure 5 shows the emission spectra of the DGEBA and DDM mix-ture before and after the heat treatment at 120 °C for 2 hours (5 °C/min heating rate). The fluorescence spectra of DGEBA and DDM mixture, before the heat treatment, show a weak band at 350 nm (Figure 5.1) associated with the DGEBA emission, as shown in Figure 2.2, and a weak band at 428 nm (Figure 5.2) attributed to the DDM emission.
After the heat treatment, the fluorescence spectra of the DGEBA and DDM mixture revealed an increase in the band’s relative intensity at 351 nm (Figure 5.3), which was assigned to the DGEBA emission. A significant red shift to 475 nm occurred in the emission maximum (Figure 5.4), attributed to DDM emission. The DDM curing agent contains primary amines and the curing reaction consists of the conversion of these groups into secondary and tertiary groups. The spectral shift of the emission band has to do with the conversion of primary amines into secondary and tertiary amines during the cur-ing process18. Dang and Sung19,20 observed a similar behavior using
the molecular probe diaminoazobenzene (DAA), which presented a quantum yield increase and a red shift of the absorption maxima pursuant to the conversion of primary into tertiary amines, as well greater electron-donating ability. Therefore, the same attribution possibly holds true for DDM emission. Based on this photophysical behavior, one can conclude that the intrinsic fluorescence of DGEBA and DDM can also be used to monitor their curing reaction, since spectral changes in DDM fluorescence occurred.
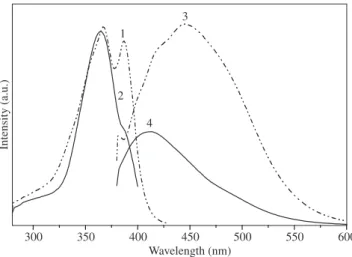
The excitation spectra of he DGEBA/DDS mixture before the curing process (Figure 6.1) show a weak broad band at 355 nm. This band was also observed by Sung and Paik19. After the DGEBA/DDS
mixture was cured, a red shift occurred in the excitation band (Fig-ure 6.2) and the relative intensity of the band at 365 nm increased due to a conversion of primary amines into secondary and tertiary amines1,12,19,20.
Figure 6 shows the fluorescence spectra of the DGEBA and DDS mixture before (Figure 6.3) and after the heat treatment (Figure 6.4). The excitation wavelength was fixed at 350 nm, since emission spectra are independent of excitation wavelengths. The mixture not heat-treated displayed an emission band at 382 nm. Even so, a red shift of the emission band to 395 nm occurred after the heat treatment. This band was attributed to DDS fluorescence. The curing reaction of epoxy-diamine monitored in situ using intrinsic fluorescence of DGEBA with DDS reportedly displays a spectral shift in both ab-sorption and fluorescence spectra in response to the conversion of primary to tertiary amine21,22.
O
H2C CHCH2O OCH2CHCH2O OCH2HC
CH3
CH3 C
CH3
CH3
CH2 C
OH O
n
Diglycidyl ether of Bisphenol-A
Figure 3. Chemical structure of DGEBA epoxy resin.
Intensity (a.u.)
Wavelength (nm)
280 300 320 340 360 380 400 420
4 3
2
1
Figure 4. Excitation spectra of the stoichiometric DGEBA/DDM mixture (100:27 m/m) monitored at: 1) and 2) 350 nm; 3) 415 nm and 4) 452 nm. Dashed lines refer to DGEBA/DDM mixture before heat-treating; full lines correspond to the DGEBA/DDM mixture after heat-treating at 120 °C for 2 h (5 °C/min heating rate).
300 350 400 450 500 550 600
4 3
2 1
Wavelength (nm)
Intensity (a.u.)
Figure 5. Fluorescence spectra of the stoichiometric DGEBA/DDM mixture (100:27 m/m) excited at: 1) and 3) 313 nm; 2) and 4) 370 nm. Dashed lines refer to the DGEBA/DDM mixture before heat-treating; full lines refer to the DGEBA/DDM mixture after heat-treating at 120 °C for 2 h (5 °C/min heating rate).
300 350 400 450 500 550 600
2
1
Intensity (a.u.)
Wavelenght (nm) 3
4
Figure 6. Excitation and fluorescence spectra of the stoichiometric DGE-BA/DDS mixture 100:30 m/m: excitation monitored at 1) 385 nm and 2) 393 nm and fluorescence excited at 3) and 4) 350 nm. Dashed lines refer to the DGEBA/DDM/9AA mixture before heat-treating; full lines refer to the DGEBA/DDM/9AA mixture after heat-treating at 120 °C for 2 h (5 °C/min heating rate).
Figure 7. Chemical structure of curing agents: a) DDM; b) DDS.
CH2 NH2
H2N
(a)
(b)
that the SO2 functional group of the DDS structure exerts a delaying action on the reactivity of the amine functions since it is a highly electron-attracting group, which deactivates benzene rings and de-creases the basicity of diamine. This effect is further enhanced by para-substitution, since the electron transfer from NH2 to SO2 is easier. In contrast, the CH2 group in DDM is an electron-donating group that stabilizes the benzene ring. Therefore, DDM is more reactive
SO2 NH2
than DDS22.23. The net result of this behavior is that DDM reacts at
a faster rate than DDS, and the degree of curing is probably highest in the DGEBA and DDM mixture.
3.2. Extrinsic fluorescence method
This sub-section discusses the photophysical behavior of 9-AA which is dependent on the curing reaction of the polymeric matrix. This required an analysis of the influence of the molecular probe concentration in DGEBA solutions.
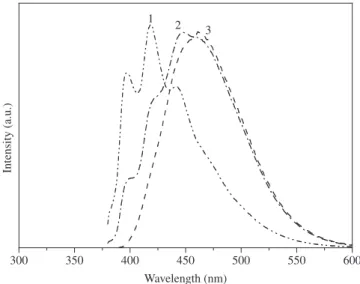
Figure 8 depicts the emission spectra of 9-AA in DGEBA in con-centrations of 1 x 10⁻⁵, 1 x 10⁻⁴ and 1 x 10⁻³ mol/L. The fluorescence
spectrum of 1 x 10⁻⁵ mol/L 9-AA in DGEBA solution (Figure 8.1)
shows a vibronically structured band that is quite similar to the anthra-cene emission band. Previous studies have shown that the carboxylic ion of the 9-AA ionized form remains in the perpendicular plane in relation to the anthracenic ring in the excited electronic state, so the net result is an anthracene-like emission24. Therefore, it can be
concluded that the structured emission band was attributable to the ionized form of 9-AA. The decreased intensity of the peak at 390 nm resulted from reabsorption caused by the spectral overlapping of both absorption and emission bands.
As the concentration increased, a broad band appeared at 448 nm superimposed over the structured one (Figure 8.2), which was at-tributed to the protonated form of 9-AA (Figure 9). According to the above discussion, the protonated form presents a rotation of the carboxyl group in the excited state into a position approaching co-planarity with the anthracene ring. This can cause a significant resonance interaction between the carboxyl groups and change the nature of the excited state, resulting in the broad emission band.
A further increase in the concentration of the solution was found to relate to a red shift of the unstructured band (Figure 8.3) at 462 nm. This band was attributed to the formation of the hydrogen-bonded dimer of the 9-AA protonated form25.26.
Figure 10 shows the excitation and fluorescence spectra of a mixture of DGEBA and DDM containing the 9-AA fluorescent probe before and after heat treatment. The excitation spectra of the mixture before heat treatment (Figure 10.1) show a broad band with a maximum at 363 nm and a shoulder at 318 nm. After heat-treating (Figure 10.2), the shoulder disappeared and a red shift of the band was observed with a maximum at 404 nm. Momiji26 observed the
same 10-4 mol/L 9AA band in neutral solutions of 0.4 mol/L SDS,
and attributed it to a dimeric form of 9AA.
The emission spectra of the DGEBA/DDM/9-AA mixture before heat-treating show two superimposed bands with emission maxima at 457 and 481 nm (Figure 10.3), which were attributed to the equilib-rium of the dimer and protonated forms of 9-AA. It was found that both emissions were red shifted in relation to 9-AA in concentrated DGEBA solutions (Figure 8.2). This spectral shift probably resulted from changes in the average polarity, since DDM curing agent was added to the resin.
After the heat treatment, a spectral shift of the emission band occurred at 481 nm (λexc = 395 nm) (Figure 10.4), assigned to the fluorescence of 9-AA, suggesting that this band related to the dimeric form of 9-AA. The presence of dimers in the polymeric matrix indi-cates the increase of the local concentration of 9-AA. The presence of chemical cross-links in a polymer sample reportedly decreases its specific volume, i.e., the free volume is reduced27. Hence, it can
be concluded that the extrinsic fluorescence of the molecular probe serves to monitor the curing reaction as effectively as the intrinsic method.
Figure 11 shows the excitation spectra of the 9-AA molecular probe dissolved in the DGEBA/DDS mixture before and after heat
300 350 400 450 500 550 600
Intensity (a.u.)
Wavelength (nm) 3 2 1
Figure 8. Fluorescence spectra of 9-AA in DGEBA solutions in concentrations (mol/L) of 1)1 x 10⁻⁵; 2) 1
x 10-4; 3) 1
x 10-3 (λ
exc= 370 nm).
+ +
Protonated Form Ionized Form
COOH
COO-ROH ROH2+
Figure 9. Acid-basic equilibrium of 9-AA in protic solvents.
treatment, revealing a structured band before the heat treatment with maxima at 367 and 387 nm (Figure 11.1). After the heat treatment (Figure 11.2), the maximum at 387 nm disappeared and the band shifted to blue.
As can be seen in the Figure, 9-AA dissolved in the DGEBA/DDS mixture displayed emission bands at 445 nm (Figure 11.3) before and 410 nm (Figure 11.4) after the heat treatment. It should be noted that the emission maximum shifted to blue as the sample was heated,
280 320 360 400 440 480 520 560 600
Intensity (a.u.)
2 1
Wavelength (nm)
4 3
300 350 400 450 500 550 600 4
3
2 1
Intensity (a.u.)
Wavelength (nm)
Figure 11. Excitation and luorescence spectra of the DGEBA/DDS/9-AA mixture: excitation monitored at 1) 445 nm and 2) 415 nm, luorescence ex-cited at 3) and 4) 365 nm. Dashed lines refer to DGEBA/DDM/9AA mixture before heat-treating; full lines refer to the DGEBA/DDM/9AA mixture after heat-treating at 120 °C for 2 h (5 °C/min heating rate).
possibly due to an equilibrium displacement from the dimeric to the protonated form of 9-AA.
The photophysical behavior of 9-AA in the DGEBA/DDM and DGEBA/DDS mixtures after the heat treatment was quite different, for the dimeric form was detected in the former and the protonated form in the latter mixture. Based on the intrinsic fluorescence method, we propose that DDM reacts at a faster rate than DDS. The results obtained through the extrinsic fluorescence method indicate that the delay in the curing reaction of DGEBA with DDS may favor the diffusion of the molecular probe through the polymeric matrix, reducing its local concentration and displacing its equilibrium, tend-ing toward the formation of the protonated species of 9-AA. These results suggest that the curing reaction can also be monitored by the extrinsic method.
4. Conclusions
The results obtained through the intrinsic fluorescence method indicate that the cross-linking reaction can be monitored based on an analysis of the red shift of the DGEBA emission bands and the curing agents. The spectral changes in DDM and DDS fluorescence relate to the conversion of primary amines into secondary and tertiary amines. Nonetheless, this effect was more pronounced in the DGEBA/DDM mixture than in the DGEBA/DDS mixture due to the higher reactivity of DDM during heat treatment.
The extrinsic fluorescence method showed that the photophysical behavior of 9-AA in the DGEBA/DDM and DGEBA/DDS mixtures after heat treatment was quite different, for the dimeric form was detected in the former mixture and the protonated form in the lat-ter. The presence of the dimeric form in the DGEBA/DDM mixture indicated that the cross-linking reaction reduced the free volume and increased the concentration of 9-AA. On the other hand, the presence of the protonated form in the DGEBA/DDS mixture after the heat treatment indicated that it may have diffused through the polymeric matrix, since the DDS curing agent was less reactive.
Finally, it was concluded that fluorescence spectroscopy is sensi-tive and suitable in studies of the curing process by both the intrinsic and the extrinsic methods.
Acknowledgments
The authors gratefully acknowledge the financial support of this work by FAPESP (Brazil). R. C. M. S. is indebted to CAPES (Brazil) for a fellowship.
References
1. Sung CSP, Sung NH. Fluorescence characterization of cure and water uptake in polymers and composites. Materials Science and Engineering A. 1993; 162(1-2): 241-247.
2. Zvertkov VL. Comparative DSC kinetics of the reaction of DGEBA with aromatic diamines. I. Non-isothermal kinetic study of the reaction of DGEBA with m-phenylene diamine. Polymer. 2001; 42(16): 6687-6697.
3. Ramis X, Cadenato A., Morancho JM, Salla JM. Curing of a thermoset-ting powder coathermoset-ting by means of DMTA, TMA and DSC. Polymer. 2003; 44(7): 2067-2079.
4. Montserrat S, Cima I. Isothermal curing of an epoxy resin by alternating differential scanning calorimetry. Thermochimica Acta. 1999; 330(1-2): 189-200.
5. Montserrat S, Martín JG. Non-isothermal curing of a diepoxide-cy-cloaliphatic diamine system by temperature modulated differential scanning calorimetry. Thermochimica Acta. 2002; 388(1-2): 343-354. 6. Li C, Potter K, Wisnom MR, Stringer G. In-situ measurement of
chemi-cal shrinkage of MY750 epoxy resin by a novel gravimetric method. Composites Science and Technology. 2003; 63(1): 1-10.
7. Van-De-Velde JG, Marsh RDL, Wetton RE. Theory and application of dynamic mechanical thermal analysis. Thermochimica Acta. 1991; 175(1): 1-11.
8. Oulevey F, Burnham NA, Gremaud G, Kulik AJ, Pollock HM, Hammiche A, et al. Dynamic mechanical analysis at the submicron scale. Polymer. 2000; 41(8): 3087-3092.
9. Kim HG, Lee DG. Dielectric cure monitoring for glass/polyester prepreg composites. Composite Structure. 2002; 57(1-4): 91-99.
10. Benito JG. The nature of the structural gradient in epoxy curing at a glass/fiber epoxy matrix interface using FT-IR imaging. Journal of Col-loid and Interface Science. 2003; 267(2): 326-332.
11. Monney L, Belali R, Vebrel J, Dubois C, Chambaudet A. et al. Photo-chemical degradation study of an epoxy material by IR-ATR spectroscopy. Polymer Degradation and Stability. 1998; 62(2): 353-359.
12. Sung CSP, Yu JW. Interphase cure characterization in epoxy composites by fluorescence technique. Journal of Applied Polymer Science. 1997; 63(13):1769-1775.
13. Baselga J, Pozuelo J. Curing of polymer matrix composites. Fluorescence study of dansyl fluorophore labeled to glass fibers and DGEBA-ethylen-ediamine epoxy resin. Journal of Materials Processing Technology. 2003; 143-144: 332-336.
14. Hakala K, Vatanparast R, Li S, Peinado C, Bosh P, Catalina F, et al. Monitoring of curing process and shelf life of the epoxy-anhydride system with TICT compounds by the fluorescence technique. Macromolecules. 2000; 33(16): 5954-5959.
15. Strehmel B, Malpert JH, Sarker AM, Neckers D C. New intramolecular fluorescence probes that monitor photoinduced radical and cationic cross-linking. Macromolecules. 1999; 32(22): 7476-7482.
16. Neckers DC, Bao R, Song JC, Wang ZJ. Fluorescence probes for moni-toring polymerization processes. Journal of Polymer Science. Part B: Polymer Physics. 1996; 34(2): 325-333.
17. Birks JB. Photophysics of Aromatic Molecules.revised ed. London: John Wiley & Sons; 1995.
18. Strehmel B, Strehmel V, Younes M. Fluorescence probes for investigation of epoxy systems and monitoring of crosslinking processes.Journal of Polymer Science: Part B: Polymer Physics. 1999; 37(13): 1367-1386.
and Science. 1994; 34(12): 1025-1032.
20. Dang W, Sung NH. In-situ cure monitoring of diamine cured epoxy by fiberoptic fluorometry using extrinsic reactive fluorophore. Polymer Engineering and Science. 1994; 34(9): 707-715.
21. Baselga J, Martin O. The use of 9- anthroic acid and new amide derivatives to monitorize curing of epoxy resins. Journal of Materials Processing Technology. 2003; 143-144: 851-855.
22. Boey FYC, Yap BH. Microwave curing of an epoxy-amine system: effect of curing agent on the glass-transition temperature. Polymer Testing. 2001; 20(8): 837-845.
23. Boey FYC, Yap BH, Chia L. Microwave curing of epoxy-amine system: effect of curing agent on the rate enhancement. Polymer Testing. 1999;
18(2): 93-109.
24. Suzuki S, Fujii T, Yoshiike N. Polarization of the excimer-type transition in 9-anthroic acid. Chemical Physics Letters. 1979;62(2): 287-290.
25. Suzuki S, Fujii T, Yoshiike N, Komatsu S, Toshido I. Absorption and fluorescence spectra of anthracenecarboxylic acids. I. 9-anthroic acid and formation of excimer. Bulletin of the Chemical Society of Japan. 1978; 51(9): 2460-2466.
26. Momiji I, Yoza C, Matsui K. Fluorescence spectra of 9- anthracene-carboxylic acid in heterogeneous environments. Journal of Physical Chemistry B. 2000;104(7): 1552-1555.