ISSN 0104-6632 Printed in Brazil
www.abeq.org.br/bjche
Vol. 27, No. 03, pp. 429 - 440, July - September, 2010
Brazilian Journal
of Chemical
Engineering
PARETO OPTIMIZATION OF AN INDUSTRIAL
ECOSYSTEM: SUSTAINABILITY MAXIMIZATION
J. G. M.-S. Monteiro, P. A. C. Silva, O. Q. F. Araújo
*and J. L. Medeiros
1Department of Chemical Engineering, Federal University of Rio de Janeiro,
Av. Horácio Macedo 2030, Centro de Tecnologia, Bloco E, Sala 209, CEP: 21941-909, Rio de Janeiro - RJ, Brazil.
E-mail: [email protected]
(Submitted: December 1, 2009 ; Revised: June 1, 2010 ; Accepted: July 14, 2010)
Abstract - This work investigates a procedure to design an Industrial Ecosystem for sequestrating CO2 and
consuming glycerol in a Chemical Complex with 15 integrated processes. The Complex is responsible for the production of methanol, ethylene oxide, ammonia, urea, dimethyl carbonate, ethylene glycol, glycerol carbonate, β-carotene, 1,2-propanediol and olefins, and is simulated using UNISIM Design (Honeywell). The process environmental impact (EI) is calculated using the Waste Reduction Algorithm, while Profit (P) is estimated using classic cost correlations. MATLAB (The Mathworks Inc) is connected to UNISIM to enable optimization. The objective is granting maximum process sustainability, which involves finding a compromise between high profitability and low environmental impact. Sustainability maximization is therefore understood as a multi-criteria optimization problem, addressed by means of the Pareto optimization methodology for trading off P vs. EI.
Keywords: Pareto optimization; Sustainability; CO2 sequestration; Process design; Glycerol chemistry.
INTRODUCTION
Global climate change, caused mainly by the increase of CO2 concentration in the atmosphere, is a major concern of the Chemical Industry. Additionally, if biodiesel is to substitute petroleum diesel, glycerol might become a management/environmental problem, since it is generated as a by-product in a 10% (w/w) ratio. The Chemical Industry is currently focusing on the environmental performance of processes and products, seeking to fit its operation to pollution prevention, using management tools such as Life Cycle Analysis and applying Sustainability Metrics.
This work approaches the conceptual design of an Industrial Ecosystem for mitigating the environmental issues associated with chemical and biochemical sequestration of CO2 and consuming glycerol to produce methanol, ethylene oxide (EO), ammonia, urea, dimethyl carbonate (DMC), ethylene glycol (EG), glycerol carbonate (GC), beta-carotene, 1,2-propanediol (1,2-PD), ethylene carbonate (EC) and olefins. Furthermore, a preliminary screening of optimal performance in the operating window is presented.
The evaluation of economic and environmental performances of the Chemical Complex is approached by means of the identification of an optimal Pareto set of solutions, dependent on the operating scenario.
CHEMICAL COMPLEX DESIGN AND OPTIMIZATION
Chemical Complex Conceptual Design
Process Selection
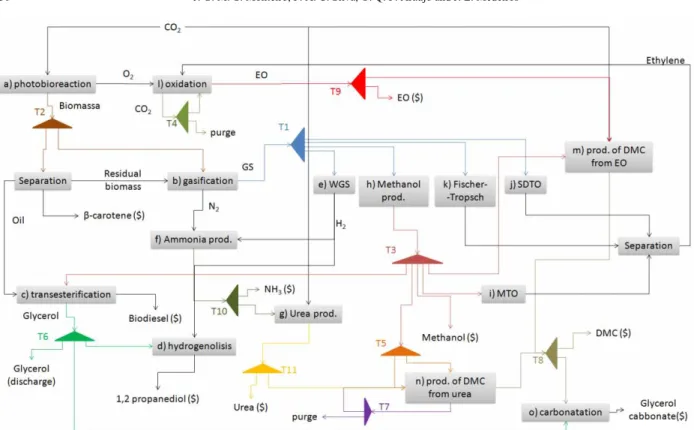
Brazilian Journal of Chemical Engineering Figure 1: Chemical Complex structure
Structure
The Chemical Complex proposed in this work is composed of 15 integrated processes, as illustrated in Figure 1. The objective of this complex is to optimize CO2 chemical and biochemical reuse, by obtaining the most sustainable CO2 allocation within the system. Additionally, routes for glycerol reuse are evaluated.
The processes considered are described as follows:
(a) microalgae biomass and β-carotene production: CO2 is biofixed by microalgae Dunaliella salina cultivation in a photobioreactor. Biomass is then harvested and β-carotene is separated. Producing 100t of algal biomass fixes roughly 183t of carbon dioxide. Photosynthetic growth requires light, carbon dioxide, water, nutrients and inorganic salts. Temperature must remain generally within 20 to 30°C. Maintaining these conditions, microalgae biomass commonly doubles within 24h and has an oil content as high as 80% of its dry weight.
Available data: data from Chisti (2007) and Araújo et al. (2008);
(b) biomass gasification: biomass is oxidized by O2 and H2O at atmospheric pressure in a gasifier at 1000°C to generate syngas with a CO:H2 ratio = 1:2. In order to achieve this composition specification (to
improve the yield of upstream processes), the mass feed ratio of H2O (steam) to biomass was optimized and adopted as 50%. Since the reactor is adiabatic, temperature is controlled by adjusting O2 flow rate (and therefore the heat rate of the involved reactions).
There are many possible gasifier configurations, showing different results concerning yields and selectivity. In this study, an ideal gasifier was simulated with the “Gibbs reactor” model, available in the UNISIM model library. In this way, the extent of each reaction is calculated by minimizing the Gibbs free energy (thermodynamic equilibrium).
Available data: thermodynamic equilibrium calculated with UNISIM; response validation by comparison with data from Olofsson et al., 2005;
(c) biodiesel production: lipids (palmitic, stearic, oleic and linoleic triesters) extracted from biomass react with methanol, with sodium hydroxide, to produce biodiesel – a blend of fatty acid methyl esters, and glycerol is generated as a by-product. Biodiesel yield reaches 96% in the presence of MgAl hydrotalcite as catalyst at 240°C and atmospheric pressure.
Available data: data presented by Georgogianni et al. (2009);
results in 1,2-PD formation. In a first step, glycerol is dehydrated to acetol; then acetol is hydrogenated to 1,2-PD in a CSTR; resulting in a global yield of 87% under mild conditions (240°C, 185°C and 1 bar, 14 bar).
Available data: data presented by Dasaria et al. (2006);
(e) hydrogen production: steam reacts with syngas (water-gas shift reaction), generating H2 and CO2, a classical industrial process with equilibrium data available in the UNISIM Design reaction library;
Available data: thermodynamic equilibrium calculated with UNISIM Design;
(f) ammonia production: N2 (from biomass gasification) reacts with H2, generating ammonia, another classical industrial process with equilibrium data available in the UNISIM Design reaction library;
Available data: thermodynamic equilibrium calculated with UNISIM Design;
(g) urea production: ammonia reacts with CO2 to produce urea, achieving 78% conversion of CO2 to urea at 250°C and 400 bar.
Available data: data presented by Baal and Lemmen (2003);
(h) methanol production: CO and H2 react under high pressure (75 bar) and temperature between 210°C and 290°C (reactor inlet/outlet) to form methanol. CO2 conversion per pass in the range of 90 to 97% is obtained, depending on make-up gas quality and recycle rate.
Available data: data presented by Nouri and Tillman (2005);
(i) methanol-to-olefins (MTO): 95% conversion of methanol into light olefins is achieved using H-SAPO-34 as catalyst at 352°C and atmospheric pressure, under continuous-flow conditions. The obtained yields of ethylene and propylene are, respectively, 30% and 50%.
Available data: data presented by Wei Wang et al. (2005);
(j) syngas-to-DME-to-olefins (SDTO): this route is a modification of the MTO process, proposed by Cai et al. (1995). First, syngas is converted into dimethyl-ether (DME) with 90.35% conversion rate, in a fixed-bed PFR reactor (catalysts: Cu-Zn-A1 + H-MHd) at 265°C and 40 bar. Then, DME is totally converted to hydrocarbons in another fixed-bed PFR reactor (catalyst: modified SAPO-34) at 450°C and normal pressure. The advantage of the SDTO route over the MTO route is a superior conversion of syngas.
Available data: technical data presented by Cai et al. (1995);
(k) Fisher-Tropsch (FT) synthesis: the FT reaction is modeled according to the Anderson-Schultz-Florey (ASF) model. Synthesis gas with a H2:CO ratio of 2 is fed to a PFR reactor operating at 20 bar and 220°C. The chain growth probability was optimized in order to maximize FT selectivity to light olefins.
Available data: reaction modeling presented by Trepanier et al. (2009);
(l) EO production: ethylene and oxygen are fed in an equimolar ratio to a PFR reactor at 132°C to produce EO, using Shell Westhollow Silver catalyst. Methane is fed to the reactor in order to prevent explosive mixtures of hydrocarbons and oxygen. The reactor outlet temperature is 490°C and ethylene conversion achieves 80.9%, with CO2 and water as by-products. Inlet pressure was set as 17 bar, and pressure drop through the reactor was 3 bar.
Available data: kinetic data presented by Coombs et al. (1997);
(m) DMC production from EO: EO reacts with CO2 to yield EC instantly at 180°C and 60 bar in a PFR. Methanol and ethylene carbonate are obtained and fed to a dimethyl carbonate (DMC) production unit, a reactive distillation unit, where conversion is limited to the range of 50 to 80% by the reaction equilibrium at 180°C and 50 bar. DMC and ethylene glycol (EG) are formed.
Available data: kinetic data presented by Cui et al (2004); sizing and optimization data presented by Monteiro et al. (2009b);
(n) DMC production from urea: methanol and urea react forming methyl carbamate, which reacts with methanol to generate DMC and NH3 at 180°C with a yield of 45%.
Available data: kinetic data presented by Wang et al. (2007); sizing and optimization data presented by Monteiro et al. (2009b);
(o) GC production: DMC reacts with glycerol to form GC. Glycerol, at ambient conditions, and DMC are fed to a Glycerol Carbonate (GC) reactor at a molar ratio of 1:1, resulting in a conversion of 98%. Then, GC is rectified to a purity of 99.8%.
Available data: data presented by Rokicki et al. (2005).
Process Modeling
Brazilian Journal of Chemical Engineering design facilities that conserve material use”.
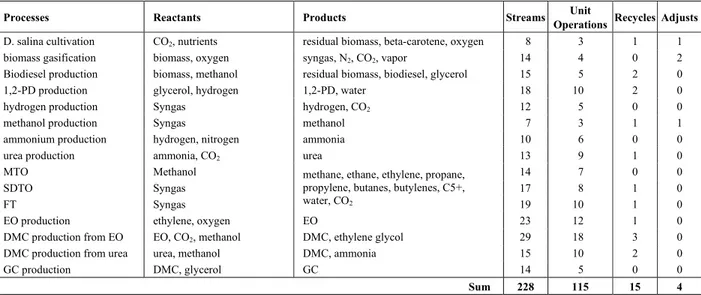
However, rigorous simulation of a Chemical Complex demands a high computational effort for convergence of the recycle streams involved – both intra- and inter-processes. In the addressed problem, the simulated flowsheet has 228 streams and 115 unit operations. The optimization of the entire complex demands that the flowsheet simulation be solved several times, increasing the computational effort beyond practical boundaries.
To address this issue, in the adopted procedure, the processes are first isolatedly simulated separately using UNISIM Design. In this step, technologies with available kinetic data were modeled more rigorously and ideal reactors (PFRs and CSTRs) were properly sized. In cases of technologies with conversion/yield or equilibrium data as the only available information, simple reactor models were employed. Two approaches were adopted: "conversion reactors" and "Gibbs reactors". The first case, although thermodynamically rigorous, does not allow the evaluation of pressure and temperature effects on the reactor. In the second case, equilibrium is calculated by UNISIM Design, which allows the evaluation of pressure and temperature effects on the reaction, but ignores issues such as residence time limitation.
Reaction products and unreacted raw materials are separated in downstream units, normally composed of arrangements of distillation columns. The separation operations are rigorously simulated and are sized to comply with the purity specification, normally set above 99%.
The utilities demands are calculated for each process of the Chemical Complex. Operational and
design variables (e.g., pressure, temperature and equipment volume) are set for optimal yields of the main products.
These preliminary rigorous simulations allow the calculation of technical indexes such as the conversion of a reactant in a given condition, or the recovery of a product in a distillation column. The Chemical Complex is then simulated by using simple unit operation models, employing the technical indexes calculated in the prior rigorous simulation phase. For instance, PFR reactors are replaced by "conversion reactors", and columns are replaced by a UNISIM Design unit operation block named “component splitter”. The "component splitter" is a black-box separator model where the recovery of each component is informed for each product stream. The temperatures and pressures can be set by the user. Mass and energy balances are performed and thermodynamic functions are rigorously executed.
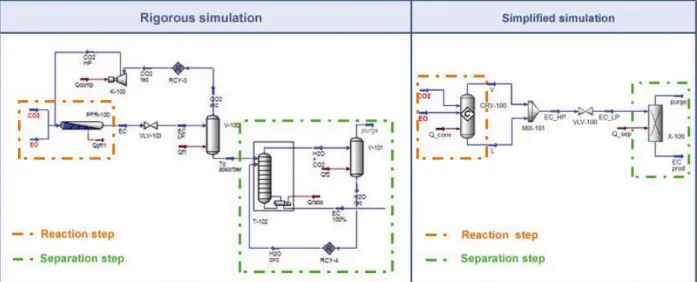
The decision of using simple models accelerates the flowsheet convergence, significantly reducing CPU time, allowing the simulation of the industrial complex. An example of process simulation simplification is shown in Figure 2. On the left, a PFR reactor is used to model EC production. CO2, fed in excess to the reactor, is recovered in a flash vessel and recycled to the reaction media. An absorber and a flash vessel are used for product purification. A conversion reactor is employed and a component splitter substitutes the separation operations. Both recycles (CO2 recycle and water reflux to absorber) were removed from the system. Actually, water is not included in the simplified model, since it is used as a solvent in a closed cycle.
Figure 3 shows the relative behavior of rigorous and simplified simulation. Each model is simulated 50 times, varying the feed flow in the interval [0.7F0, 1.3F0], where F0 is the original feed flow rate the reaction system. The range of ±30% on F0 was restricted to avoid convergence problems of the recycle loops in the rigorous model simulation. The green line shows the ratio of execution time for simplified simulation (TS) to execution time for rigorous simulation (TR). Within the search interval, the simplified simulation is about 5 times faster than the rigorous one. When the interval limits are approached, the TS to TR ratio rises to about 11 as the number of iterations for solving the rigorous model rises significantly. The blue and red lines represent the errors when comparing the calculated product flow rate obtained from the 2 models. EC flow rate is virtually the same, as the rigorous model operations are dimensioned to reach 100% OE conversion and 98% EC recovery, and the same values are specified in the simplified operations. For the purge flow rate, the simplified model yields are 3% lower than for the rigorous one and the difference corresponds to the water content in the purge flow.
In conclusion, the simplified model can be used to mimic the behavior of the rigorous one, at least for mass balance calculations. The energy requirement of each process is calculated using technical indexes obtained from the rigorous simulations (because pressure, temperature and composition are constant, heat flow is actually proportional to mass flow).
Figure 3: Number of iterations for each simulation option
The designed system presents several material and energy integrations, because a product or residue of a process can be an input to another: mixers and tees dictate the extent of material integration between processes. Each process is understood as a module of the complex. Dedicated heat exchangers are installed within the modules whenever intra-process energy integration (involving internal process flows) is possible. Additionally, as proposed by Bulasara et al. (2008), inter-processes energy integration (between flows from different modules) is calculated considering that utilities flows are linked into heat exchanger networks, maximizing energy integration efficiency. The integration between modules can be observed in Figure 1. Table 1 shows a summary of the Chemical Complex structure.
Table 1: Complex Summary
Processes Reactants Products Streams Unit
Operations Recycles Adjusts
D. salina cultivation CO2, nutrients residual biomass, beta-carotene, oxygen 8 3 1 1
biomass gasification biomass, oxygen syngas, N2, CO2, vapor 14 4 0 2
Biodiesel production biomass, methanol residual biomass, biodiesel, glycerol 15 5 2 0
1,2-PD production glycerol, hydrogen 1,2-PD, water 18 10 2 0
hydrogen production Syngas hydrogen, CO2 12 5 0 0
methanol production Syngas methanol 7 3 1 1
ammonium production hydrogen, nitrogen ammonia 10 6 0 0
urea production ammonia, CO2 urea 13 9 1 0
MTO Methanol 14 7 0 0
SDTO Syngas 17 8 1 0
FT Syngas
methane, ethane, ethylene, propane, propylene, butanes, butylenes, C5+,
water, CO2 19 10 1 0
EO production ethylene, oxygen EO 23 12 1 0
DMC production from EO EO, CO2, methanol DMC, ethylene glycol 29 18 3 0
DMC production from urea urea, methanol DMC, ammonia 15 10 2 0
GC production DMC, glycerol GC 14 5 0 0
Brazilian Journal of Chemical Engineering Procedure for Chemical Complex Performance
Analysis
The performance of the Complex is analyzed by investigating its Sustainability, herein understood as a twofold indicator, considering both economic and environmental aspects. The analysis requires that Profit (P) and Environmental Impact (EI) of the Chemical Complex be calculated for the evaluated cases.
The Environmental Impact (EI) is calculated using the Waste Reduction Algorithm (WAR) (Young et al., 2000), which proposes an index for Potential Environmental Impacts (PEI) associated with process emissions. Technical emission factors are obtained from the literature or estimated using UNISIM Design, in terms of quantity of pollutant released per quantity of product obtained. The greenhouse gas emissions due to utilities demands are calculated as a function of the energy inputs/outputs of the equipment used in each plant. The facilities are considered to employ natural gas as fuel.
Estimation of Annualized Profit
The economic performance of each process in the Complex is estimated based on annual Profit (P), calculated as shown in Equation (1), where TAC stands for Total Annualized Cost (in US$/y).
P= −R TAC OPEX− (1)
AACE Recommended Practice No 17R-97 (Cost Estimate Classification System, 1997) classifies feasibility estimate studies with an expected accuracy range from 4 to 20%. With the purpose of generating a crude estimate of Total Annualized Cost (TAC) of a process, Knapp and Doherty (1990) show that, for a new already-built plant, with expected life of 10 years, 10 annual amortization installments and a yearly attractiveness rate of 12%, ISBL represents approximately 1/3 of the total investment. Consequently, TAC can be written in terms of ISBL according to Equation (2), where OPEX and TAC are expressed in US$/y.
TAC ISBL OPEX= + (2)
Consequently, neglecting labor costs, the annual Profit (P) can be estimated as:
P= −R ISBL OPEX− (3)
with R standing for the plant yearly revenue (US$/y). Therefore, for a feasibility estimate study, the annual
Profit (P) of a process can be estimated according to Equation (4) (Knapp and Doherty, 1990).
P= −R ISBL (RMC− +UC) (4)
where P is the annual profit (US$/y), R is the revenue (US$/y), RMC is the raw materials cost (US$/y) and UC is the utilities cost (US$/y). It is worth noting that the calculation, although a rough estimate of P, is appropriate for a preliminary estimation of annualized profit, necessary for screening between process alternatives.
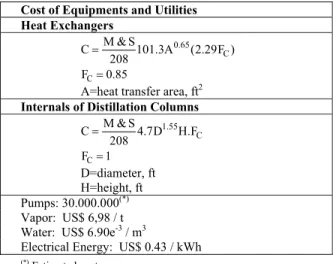
In this work, the ISBL is calculated using Douglas’ (1988) correlations for installed equipment cost (based upon US costs), except for the ISBL of the urea production plant, estimated from the values reported by van Baal and Lemmen (2003). Equipment cost correlations and utilities costs are summarized in Table 2. The calculations consider that the Complex operates for 7200h/y; the Marshall and Swift index (M&S) used is 1399, referring to the year 2007.
Table 2: Cost of Equipment (Douglas, 1988) and Utilities
Cost of Equipments and Utilities Heat Exchangers
0.65 C
M & S
C 101.3A (2.29F )
208 =
C
F =0.85
A=heat transfer area, ft2 Internals of Distillation Columns
1.55 C
M & S
C 4.7D H.F
208 =
C
F =1 D=diameter, ft H=height, ft Pumps: 30.000.000(*) Vapor: US$ 6,98 / t Water: US$ 6.90e-3 / m3
Electrical Energy: US$ 0.43 / kWh
(*) Estimated cost
The reference used for estimating the cost of equipments is Douglas (1988), which applies Guthrie's cost correlations. Although 22 years old, the use of the classical Guthrie's correlation persists in feasibility studies. Turton et al. in 2009 presented Guthrie's field installation factors and R-books software (marketed by Richardson Engineering Services, Inc., January 2001) fitted to Equation (5)
( )
( )
( )
310 1 2 10 3 10
log C =K +K log A +K ⎡⎣log A ⎤⎦ (5)
Turton et al. (2009) correlations for a heat exchanger is reported in Table 3.
Table 3: Comparison of Cost Estimates
Equipment: Heat Exchanger Type: Fixed TS
Area (m2) = 577 Shell side:
Max Temperature = 35oC Pressure = 1.5 barg MOC = Carbon Steel Shell side:
Max Temperature = 72oC Pressure = 78.5 barg MOC = Carbon Steel Installed Cost (US$)
Turton et al. (2009): US$ 414720 Douglas (1988): US$ 456849
According to Table 3, despite 22 years of difference in the references (Douglas and Turton et al.) the procedures agree within 10%. The comparison was extended to other equipment, although not reported in the present work, and supported the appropriateness of to employ Douglas' correlations for preliminary capital cost estimations in the feasibility studies necessary for selecting the best process alternatives among a set of process candidates.
Process Integration in the Chemical Complex
P and EI are affected by material integration decisions: a more profitable process may have more EI and/or be more energy intensive than a less profitable one. Mixers and tees are responsible for process integration and are the keys to investigating various situations, allowing decisions as to whether raw materials for a given process are to be obtained within the system (from another process), from outside the system’s boundaries, or by a combined internal and external solution. The same applies to process products: is it better to sell a product (send it outside the system's boundaries) or to use it as reactant within the system?
Normally, as pointed out by Gibbs and Deutz (2007), cycling of materials and energy is understood to be a problem of multi-objective minimization of waste production, energy consumption and raw material consumption. Herein, the performance analysis is centered on P and EI. Such an approach presents a conflict between P and EI since, for instance, an increase in energy consumption due to higher flow rates to a given process leads to a simultaneous P rise and EI decrease.
Pareto-Optimal Set of the Chemical Complex
Trading off P and EI requires optimization of process Sustainability. One approach is to reduce the original problem to a mono-objective problem, where P is maximized subject to environmental constraints. An alternative and more adequate approach is to employ a vector of objectives, F(x), in which each position represents a function to be minimized (Equation (6)). In the investigated problem, these functions are the negative of profit, -P(x), and the environmental impact, EI(x), to be minimized by the decision vector x, which contains the operational and design variables of the Complex. The problem can be subjected to equality and inequality constraints (Equations (7) and (8)).
x n
min ∈ℜ F(x) (6)
i
G (x) 0, i= =1,..., m∈ (7)
i
G (x)≤0, i=m∈+1,..., m (8)
Since F(x) is a vector of objectives, if a conflict between its components exists, the problem will present several solutions. In such cases, the non-inferiority concept is employed to identify a set of optimal solutions (Pareto-optimal set). A non-inferior solution is reached whenever an improvement in one objective imposes a decline in another (Luyben, 1993). This means that x* is a non-inferior solution if, in its neighborhood, there is no Δx that satisfies Equation (9).
i i
F (x∗+ Δ ≤x) F (x ), i∗ =1,..., m (9)
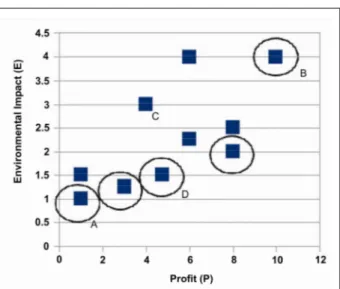
Brazilian Journal of Chemical Engineering Figure 4: Pareto optimal solutions
In decision theory, there are two primary steps: generate the option space and select the best option (Hazelrigg, 1996). Choosing from among this space is certainly not trivial, but rather a function of tradeoffs and compromises (Kasprzak and Lewis, 2001). In this work, the method selected for deciding among Pareto set solutions is the weighted sum method. It is a classical and simple procedure that, according to Verigidis et al. (2008), scalarizes a set of objectives into a single objective by pre-multiplying the objective functions by user-supplied weights. It is worth noting that the combination of economic and environmental functions into a sustainability function by the weighted sum method has been used by Monteiro et al. (2009).
In this direction, the sustainability function of each module, Si(x), can be defined as the weighted difference between modules P and EI (Equation (7), Monteiro et al., 2009).
i p i EI m,i
S (x)=ω P (x) −ω E I (x) (10)
CO2 m
product
M E I E I
M
= (11)
where Si is the sustainability function for module i; Pi is the profit of module i; EIm,i is the modified environmental impact of module i; ωk is weighting factor associated with function k; EI is the environmental impact; MCO2 is the mass of CO2 -equivalent emitted; and Mproduct is the mass of product obtained.
The new problem, formulated in Equation (12),
consists of maximizing the Chemical Complex sustainability, S(x), subject to equality and inequality constraints (Equations (13) and (14)).
x
m
n ì 1 i
max ∈ℜ S(x)=∑= S (x) (12)
i
G (x)=0, i=1,..., m∈ (13)
i
G (x)≤0, i=m∈+1,..., m (14)
This strategy converts the multi-objective problem into a mono-objective one. In the context of process optimization within UNISIM Design, this modification is crucial because only mono-objective optimization methods are available therein.
Furthermore, because Si(x) is the weighted sum of two functions, the weighting factors associated with each function must be set to compensate eventual order of magnitude discrepancies, avoiding dominance of one function over the other. Also, if a compromise between P and EI exists, the ratio ωP/ωEI is a relevant parameter for the optimization: each ratio is a scenario of relative dominance between P and EI and the solution will point to the optimal design of the Complex under each scenario. In this way, if ωP/ωEI tends to zero, the scenario considerers exclusively the EI aspect – the optimal solution will be the minimization of EI. Similarly, if ωP/ωEI tends to infinity, the scenario only accounts for the P aspect – the optimal solution will be the maximization of P. Therefore, tuning the ωP/ωEI ratio allows for deciding on the relative importance given to each function (P and EP). By varying the ωP/ωEI ratio, the states that belong to the Pareto Frontier can be found.
PARETO SET RESULTS AND SENSITIVITY ANALYSIS
Problem Solving Methodology
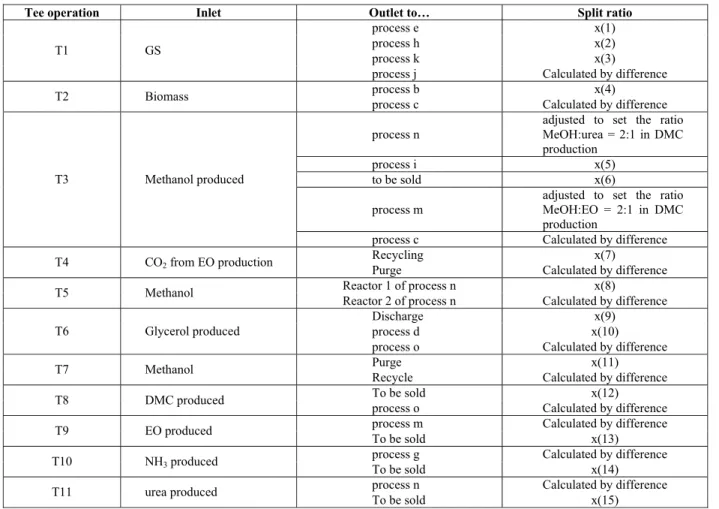
Table 4: Chemical Complex degrees of freedom
Tee operation Inlet Outlet to… Split ratio
process e x(1)
process h x(2)
process k x(3)
T1 GS
process j Calculated by difference
process b x(4)
T2 Biomass
process c Calculated by difference
process n
adjusted to set the ratio MeOH:urea = 2:1 in DMC production
process i x(5)
to be sold x(6)
process m
adjusted to set the ratio MeOH:EO = 2:1 in DMC production
T3 Methanol produced
process c Calculated by difference
Recycling x(7) T4 CO2 from EO production
Purge Calculated by difference
Reactor 1 of process n x(8)
T5 Methanol
Reactor 2 of process n Calculated by difference
Discharge x(9)
process d x(10)
T6 Glycerol produced
process o Calculated by difference
Purge x(11) T7 Methanol
Recycle Calculated by difference
To be sold x(12)
T8 DMC produced
process o Calculated by difference process m Calculated by difference
T9 EO produced
To be sold x(13)
process g Calculated by difference
T10 NH3 produced
To be sold x(14)
process n Calculated by difference
T11 urea produced
To be sold x(15)
Split ratios must respect the following constraints: each value must lie in the [0, 1] interval and the sum of flow ratios in a tee must equal 1. The number of combinations of flow ratio sets is explosive. The problem is addressed by using the multi-objective strategy:
1. A MATLAB procedure automatically
generates random values for each decision variable, observing the given constraints;
2. In sequence, the MATLAB procedures send the decision variables vector to UNISIM Design, by ActiveX communication;
3. The Chemical Complex is simulated for the given values within UNISIM Design;
4. Convergence of the UNISIM Design
simulation is tested. If convergence is reached, the state (decision values generated in step 1) is considered to be feasible and MATLAB receives the objective function vector;
5. The decision variable and the objective vectors are saved and steps 1 through 5 are repeated until a limit in the number of simulations is reached;
6. Chemical Complex Sustainability performance is mapped in a P vs EI plot.
The feasibility of each case depends on the ability of UNISIM Design to solve the flowsheet with the proposed decision variable values. In each simulation, a high computational effort is required for the convergence of every UNISIM Design “adjust” and “recycle” logical tool, necessary for complying with process constraints.
Pareto Set Results
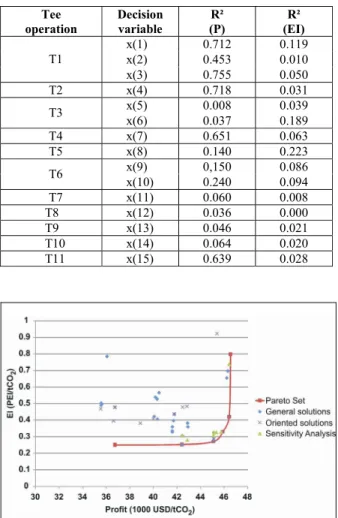
Brazilian Journal of Chemical Engineering Figure 5 shows the map of solutions for the
Chemical Complex. Both P and EI are reported in relative terms, divided by the quantity of CO2 sequestrated in each case. The Pareto solutions are linked by a solid line; minimum EI and maximum P solutions are pointed out. Every point above the Pareto frontier is dominated by a point of the frontier, while the region below the frontier is unfeasible.
Table 5: Decision variable correlations with objective functions
Tee operation
Decision variable
R² (P)
R² (EI)
x(1) 0.712 0.119
x(2) 0.453 0.010
T1
x(3) 0.755 0.050
T2 x(4) 0.718 0.031
x(5) 0.008 0.039
T3
x(6) 0.037 0.189
T4 x(7) 0.651 0.063
T5 x(8) 0.140 0.223
x(9) 0,150 0.086
T6
x(10) 0.240 0.094
T7 x(11) 0.060 0.008
T8 x(12) 0.036 0.000
T9 x(13) 0.046 0.021
T10 x(14) 0.064 0.020
T11 x(15) 0.639 0.028
Figure 5: Pareto set (SF maximization solutions)
Sensitivity Analysis
A sensitivity analysis was carried out in order to verify whether any solution existed below the proposed Pareto frontier. The decision variables that generated the six frontier solutions were disturbed within the range of ±5%. If the frontier proposed is the actual Pareto frontier, the perturbed states should generate solutions above it. Due to
convergence problems, only 8 solutions were possible. All the converged solutions, shown in Figure 5, are dominated, i.e., lie above the propose Pareto frontier.
CONCLUSIONS
This work presents a procedure to design a Chemical Complex with 15 integrated processes, including biodiesel production, for CO2 sequestration and biodiesel-derived glycerol reuse. The Complex is responsible for the production of 9 products besides light olefins, and is simulated using UNISIM Design, coordinated by calls from MATLAB. The CCSS is set by tees and mixers defining process integration and creating a super-structure whose performance at different configurations is evaluated according to environmental impact (EI) (calculated using the Waste Reduction Algorithm) and Profit (P) (estimated using classic Guthrie correlations). The objective is maximum process sustainability, which involves trading off profitability and low environmental impact. Sustainability maximization is therefore understood as a multi-criteria optimization problem, herein addressed by means of the Pareto optimization methodology.
Finding the Pareto frontier was addressed using Monte Carlo strategy, and is equivalent to solving the Sustainability maximization problem. However, from a numerical point of view, the strategies differ. In the first case, a high number of states (solutions for various vectors of decision variables) are to be simulated to generate the correct Pareto frontier. Because the values for the deviation variables are generated randomly, one state may differ substantially from the previous, which decreases the chance of convergence of the flowsheet in UNISIM Design simulation.
The results suggest that the optimization of the sustainability of Chemical Complexes can be carried out by the following steps:
1) Screening of technologies to be adopted as process modules of the complex;
2) Rigorous simulation and optimization of each module, to generate technical indexes;
3) Simplification of models using the obtained technical indexes to reduce computational effort and enable the simulation of the entire Chemical Complex Structure;
4) Optimization of the Chemical Complex, using Pareto analysis to search for optimal solutions.
5) Definition of the economic and environmental scenario to which the Complex will be submitted, resulting in a ωP/ωEI ratio applicable to the complex.
6) Select the best solution among the Pareto Frontiers that complies with the economic and environmental scenario.
ACKNOWLEDGEMENT
The authors kindly acknowledge FAPERJ and CNPq for financial support.
NOMENCLATURE
1,2-PD 1,2-propanediol CST continuous stirred tank DMC dimethyl carbonate DME dimethyl ether
dv decision vector
EC ethylene carbonate
EG ethylene glycol
EI environmental impact EO ethylene oxide
F objective funcion
FT Fischer–Tropsch
GC glycerol carbonate
i process index
ISBL installed cost of equipments inside battery limits
US$
OPEX operational expenditure P profit
PFR plug-flow reactor
Qi duty of energy stream i kW
R revenue US$/y
Si(x) sustainability function of a module
TAC total annualized cost US$/y
TR the time required in the rigorous simulation
TS time required in the simplified simulation
UC utilities costs US$/y
WGS water gas shift reaction
REFERENCES
Araújo, O. Q. F., Gobbi, C. N., Chaloub, R. M. and Coelho, M. A. Z., Assessment of the impact of salinity and irradiance on the combined carbon dioxide sequestration and carotenoids production by Dunaliella salina: a mathematical model. Biotechnology and Bioengineering, 102, (2), p. 425-35 (2008).
Bulasara, V. K., Uppaluri, R. and Ghoshal, A. K., Revamp study of crude distillation unit heat exchanger network: Energy integration potential of delayed coking unit free hot streams. Applied Thermal Engineering, article in press (2008). Cai, G., Liu, Z., Shi, R., He, C., Yang, C., Sun, C.
and Chang, Y., Light alkenes from syngas via dimethyl ether. Applied Catalysis, 125, p. 29-38 (1995).
Casavant, T. E. and Côté, R. P., Using chemical process simulation to design industrial ecosystems. Journal of Cleaner Production, 12, p. 901-908 (2004).
Chisti, Y., Biodiesel from microalgae, Biotechnology Advances, 25, p. 294-306 (2007).
Coombs, J., Daniel, K. and Palombo, L., Celanese Clearlake Ethylene Oxide Reactor Revamp, J. Chem. Inc, Available at http://www.owlnet.rice.edu/~ceng 403/ethox97.html (1997). (Accessed in 23/02/2009). Cui, H., Wang, T., Wang, F., Gu, C., Wang, P. and
Dai, Y., Kinetic Study on the One-Pot Synthesis of Dimethyl Carbonate in Supercritical CO2 Conditions. Ind. Eng. Chem. Res., v. 43, p. 7732-7739 (2004).
Dasari, M. A., Catalytic conversion of glycerol and sugar alcohols to value-added products. Faculty of the Graduate School University of Missouri-Columbia (2006).
Douglas, J. M., Conceptual Design of Chemical Processes, McGraw-Hill (1998).
Georgogianni, K. G., Katsoulidis, A. K., Pomonis, P. J., Manos, G. and Kontominas, M. G., Transesterification of rapeseed oil for the production of biodiesel using homogeneous and heterogeneous catalysis. Fuel Processing Technology, Volume 90, Issues 7-8, p. 1016-1022 (2009).
Brazilian Journal of Chemical Engineering development. Journal of Cleaner Production, 15,
p. 1683-1695 (2007).
Hazelrigg, G., Systems engineering: an approach to information-based design. Upper Saddle River, NJ, Prentice-Hall (1996).
Kasprzak, E. M. and Lewis, K. E.. Pareto analysis in multiobjective optimization using the collinearity theorem and scaling method. Struct Multidisc Optim 22, 208-218 (2001).
Knapp, J. P. and Doherty, M. F., Thermal Integration of Homogeneous Azeotropic Distillation Sequences. AIChE Journal, 36, No. 7, p. 969-984 (1990).
Monteiro, J. G. M-S., Araújo, O. Q. F. and Medeiros, J. L., Sustainability Metrics for Eco-Technologies Assessment, Part II: Life Cycle Analysis, Clean Technologies and Environmental Policy, article in press (2009).
Nouri, S. and Tillman, A.-M., Evaluating synthesis gas based biomass to plastics (BTP) technologies. Chalmers University of Technology, Göteborg (2005).
Olofsson, I., Nordin, A. and Söderlind, U., Initial review and evaluation of process technologies and systems suitable for cost-efficient medium-scale gasification for biomass to liquid fuels. ETPC Report, University Umea and Mid Swedish
University, Sweden (2005).
Rokicki, G., Rakoczy, P., Parzuchowski, P. and Sobiecki, M., Hyperbranched aliphatic polyethers obtained from environmentally benign monomer: glycerol carbonate. Green Chemistry, 7, p. 529-539 (2005).
Trepanier, M., Tavasoli, A., Dalai, A. K. and Abatzoglou, N., Co, Ru and K loadings effects on the activity and selectivity of carbon nanotubes supported cobalt catalyst in Fischer–Tropsch synthesis, Applied Catalysis, A, General, 353, p. 193-202 (2009).
van Baal, H. and Lemmen, W., The advantages of a large capacity single line urea plant. Stamicarbon bv Technical Report (2003).
Turton, R., Bailie, R. C., Whiting, W. B., Shaeiwitz, J. A., Analysis, Synthesis, and Design of Chemical Processes, New Jersey: Prentice Hall, PTR, 3rd ed. (2009).
Verigidis, T., Verigidis, K., Tiwari, A., The evaluation line: A posteriori preference articulation approach. IEEE Congress on Evolutionary Computation (2008).