DOI: http://dx.doi.org/10.1590/2446-4740.0752
*e-mail: [email protected]
Received: 10 April 2015 / Accepted: 25 September 2015
Statistical evaluation of a novel SSVEP-BCI stimulation setup based
on depth-of-ield
Anibal Cotrina*, Alessandro Botti Benevides, Javier Castillo-Garcia, Andre Ferreira, Teodiano Freire Bastos Filho
Abstract Introduction: The main drawback of a Brain-computer Interface based on Steady-State Visual Evoked Potential (SSVEP-BCI) that detects the emergence of visual evoked potentials (VEP) in reaction to lickering stimuli is its muscular dependence due to users must redirect their gaze to put the target stimulus in their ield of view. In this work, a novel setup is evaluated in which two stimuli are placed together in the center of users’ ield of view, but with dissimilar distances from them, so that the target selection is performed by focus shifting instead of head, neck and/or eyeball movements. Methods: A model of VEP generation for the novel setup was developed. The Spectral F-test based on Bartett periodogram was used to evaluate the null hypothesis of absence of effects of the non-focused stimulus (NFS) within the VEP elicited by the focused stimulus (FS). To reinforce that there is not statistical evidence to support the presence of NFS effects, the PSDA detection method was employed to ind the frequency of FS. Electroencephalographic signals of nine subjects were recorded. Results: Approximately in 80% of the tests, the null hypothesis with 5% level of signiicance was non-rejected at the fundamental frequency of NFS. The average of the accuracy rate attained with PSDA detection method was 79.4%. Conclusion: Results of this work become further evident to state that if the focused stimulus (FS) will be able to elicit distinguishable VEP pattern regardless the non-focused stimulus (NFS) is also present.
Keywords: Brain-computer interface, Steady-state visual evoked potential, Depth-of-ield, Objective response detection, Statistical F-test.
Introduction
Brain-Computer Interfaces (BCI) provide a direct connection between the user’s brain signals and a computer, generating an alternative channel of communication that does not involve the traditional way as muscles and nerves (Wolpaw et al., 2002). In BCI systems, particular features are extracted from recorded brain signals for the purpose of translating them into artiicial outputs. These outputs act coherently on the environment or the person’s body itself, helping to restore useful functions for people in which the central nervous system is severely disabled. Besides to restore a lost natural output, BCIs can replace, enhance or supplement it (He et al., 2013). Nowadays, the most common non-invasive method employed to record brain signals is the electroencephalography (EEG) by virtue of its high temporal resolution and the low expensiveness. A sensory evoked response used in BCI systems is the visual evoked potential (VEP), which arises as a reaction of a task-related external stimulus. Steady-state visual evoked potentials (SSVEP) are periodic signals present in the EEG produced by repetitive presentation of visual stimuli.
These potentials that can be measured over the occipital brain region have the same fundamental frequency of the stimulus (Middendorf et al., 2000; Muller et al., 2010; Sutter, 1992). BCI systems based on SSVEP (or SSVEP-BCI) are becoming robust systems because their response has high signal-noise rate (SNR) and are achieving high transfer rates (Allison et al., 2010; Guger et al., 2012). SSVEP-BCI systems are being employed in human-machine interaction for assistance to people with disabilities (Bastos et al., 2014; Muller et al., 2010), spellers (Yin et al., 2015) and games. However, this kind of BCI system is not suitable for patients who do not have control over their eye movements; such as patients in inal stage of Amyotrophic Lateral Sclerosis (ALS). Therefore, it becomes its main drawback because muscular activity is necessary to shift the user’s gaze to select a visual stimulus. To overcome this issue, SSVEP-BCIs based on selectively attention instead of muscular movements are being developed (Allison et al., 2008; Kelly et al., 2005; Lesenfants et al., 2014; Zhang et al., 2010).
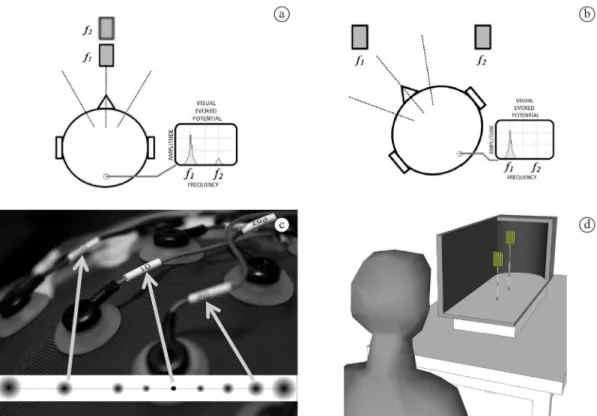
Usually, conventional SSVEP-BCIs stimulation setups place visual stimuli separated to each other in a plane parallel to the frontal plane, such as a computer screen, as shown in Figure 1a. Due to this separation users must redirect the gaze, by muscular movements of their head, neck and/or eyes, in order to attend the target stimulus. However, here we discuss a novel alternative setup, in which two SSVEP stimuli were placed at different depths from users and not in the same plane, as shown in Figure 1b (Cotrina et al., 2014). In this proposed setup, both stimuli are placed in the center of the user’s ield of view, so that muscular movements of head, neck and/or eyes are not required to attend one of them. Subjects can select any stimulus by just shifting the eye focus. Note that in Figure 1a, b the central dotted line illustrates the gaze direction. The lateral dotted lines represent the limits of users’ ield of view, and the gray rectangles represent the stimuli that are lickering at frequencies f1 and f2.
This novel setup explores the distances of stimuli from the BCI user. In general, the separation distance between two objects inluences its perception by the eyes. Figure 1c shows an augmented representation of the focusing effect of an optical system, like the human eye. When an object is being focused on by the eye, it can be seen that objects behind and in front of
the point of focus are projected blurred in the retinal image. The zone where objects are judged to be in focus is referred to as the Depth-of-Field (Howard, 2012; Wang and Ciuffreda, 2006) and its size depends on the distance between objects. Hence, provided that the stimuli are appropriately placed, the human eye has the ability to perceive the focused stimulus (FS) sharply and the non-focused stimulus (NFS) blurry at the same time.
It is known that an isolated focused stimulus present on the user’s ield of view, as shown in Figure 1a, elicits a VEP response with the same frequency of stimulation. However, ophthalmologic studies (Sokol and Moskowitz, 1981; Di Summa et al., 1999) reveal that VEP characteristics as amplitude or latency are affected by refractive errors caused, for example, by the stimulus defocusing. On the other hand, in the context of this novel setup that presents to the user two stimuli, it has not been found any study about the effects of placing a NFS on the user’s ield of view while he/she is gazing a FS. Figure 1d shows a tri-dimensional representation of this novel SSVEP-BCI setup. Nevertheless, based on the aforementioned ophthalmologic studies, it can be surmised that the NFS would not interfere or interfere minimally with VEP pattern elicited by the FS.
Therefore, in the present work the effects of NFS within the VEP elicited by FS of the novel SSVEP-BCI setup are inquired. Since two stimuli are presented together, or very close to each other, in the center of the ield of view (Figure 1d), the response of non-attended stimulus could be overlapped with the response of the attended stimulus. With the purpose of evaluating how the NFS affects the FS, statistical analysis was conducted by employing Objective Response Detection (ORD) techniques. These techniques are based on statistical tests that allow inferring about the presence of sensory response (Simpson et al., 2000). First, a model of VEP generation in the novel setup context is proposed, adopting the same approach of conventional model of evoked potential generation described by Melges et al. (2012). Next, a null hypothesis of absence of effects of NFS within VEP elicited by FS is evaluated, as reported by Infantosi et al. (2005). So, the Spectral F-test (SFT) based on the power spectral density (PSD) of the EEG signal is applied to test this null hypothesis. As a result, it was found that some frequency values in the PSD spectrum could reject it. However, in most of evaluated cases, the null hypothesis has been non-rejected at fundamental frequencies of FS and NFS. This fact, that does not disprove the null hypothesis, has motivated authors to apply a conventional SSVEP detection method named Power Spectral Density Analysis (PSDA) (Cheng et al., 2002) to recognize the frequency of the FS in the novel setup context. Therefore, PSDA was applied, reaching detection accuracy rates higher than 80% for ive (out of nine subjects involved in this study). Results of this work become further evident to state that: if two stimuli are presented together in the center of the ield of view of the BCI user, lickering at different frequencies and located at different distances from the user, then the focused stimulus will be able to elicit distinguishable SSVEP pattern regardless the non-focused stimulus is also present.
Methods
In this section, suitable notation for the visual stimuli of the novel setup is deined. Then, the standard model is described, as well as the proposed model
for VEP generation using the novel setup. Later, the spectral analysis and SFT is detailed and PSDA detection method is described.
Visual stimulus
Figure 1a illustrates the conventional SSVEP-BCI setup in which two stimuli are placed separated to each other in a plane parallel to the frontal plane, such as a computer screen. This setup requires movements of head, neck and/or eyes before making the selection. After users realize eye movements to attend the target stimulus, only one stimulus is present to their ield of view. This stimulus can be represented as u n
[ ]
=uf1when the attended stimulus is lickering at f1 Hz; and
[ ]
f2u n =u when the other stimulus that is lickering at
2
f Hz is attended. On the contrary, Figure 1b illustrates the novel SSVEP-BCI setup, in which two SSVEP stimuli were placed at different depths from users and not in the same plane. This setup presents two stimuli, with dissimilar distances, in the user’s ield of view, which are selected by means of focus shifting. Considering that both stimuli are presented together in the central of the ield of view, the stimulation may be represented as
[ ]
(
)
1, 2 f f
u n = u u , in which
1 f
u
is the nearest stimulus that is located at 28 cm from the user and is lickering at f1=5.6 Hz. The farthest stimulus,
2 f
u , is located at 47 cm and is lickering at
2 6.4
f = Hz. Thus, the stimulation presented to the subject can be deined as:
[ ]
( 5.6, 6.4)u n = u u (1)
and
[ ]
( 5.6, 6.4)u n = u u (2)
where u indicates which stimulus the user is focusing on. The frequencies were suggested by previous works developed at the author’s lab (Bastos et al., 2014; Ferreira et al., 2014; Muller et al., 2010).
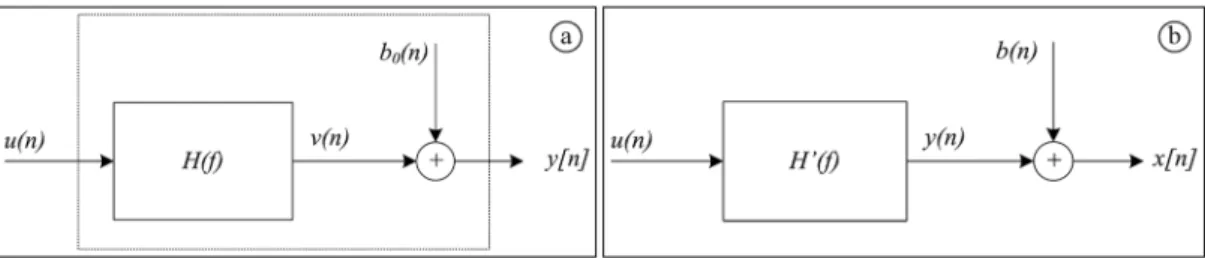
The conventional model of VEP generation
Figure 2a shows the conventional model of VEP generation, in which the input is given by u n
[ ]
=ufi(where i indicates the target stimulus), v n
[ ]
denotes the evoked potential that arises in response to the targetstimulus, b n0
[ ]
designates the background spontaneous EEG signal that can be assumed to be a zero-mean Gaussian noise, and H f( ) represents the transfer function of the visual pathway (Melges et al., 2012).The output signal y n[ ] that represents the EEG
signal recorded in the scalp is given by:
[ ] [ ]
0[ ]
y n =v n +b n (3)
Note that, in absence of the visual stimulus (v n
[ ]
=0) the output signal is equal to the spontaneous EEG signal. Therefore, to identify responses of visual stimulation, a null hypothesis (H0) of absence of evoked potential during the stimulation (y n[ ]
=b n0[ ]
) has been proposed. The ORD technique based on SFT was used to test the null hypothesis by comparing it with a critical value. Hence, if H0 is higher than a critical value, it is rejected; otherwise, it is non-rejected.Model of VEP generation for the novel setup
Figure 2b shows the VEP generation model of the novel stimulation setup, in which the input is given by u n
[ ]
that represents u=(u5.6,u6.4) or u=(u5.6,u6.4,);[ ]
y n is the VEP generated conventionally by FS in isolation; b n
[ ]
represents the possible effects caused by the NFS; and H′( )f is the transfer function for VEP generation, which is represented within the rectangle dotted in Figure 2a. The output x n[ ] that represents the EEG signal recorded in the scalp is given by:[ ] [ ] [ ]
y n =v n +b n (4)
Note that, in the absence of effects caused by the NFS (b n
[ ]
=0), the output signal is equal to VEPgenerated by FS in isolation. Therefore, as suggested in the conventional model, a null hypothesis H0 of absence of effects of NFS during the stimulation (x n
[ ] [ ]
=y n) can be proposed in the framework of ORD techniques. Thus, a value of H0 higher than a critical value implies its rejection, indicating the presence of effects conditioned to NFS. In contrast, a value of H0 lower than a critical value implies the absence of effects of NFS during the stimulation, which cannot be rejected.Spectral analysis
The PSD of a signal x n
[ ]
can be computed directly from the Fourier Transform (FT) by employing the Discrete Fourier Transform. However, to avoid negative values of frequency, Hilbert Transform (HT) represents an alternative way. For this purpose, x n[ ]
is replaced by its analytical signal g n
[ ] [ ]
=x n +j x n. ˆ[ ]
, where j= −1 and x nˆ[ ]
denotes the HT of x n[ ]
. So, the PSD of x n[ ]
, Pxx, can be calculated by:( ). *( )
xx
P =X f X f (5)
in which X is the FT of the analytical signal and
( )
*
X f is its complex conjugate. Pxx is distributed as
a random variable with Chi-squared distribution with two degrees of freedom ((χ22), since EEG segment is assumed as zero-mean Gaussian-distributed (Tierra-Criollo, 1998 apud Infantosi et al., 2005). In order to increase the statistical signiicance, estimation of PSD is performed by Barlett periodogram, which is used for estimating the PSD by means of:
( ) 1 ( )( )
0
1
ˆ M m
B xx
m
P f P f
M
−
=
= ∑ (6)
where M is the number of disjoint independent segments
with the same duration and ( )m xx
P is the estimated PSD oh m-th segment. ˆ
B
P is distributed as Chi-squared
distribution with 2M degrees of freedom (χ22M).
ORD based on spectral F-test
In the conventional model of VEP generation framework, ORD based on SFT is commonly used to detect an evoked response into the EEG signals under visual stimulation (Infantosi et al., 2005). In this work it is used to evaluate how the NFS affects the response of FS. STF (ˆ
xy
φ ) is calculated by utilizing the Barlett periodogram (ˆ
xx
P ) computed with Mx segments
recorded during the stimulation in the context of the novel setup x n
[ ]
, and the Barlett periodogram (ˆyy
P ) is computed with My segments of signals recorded before y n
[ ]
(during conventional stimulation):( ) ( ) ( )( ) ( )( ) 1 1 1 1 ˆ ˆ ˆ x x y y m M xx m xx x
xy M m
yy
yy m y
P f
P f M
P f P f
M =
= ∑
φ = =
∑
(7)
where both numerator and denominator are correspondingly distributed as Chi-squared distribution with 2Mx (
2 2Mx
χ ) and 2My (χ22My) degrees of freedom, since x n
[ ]
and[ ]
y n are assumed as independent Gaussian processes. Consequently, ˆ
xy
φ that follows the F-distribution with
2Mxand 2My degrees of freedom, is expressed as:
( ) 0 2 ,2 ˆ ~ x y y
xy M M
x H
M
f F
M φ (8)
for the null hypothesis H0 of absence of effects of NFS within the VEP of FS in the context of the novel setup. The critical value of the hypothesis test for a signiicance level a is given by:
( ) ~ 2 ,2 ,
ˆ
x y
xy f crit FM M a
φ (9)
for the particular case in which M=Mx=My. Then, if ˆ
xy
(ˆ crit
φ ), the null hypothesis of absence of effects of NFS is rejected with a signiicance level a. In contrast, if
ˆ xy
φ is lower than ˆ crit
φ , there is no statistical evidence to support the presence of NFS effects in VEP signals acquired in the novel setup, and the null hypothesis cannot be rejected. Furthermore, the non-rejection of the null hypothesis drives the model of the novel setup to an interpretation similar to the conventional model. Thus, all standard methods of SSVEP signal processing that are applied to the conventional model may also be applied to this novel setup.
PSDA detection method
In SSVEP-BCI systems, detection methods produce outputs by extracting embedded information of modulated EEG signals. For example, the PSDA detection method recognizes the frequency of the target stimulus by looking for the power density and obtaining a SNR around the fundamental frequency (and harmonic frequencies) of visual stimuli. In the context of this novel setup, the present work suggests that PSDA method can be applied to recognize the frequency of FS if the hypothesis test could not reject the null hypothesis. In other words, the PSDA method can only be applied to the SSVEP frequencies of the novel setup in which there is no statistical evidence of NFS interfering effects.
In conventional SSVEP-BCI systems, the modulated brain signals y n
[ ]
that arise as reaction of an visual stimulus u n[ ]
can be represented as: y n u[ ]
6.4 and[ ]
5.6y n u , in which subscripts denote the lickering
frequencies, and ‘|’ means “given by”. The input of PSDA method is y n
[ ]
and a successful output is the frequency of the target stimulus. On the other hand, in the context of the novel setup, the modulated brain signal x n[ ]
that arises in response to the novel visual stimulation u n[ ]
, described in Equations 1 and 2, canbe expressed as:
[ ] [ ]
( 5.6, 6.4)x n u n = u u (10)
and
[ ] [ ]
( 5.6, 6.4)x n u n = u u (11)
in which subscripts denotes stimulus lickering frequency, u indicates which stimulus the user is focusing on. In this case, the input of PSDA method is x n
[ ]
and a successful output is the frequency of thetarget stimulus, fFS. The SNR can be computed as:
( ) / 2 ( ) ( )/ 2 ( )
.
. .
xx
n n
k s xx k sxx
n P f SNR f
P f k f P f k f
= =
=
+ ∆ + − ∆
∑ ∑ (12)
where f is the frequency, Pxx is the PSD of x n[ ], k
determines the neighborhood analysis and ∆f is the
frequency step. The analysis of a stimulus frequency
i
f (for i=1, 2) is given by SNR f( )i. Due to the harmonic
frequencies may contribute to the detection; they are included in the computing of the frequency of target stimulus:
( ) 1 ( )
2
argmax H .
ch i i
h i
C SNR f +SNR h f
=
= + ∑ (13)
where subscript ch denotes the EEG channel, and H
is the number of harmonic frequencies considered for detection. In a speciic case, in which two stimuli (f1=5.6 and f2=6.4) and three electrodes are considered, the frequency of FS is computed as:
3 1 1 3 2 1
5.6 ( 1) 1
6.4 ( 1) 1
ch ch FS
ch ch
f if C f
f if C
=
=
= ∑ − ≤
=
= ∑ − >
(14)
Materials
and Blaser, 2010) was applied to ensure the blurriness of non-focused stimulus.
Results
SFT was computed by employing the equation 7 with Mx=My=10 segments with 10 seconds length each. The critical value of SFT for signiicant level of
0.05
a = was φˆcrit=2 1. 2, according to Equation 9. SFT
assumes a null hypothesis (H0), in which NFS does not affect FS. If ˆ ˆ
xy crit
φ > φ , H0 is rejected; otherwise, it is not rejected. Thus, SFT can be evaluated along the frequency domain to ind where the null hypothesis is rejected. Figure 3a shows SFT results in the frequency range 4-20 Hz computed from signals of electrodes Pz,
O1 and O2, for one subject, in which the horizontal dotted line represents values of ˆ
crit
φ .
Top inset of the Figure 3a corresponds to results obtained when x n
[ ]
is the EEG signal recorded during the novel stimulation when the subject was focusing on the nearest stimulus lickering at 5.6 Hz,[ ]
( 5.6, 6.4)x n = u u ; and y n
[ ]
is the EEG signal recorded before, in which only the nearest stimulus was working (u n[ ]
=u5.6). It can be seen clearly that the null hypothesis is rejected in 8-10 Hz band and its vicinity for three analyzed electrodes. Also, STF is higher than the critical value in the vicinity of the second harmonic of NFS frequency for electrodes O1 and O2. However, the null hypothesis is not rejected in the fundamental frequency values of FSand NFS, because ˆ ˆ xy crit
φ < φ for the three electrodes. Figure 3b depicts the Barlet periodogram of x n
[ ]
(black curve), together with the periodogram curves of Mx=10 segments (gray curves), respectively, by
using Equations 6 and 7. Periodograms of additional electrodes (P3 and P4) were included in this igure. Elicited peaks are observed in the fundamental frequency of all electrodes but P3. Plots of electrodes O1 and O2 also have peaks in the second harmonic frequency. Figure 3c shows the Barlett periodogram of
[ ]
y n and the periodogram curves of My=10 segments. In this case, spectra of electrodes Pz, P4, O1 and O2 present peaks in the fundamental frequency and in their second harmonic.
Bottom inset of the Figure 3a shows SFT when x n
[ ]
corresponds to u n
[ ]
=(u5.6,u6.4), and y n[ ]
corresponds to u n[ ]
=u6.4. In this case, the null hypothesis is not rejected at both fundamental frequencies of FS (lickering at 6.4 Hz) and NFS (lickering at 5.6 Hz). It is only rejected in the second harmonic of the focused stimulus frequency for electrode O1. Figure 3d, e show the Barlett periodogram of x n[ ]
and[ ]
y n, respectively. In both cases, peaks are observed in the fundamental frequency of the focused stimulus for electrodes Pz, O1 and O2.
Figure 4 shows SFT of nine subjects for electrodes O1 and O2. Top inset of the igures shows SFT for FS placed near the NFS and lickering at 5.6 Hz, in
Figure 4. SFT of nine subjects for electrodes O1 and O2. Top inset corresponds to 5.6 Hz and bottom inset corresponds to 6.4 Hz. The horizontal
which x n
[ ]
corresponds to u n[ ]
=(u5.6,u6.4) and y n[ ]
corresponds to u n[ ]
=u5.6. As shown in Figure 4a, e, the null hypothesis H0 is rejected in the vicinity of fundamental frequency of NFS at least for one electrode (subjects 1 and 5, correspondingly); consequently, it can be seen that H0 was not rejected in most of cases, as shown in Figure 4b-i. In the case of second harmonic on NFS, H0 was rejected in Figure 4a, c, d, i (for subjects 1, 3, 4, and 9). Bottom inset shows SFT for FS placed farther than NFS and lickering at 6.4 Hz, in which x n[ ]
corresponds to u n[ ]
=(u5.6,u6.4) and y n[ ]
corresponding to u n[ ]
=u6.4. In this case, φˆxyis very close to the critic value ˆ crit
φ in fundamental frequency of NFS for subject 9, which can reject the null hypothesis. However, for other subjects, H0 was not rejected at this frequency, as it can be seen in all igures but 4i. In the case of second harmonic,
0
H was rejected for subjects 5 and 6. In summary,
in the novel setup context, when u n
[ ]
=(u5.6,u6.4), H0 was not rejected at the fundamental frequency of NFS for 7 subjects (~80%). Also, when u n[ ]
=(u5.6,u6.4),0
H was not rejected at the fundamental frequency
of NFS for 8 subjects (~90%). The non-rejection of the null hypothesis of absence of effects of the NFS within the VEP elicited by the FS indicates that it can be kept in order to conduct a detection method for recognizing the frequency of the target stimulus.
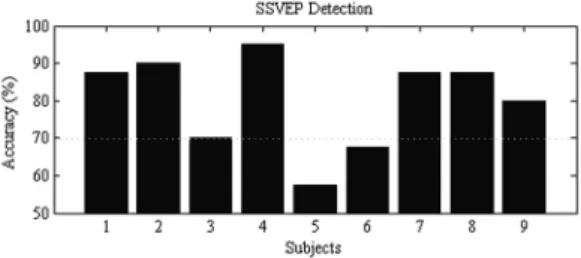
Figure 5 shows the accuracy rates achieved by performing the PSDA detection method in order to recognize the frequency of the FS in the context of this novel setup, in which signals of three electrodes (Pz, O1, and O2) and the second harmonic frequencies (beyond the fundamental frequency) were considered. It can be seen that seven subjects reach accuracy rate higher than 70%, six subjects reach accuracy rate higher than 80%, and one subject reaches accuracy close to 50%.
Figure 6 shows the receiver-operator characteristic (ROC) curve for nine subjects. ROC is commonly used to analyze the separation capacity of the two classes carried out by a classiier (Fawcett, 2005). To use ROC curves in the novel setup context, the detection of 5.6 Hz was considered as the positive
classiication and the detection of 6.4 Hz was considered as the negative classiication. Although the ROC curve provides information about sensitivity and speciicity, the parameter commonly used to evaluate the performance of a classiier is its area under curve (AUC). Values between 0 and 1 quantify the overall ability of the test to discriminate between two classes, where an ideal detection system has the area equal to 1 and a random detection has area of 0. It can be seen that AUC of subjects 2, 4 and 7 (Figure 6b, d, g) attains values very close to 1. In contrast, the AUC of subject 5 is close to 0.5.
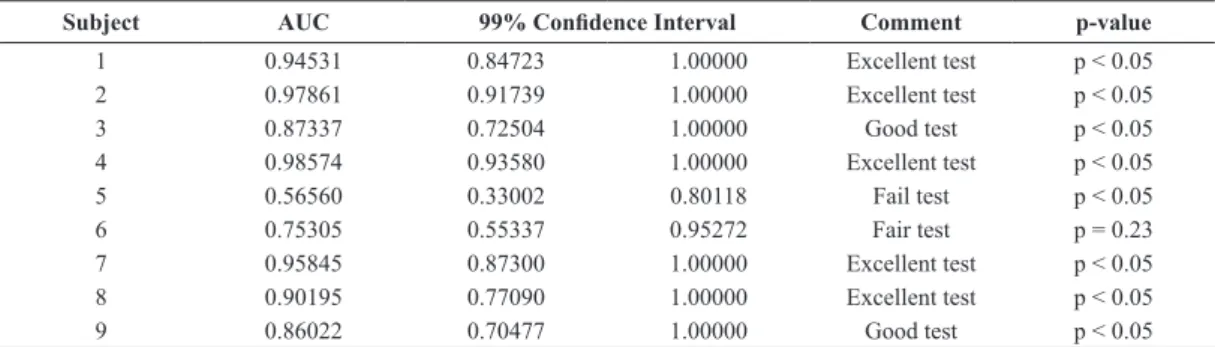
Table 1 shows the AUC computed along 95% confidence interval for all subjects. Detection performance can be evaluated by using the value of AUC as follows: excellent (above 0.9), good (0.8-0.9), fair (0.7-0.8), poor (0.6-0.7) and fail (below 0.5), which are indicated as comments in Table 1 (Jiang, 2010). Notice that experiments for seven subjects were considered as good or excellent, and the experiment for one subject (subject 6) was fair. Responses for one experiment (subject 5) were considered randomly.
Discussion
In the present work, an alternative manner of presenting SSVEP stimuli was evaluated, in which two lickering stimuli are placed together in the center of users’ ield of view, but with dissimilar distances. These distances play an important role because blurriness degree of a non-focused object depends on the Depth-of-Field of a focused object, which in turn depends on the distances between focused and non-focused objects. Ophthalmology studies found the amplitude of VEP is reduced when the light stimulus is defocused (Sokol and Moskowitz, 1981). Thus, an appropriate distance of separation of two SSVEP stimuli delivers an extraordinary situation where if one stimulus is in focus the other one must be out of focus and vice versa. Models for distance estimation can be found, e.g., the retinal blurry model that is based on the diameter of blurriness non-focused point (Vishwanath and Blaser, 2010). To avoid signiicant eye movements, both stimuli were placed in the center of the user’s ield of view. In this case, shifting of stimulus is executed by performing the accommodation mechanism that is deined as the ability of the human eye to adjust itself to give sharp images for different object distances (Gregory, 1997), on the other hand accommodation does not require voluntary muscular control (Ebenholtz, 2001). Muscular activity related to the eye movements was also evaluated. EOG signals were recorded by using two EOG bipolar channels of BNT device. Four subjects were asked to not blink during two seconds starting one second
Figure 5. Accuracy rate of SSVEP-BCI detection using PSDA
Figure 6. ROC curves of PSDA detection method for nine subjects. (a-i) Subjects 1-9, respectively.
Table 1. Conidence interval of the AUC for p<0.05 of ROC curves of PSDA detection method for nine subjects.
Subject AUC 99% Conidence Interval Comment p-value
1 0.94531 0.84723 1.00000 Excellent test p < 0.05
2 0.97861 0.91739 1.00000 Excellent test p < 0.05
3 0.87337 0.72504 1.00000 Good test p < 0.05
4 0.98574 0.93580 1.00000 Excellent test p < 0.05
5 0.56560 0.33002 0.80118 Fail test p < 0.05
6 0.75305 0.55337 0.95272 Fair test p = 0.23
7 0.95845 0.87300 1.00000 Excellent test p < 0.05
8 0.90195 0.77090 1.00000 Excellent test p < 0.05
before shifting stimulus and ending one second after it, for ten runs. For 15o of vertical visual angle the average EOG measured was 385 µV. Assuming a linear relationship within the range of interest, the vertical angle average of eye movements during the shifting was 1.95o±0.7. Thus, it shows that minimal
movements are present during the shifting of focus. In the present work, with the purpose of evaluating how the NFS affects the FS, statistical analysis was conducted by employing Objective Response Detection (ORD) techniques, they allow inferring about the presence (or absence) of sensory response and are being employed successfully in somato-sensorial (Tierra-Criollo and Infantosi., 2006), visual (Sá et al., 2006) and auditory (Felix et al., 2014) evoked potentials detection. Based on the model of VEP generation for conventional setups (Melges et al., 2012), a model for the novel setup was proposed, in which the output signal was composed by NFS an FS responses. As suggested by Infantosi et al. (2005), that evaluated a null hypothesis of absence of response by using STF, in this work the null hypothesis of absence of effects of NFS within the VEP elicited by the FS was used, with a signiicance level of 5%. Results for nine subjects show that the null hypothesis was not rejected in most of cases; expressly at the fundamental frequency of NFS (~80% of the tests). To simplify the linear model, it was assumed that the spontaneous EGG signal was included in the focused component (as shown in Figure 2b). This assumption was based on literature results (Infantosi et al., 2005; Sá et al., 2006) that showed that the spontaneous signal does not interfere with the detection of photic driving effects in fundamental and harmonic frequencies of the visual stimulus. The Barlett periodogram was computed from the spectral power of the analytical signal computed from HT of the EEG signal as analytic signal based on HT avoids negative values of frequency.
Two interpretations for hypothesis tests outcomes can be found related to null hypothesis. First, the acceptance of null hypothesis is supported by Neyman-Pearson decision theory that includes the F-test (Spanos, 1999). Second, interpretations based on Fisher’s null hypothesis testing do not accept the non-rejected hypothesis, but suspend judgment until further experiments should be conducted. In some works, the non-rejection of null hypothesis can be considered as acceptation (Infantosi et al., 2005; Sá et al., 2006). In the present work, the non-rejection of null hypothesis does not consider as acceptation but as indication that there is not suficient evidence of NFS affecting FS. It gives the chance of applying of PSDA in traditional way. A low performance of PSDA method would indicate that NF is indeed affecting
FS. Figure 5 shows the accuracy rate of the PSDA detection of frequency of FS where rates higher than 70% were attained for seven (out of nine) subjects. Also, Figure 6 and Table 1 present the performance of tests by evaluating the AUC of ROC curves, in which experiments for eight subjects were found fair, good or excellent, and the experiment for one subject was found fail. Although it is recommended to repeat the fail experiments, it has not been disregarded of this work in order to present the full results of our experiments.
Results of this work provide evidences of the absence of NFS effects, in the context of this novel setup. Therefore, the importance of these indings is that detection methods commonly used to recognize the target stimulus in conventional SSVEP systems could be employed successfully to recognize the FS in the context of this novel setup. The advantage of the novel setup compared with conventional SSVEP-BCI setup, in which large muscular movements to place the target stimulus into the ield of view are required, is that only minimal eye movements are required to select the target stimulus because the two stimuli are already in the ield of view.
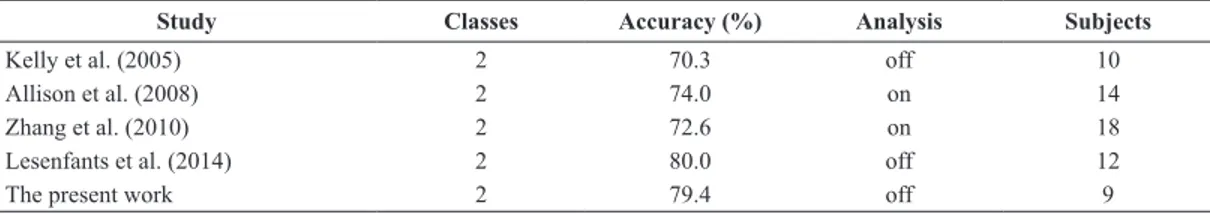
Thus, it can be concluded that if two stimuli are presented together in the center of the ield of view of the BCI’s user, lickering at different frequencies and located at different distances from the user, then the FS is able to elicit distinguishable SSVEP pattern regardless the NFS is also present. Note that well established knowledge from other areas such as optics (depth of ield), ophthalmology (amplitude of VEP is reduced when the light stimulus is defocused) and physiology (accommodation of the eye) were sensitized to propose an alternative way of brain-machines interface’s stimulation, never before studied. This study contributes directly to the research area of alternative or augmentative communication, oriented to people in locked-in syndrome, in inal stage of ALS, or in other extreme case of paralysis situation. Table 2 shows the performance of independent SSVEP-BCI systems together with the results achieved in the present work.
conducted. In future directions, algorithms based on machine learning could be implemented to improve the accuracy rate, and binary outputs together with a state machine can be used to develop BCI systems with more commands.
Acknowledgements
The authors would like to acknowledge the inancial funding from CNPq (Process 458651/2013-3), FINEP (Process 01/2010) and thank CAPES agency for scholarship support.
References
Allison B, Luth T, Valbuena D, Teymourian A, Volosyak I, Graser A. BCI demographics: how many (and what kinds of) people can use an SSVEP BCI? IEEE Transactions on Neural Systems and Rehabilitation Engineering. 2010; 18(2):107-16. http://dx.doi.org/10.1109/TNSRE.2009.2039495. PMid:20083463.
Allison BZ, McFarland D, Schalk G, Zheng S, Jackson M, Wolpaw J. Towards an independent brain-computer interface using steady state visual evoked potentials. Clinical Neurophysiology. 2008; 119(2):399-408. http:// dx.doi.org/10.1016/j.clinph.2007.09.121. PMid:18077208. Bastos TF Fo, Cheein FA, Müller SM, Celeste WC, de la Cruz C, Cavalieri DC, Sarcinelli M Fo, Amaral PF, Perez E, Soria CM, Carelli R. Towards a new modality-independent interface for a robotic wheelchair. IEEE Transactions on Neural Systems and Rehabilitation Engineering. 2014; 22(3):567-84. http://dx.doi.org/10.1109/TNSRE.2013.2265237. PMid:23744700.
Benevides AB, Cotrina A, Castillo J, Bastos TF Fo, Benevides AB. An ethernet sniffer for on-line acquisition of EEG with the BrainNet36 device applied to a BCI. In: Proceedings of Biosignals and Biorobotics Conference; 2014 May 26-28; Salvador. USA: IEEE; 2014. p. 1-6. http://dx.doi. org/10.1109/BRC.2014.6880964.
Cheng M, Gao X, Gao S, Xu D. Design and implementation of a brain-computer interface with high transfer rates. IEEE Transactions on Biomedical Engineering. 2002; 49(10):1181-6. http://dx.doi.org/10.1109/TBME.2002.803536. PMid:12374343.
Cotrina A, Bastos T, Ferreira A, Benevides A, Castillo J, Rojas D, Benevides A. Towards a SSVEP-BCI based on depth of field. In: Proceedings of the 6th International BCI Conference; 2014 Sept 16-19; Graz. Graz: Graz University of Technology Publishing House; 2014. p. 1-4.
Di Summa A, Fusine S, Bertolasi L, Vicentini S, Perlini S, Bongiovanni LG, Polo A. Mechanism of binocular interaction in refraction errors: study using pattern-reversal visual evoked potentials. Documenta Ophthalmologica. 1999; 98(2):139-51. http://dx.doi.org/10.1023/A:1002190127573. Ebenholtz SM. Oculomotor systems and perception. Cambridge: Cambridge University Press; 2001. http:// dx.doi.org/10.1017/CBO9780511529795.
Fawcett T. An introduction to ROC analysis. Pattern Recognition Letters. 2005; 27(8):861-74. http://dx.doi. org/10.1016/j.patrec.2005.10.010.
Felix LB, Ranaudo FS, Netto AD, Sá AMFLM. A spatial approach of magnitude-squared coherence applied to selective attention detection. Journal of Neuroscience Methods. 2014; 229(30):28-32. http://dx.doi.org/10.1016/j. jneumeth.2014.03.014. PMid:24704394.
Ferreira A, Muller S, Celeste W, Cavalieri D, Benevides A, Filgueira P, Amaral P, Sarcinelli M Fo. Bastos TF Fo, Perez E, Soria C. Smart wheelchairs. In: Bastos T, Kumar D, Arjunan SP, editors. Devices for mobility and manipulation for people with reduced abilities. Boca Raton: CRC Press; 2014. p. 15-40.
Gregory RL. Eye and brain: the psychology of seeing. 5th ed. Princeton: Princeton University Press; 1997.
Guger C, Allison BZ, Großwindhager B, Prückl R, Hintermüller C, Kapeller C, Bruckner M, Krausz G, Edlinger G. How many people could use an SSVEP BCI? Frontiers in Neuroscience. 2012; 6(169):169. http://dx.doi.org/10.3389/ fnins.2012.00169. PMid:23181009.
He B, Gao S, Yuan H, Wolpaw JR. Brain computer interfaces. In: He B, editor. Neural engineering. New York: Springer; 2013. p. 87-151. http://dx.doi.org/10.1007/978-1-4614-5227-0_2.
Howard I. Perceiving in depth: basic mechanisms. Oxford: Oxford University Press; 2012. v. 1. http://dx.doi.org/10.1093/ acprof:oso/9780199764143.001.0001.
Infantosi A, Lazarev V, De Campos D. Detecting responses to intermittent photic stimulation in the electroencephalogram using the Spectral F Test. Revista Brasileira de Engenharia Biomédica. 2005; 21(1):25-36.
Jiang J. Large sample techniques for statistics. New York: Springer; 2010. http://dx.doi.org/10.1007/978-1-4419-6827-2.
Kelly SP, Lalor E, Finucane C, McDarby G, Reilly R. Visual spatial attention control in an independent brain-computer interface. IEEE Transactions on Biomedical Engineering. 2005; 52(9):1588-96. http://dx.doi.org/10.1109/ TBME.2005.851510. PMid:16189972.
Table 2. Accuracy rates of independent SSVEP-BCI systems together with the results achieved in the present work.
Study Classes Accuracy (%) Analysis Subjects
Kelly et al. (2005) 2 70.3 off 10
Allison et al. (2008) 2 74.0 on 14
Zhang et al. (2010) 2 72.6 on 18
Lesenfants et al. (2014) 2 80.0 off 12
Lesenfants D, Habbal D, Lugo Z, Lebeau M, Horki P, Amico E, Pokorny C, Gomez F, Soddu A, Muller-Putz G, Laureys S, Noirhomme Q. An independent SSVEP-based brain-computer interface in locked-in syndrome. Journal of Neural Engineering. 2014; 11(3):035002. http://dx.doi. org/10.1088/1741-2560/11/3/035002. PMid:24838215. Melges D, Sa A, Infantosi A. Frequency-domain objective response detection techniques applied to evoked potentials: a review. In: Naik GR, editor. Applied biological engineering: principles and practice. Rijeka: Intech; 2012. p. 47-84. http:// dx.doi.org/10.5772/36356.
Middendorf M, McMillan G, Calhoun G, Jones KS. Brain-computer interfaces based on the steady-state visual-evoked response. IEEE Transactions on Rehabilitation Engineering. 2000; 8(2):211-4. http://dx.doi.org/10.1109/86.847819. PMid:10896190.
Muller S, Celeste W, Bastos T, Sarcinelli M. Brain-computer interface based on visual evoked potentials to command autonomous robotic wheelchair. Journal of Medical and Biological Engineering. 2010; 30(6):407-15. http://dx.doi. org/10.5405/jmbe.765.
Müller-Putz GR, Eder E, Wriessnegger SC, Pfurtscheller G. Comparison of DFT and lock-in amplifier features and search for optimal electrode positions in SSVEP-based BCI. Journal of Neuroscience Methods. 2008; 168(1):174-81. http://dx.doi.org/10.1016/j.jneumeth.2007.09.024. PMid:17980917.
Sá AM, Cagy M, Lazarev VV, Infantosi AF. Spectral F-test power evaluation in the EEG during intermittent photic stimulation. Arquivos de Neuro-Psiquiatria. 2006; 64(2-A):228-32. http://dx.doi.org/10.1590/S0004-282X2006000200011. PMid:16791361.
Simpson DM, Tierra-Criollo CJ, Leite RT, Zayen EJ, Infantosi AF. Objective response detection in an electroencephalogram during somatosensory stimulation. Annals of Biomedical Engineering. 2000; 28(6):691-8. http://dx.doi.org/10.1114/1.1305530. PMid:10983714.
Sokol S, Moskowitz A. Effect of retinal blur on the peak latency of the pattern evoked potential. Vision Research. 1981; 21(8):1279-86. http://dx.doi.org/10.1016/0042-6989(81)90232-7. PMid:7314511.
Spanos A. Probability theory and statistical inference: econometric modelling with observational data. Cambridge: Cambridge University Press; 1999. http://dx.doi.org/10.1017/ CBO9780511754081.
Sutter EE. The brain response interface: Communication through visually-induced, electrical brain responses. Journal of Microcomputer Applications. 1992; 15(1):31-5. http:// dx.doi.org/10.1016/0745-7138(92)90045-7.
Tierra-Criollo CJ, Infantosi AF. Low-frequency oscillations in human tibial somatosensory evoked potentials. Arquivos de Neuro-Psiquiatria. 2006; 64(2B):402-6. http://dx.doi. org/10.1590/S0004-282X2006000300010. PMid:16917609.
Vishwanath D, Blaser E. Retinal blur and the perception of egocentric distance. Journal of Vision. 2010; 10(10):26. http://dx.doi.org/10.1167/10.10.26. PMid:20884491.
Wang B, Ciuffreda KJ. Depth-of-focus of the human eye: theory and clinical implications. Survey of Ophthalmology. 2006; 51(1):75-85. http://dx.doi.org/10.1016/j.survophthal.2005.11.003. PMid:16414364.
Wolpaw JR, Birbaumer N, McFarland DJ, Pfurtscheller G, Vaughan TM. Brain-computer interfaces for communication and control. Clinical Neurophysiology. 2002; 113(6):767-91. http://dx.doi.org/10.1016/S1388-2457(02)00057-3. PMid:12048038.
Yin E, Zhou Z, Jiang J, Yu Y, Hu D. A dynamically optimized SSVEP brain-computer interface (BCI) speller. IEEE Transactions on Biomedical Engineering. 2015; 62(6):1447-56. http:// dx.doi.org/10.1109/TBME.2014.2320948. PMid:24801483.
Zhang D, Maye A, Gao X, Hong B, Engel AK, Gao S. An independent brain-computer interface using covert non-spatial visual selective attention. Journal of Neural Engineering. 2010; 7(1):16010. http://dx.doi.org/10.1088/1741-2560/7/1/016010. PMid:20083864.
Authors
Anibal Cotrina1*, Alessandro Botti Benevides1, Javier Castillo-Garcia1, Andre Ferreira2,
Teodiano Freire Bastos Filho1,2
1 Programa de Pós-Graduação em Engenharia Elétrica – PPGEE, Universidade Federal do Espírito Santo – UFES, Av. Fernando Ferrari, 514, CT II block, Goiabeiras, CEP 29075-910, Vitoria, ES, Brazil.
![Figure 3b depicts the Barlet periodogram of x n [ ] (black curve), together with the periodogram curves of M x = 10 segments (gray curves), respectively, by using Equations 6 and 7](https://thumb-eu.123doks.com/thumbv2/123dok_br/18861800.418097/7.765.103.706.379.1010/figure-depicts-barlet-periodogram-periodogram-segments-respectively-equations.webp)