ISSN 0104-6632 Printed in Brazil
Brazilian Journal
of Chemical
Engineering
Vol. 21, No. 02, pp. 229 - 237, April - June 2004
MODELLING OF THE DISPERSED AIR
FLOTATION PROCESS APPLIED TO DAIRY
WASTEWATER TREATMENT
F. P. Puget
1, M. V. Melo
2and G. Massarani
2*1Departamento de Engenharia Química, FSJB/FACHA, 2
Programa de Engenharia Química / COPPE, Universidade Federal do Rio de Janeiro Phone +(55) (21) 2562-8345, Fax +(55) (21) 2562-8300, Cidade Universitária,
Cx.P. 68502, 21945-970, Rio de Janeiro – RJ, Brazil. E-mail: gmassa@peq.coppe.ufrj.br
(Received: February 13, 2003 ; Accepted: September 23, 2003)
Abstract - The aim of this work was to develop a mathematical model for a continuously operating flotation tank to provide the scale-up and optimization of the separation system. The fluid dynamic of the tank was assumed to be a perfect mixture and the flotation kinetics to be a first-order reaction, as suggested by the batch operation. The experiments were carried out in a continuously operating 60 L tank, used in the treatment of a synthetic dairy waste at its isoelectric point. A mathematical model that describes the behavior of a continuously operating flotation tank used in the treatment of a synthetic dairy waste at its isoelectric point is not only proposed, but also validated with experimental data.
Keywords: flotation, dairy waste, continuous operation.
INTRODUCTION
Dairy products are of major importance in the food industry. Despite their economical advantages, these processes have considerable potential for polluting, so one must be aware of the need to treat the waste before discharging it. As environmental laws become stricter, new technologies and strategies for wastewater treatment need to be developed. Currently, much effort is being devoted to studying the feasibility of flotation systems as a pretreatment path for dairy wastes.
Flotation processes have been widely and successfully used for mineral treatment. Recently, these processes have also been employed as an alternative strategy for wastewater treatment. Unlike other technologies, flotation processes can be successfully applied to systems where differences between the density of the continuous phase and of
the particulate phase are small, classic examples are flocculent emulsions and suspensions.
In this work, a mathematical model that describes the behavior of a continuously operating flotation tank used in the treatment of a synthetic dairy waste at its isoelectric point was not only proposed, but also validated with experimental data.
EXPERIMENTAL Experimental Setup
halfway up the tank, while the discharge line is connected close to the bottom of the tank. Figure 1 contains a schematic representation of the experimental setup used in this study. It is composed of a 75 L tank used to feed the flotation tank, a centrifugal pump (B1, ½ HP), a peristaltic pump (B2; Cole & Palmer), an air compressor (C1; CETT378) and rotameters (GILMONT), used to measure both the air and the waste flow rate into the flotation tank.
The experimental apparatus can be operated either in batch or continuous mode. In batch operation, the flotation tank is purged with air and then it is charged with the desired amount of waste. Once the airflow rate is set, samples are regularly withdrawn from the tank for spectrophotometrical analysis. Continuous mode operation is different.
The tank is initially operated in batch mode until the clarified reaches a specific concentration set point. Then, both the waste feed pump and the discharge tank pump are turned on without changing the air flow rate. Samples were also withdrawn from the flotation tank.
Dairy Wastewater
The synthetic wastewater used in this work was prepared by the addition of powdered milk (specified in Table 1) to water under mechanical shaking. Proteins and fats were precipitated by slowly additing an aqueous 1:10 HCl solution until the isoelectric pH point of the waste was reached. The final synthetic dairy waste can be characterized as a homogeneous suspension at a concentration of 0.1%.
Figure 1: Experimental Set-up (Height = 1.4 m, Width = 0.5 m, Thickness = 0.1 m)
Table 1: Powdered milk La Serenissima, Mastellone Hnos S.A., Argentina
Powdered Milk Composition (100 g)
Lipids 26.0 g
Proteins 26.0 g
Lactose 38.0 g
Ash 7.0 g
Moisture 3.0 g
QAIR
QL
Froth
Ci
Bottom product C1 B1
B2
1 Air
inlet Feed
3
2
1 - Feed tank
2 - Air sparger
3 - Rotameters
C1 - Compressor
B1, B2 - Pumps 1.1 m
1.6 m
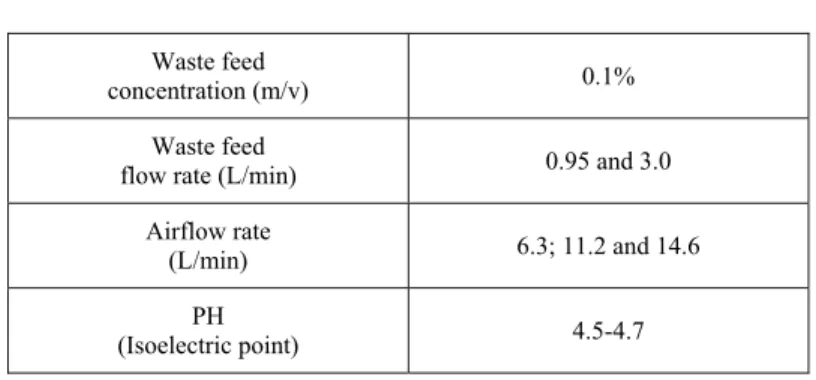
Table 2: Operating Conditions
Waste feed
concentration (m/v) 0.1%
Waste feed
flow rate (L/min) 0.95 and 3.0
Airflow rate
(L/min) 6.3; 11.2 and 14.6
PH
(Isoelectric point) 4.5-4.7
e) Operating Conditions Experimental Section
a) Waste Flocculent Structure Characterization Operating conditions for the experimental runs are reported in Table 2.
Using Malver Mastersizer Micro Plus (MAF 501) equipment, the average diameter of the waste flocks, Df = 34.9 Pm, , was obtained. Using the centrifugal
technique presented by França (2000), the density of the flocks was determined and a value at U= 1.13 r 0.05 g/cm3 was found.
Residence-Time Distribution
Residence-time distribution is an important tool in acquiring knowledge of the fluid dynamics of the tank and should be used in tank design and scale-up. If a pulse input analysis is done, the residence-time distribution function, the mean residence time and the variance are given, respectively, by Equations (2) to (4) (Fogler, 1970).
b) Average Bubble Diameter
Average bubble diameter was measured using an image analyzer software in order to examine the
photographs taken of the system. pulse
pulse 0
C t
E t
C t
f
³
dt(2)
c) Concentrations of Milk and Dyes
These concentrations were measured through spectrophotometrical analysis. The equipment used was a Hach DR/2000 spectrophotometer operating at 400 nm. Aiming to correctly determine the concentration of the milk, strong shaking was necessary to break the flocks.
c 0
t t E t
f
³
dt (3)2 2
t 0
t E t dt
f
V
³
(4)d) Process Efficiency (K)
Process efficiency was calculated based upon the concentration of milk in the feed and discharge streams. Equation (1) defines the efficiency of separation.
These variables can be experimentally obtained through a careful analysis of the evolution of a tracer concentration after its pulse injection into the system. Considering “N” well-mixed tanks in series, the distribution function, using dimensionless variables is given by
C
% 1 1
Ca § · K ¨ ¸ u
© ¹ 00 (1)
N 1
N ( N ) E
(N)
T
T
e T
* (5)
The number of tanks in series can be calculated using Equation (6), where corresponds to the
variance of the experimental curve E(T) versus T.
2
T
V i i a i 1 i
n
i i
0 i 0 F
0 N
i T
i 1
dC t
V Q C t C t
dt
k C t V
t t , C t C
C Ca
V V , i 1, 2, ..., N
ª º
° ¬ ¼
° °
ª º ° ¬ ¼ ° ® ° ° ° ° °¯
¦
(9) 2 1 N T V (6)For only one well-mixed tank, Equation (5) becomes
E( )T eT (7)
The residence-time distribution of the tank used in this work was experimentally determined. The tank was operated continuously, with prespecified air and water flow rates. Once the desired operating conditions were achivied, a volume of 500 mL of tracer (methylene blue) was added at the top of the tank, starting the test. Samples were withdrawn at the bottom (cleaned stream) of the tank and the tracer concentration was determined through spectrophotometrical analysis.
where Ca and Qa are the concentration and flow of the waste feed stream, respectively; k is the kinetic constant, and Vi and Ci are the volume and
concentration of tank i, respectively. CF corresponds
to the concentration at the end of the batch and prior to start-up of the continuous operation mode (t0 is the
instant when the continuous operation mode was started) and VT is the total volume of liquid in the tank (60 L).
The initial batch can be modeled using the following equation:
n
dC t
k C t dt
t 0 , C 0 Ca
ª º
° ¬ ¼
° ® ° °¯ (10) Flotation Kinetics
Knowledge of flotation kinetics is an important tool not only in determining process feasibility but also in achieving a good design and scale-up. Many approaches used to determine flotation kinetics can easily be found in literature; however, the easiest and most frequently used approach relates the flotation process to a chemical reaction. Based on this approach, the consumption of particles by the flotation process is given by Equation (8):
RESULTS AND DISCUSSION Average Bubble Diameter
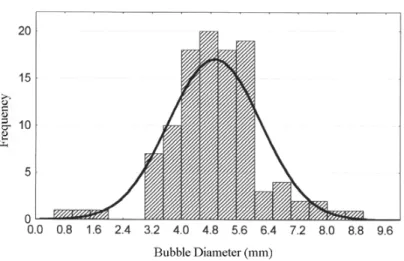
Generation of bubbles is a key step in the flotation process, mainly for the separation of small particles (10-30Pm). When the ratio between particle diameter and bubble diameter is too small, the particle tends to flow around the bubble thus making impossible its collision and consequently its separation. Figures 2 and 3 below show the bubble size distribution when the flotation tank was operated with airflow rates (Qair) of 6.3 and 14.6 L/min, respectively.
n
dC
k C
dt (8)
where C is the concentration of particles inside the tank and k is the flotation kinetic constant.
Modeling
Assuming the flotation tank to be a series of “N” well-mixed tanks, a material balance of the flocculated milk was calculated in these tanks adopting a generic kinetic expression. We also assumed the porosity of the liquid (HL) to be close to
one because of the operating conditions used. The system of equations presented below describes the start-up of the continuous operation mode.
Figure 2: Qair = 6.3 L/min; Average Diameter = 1.49 mm; Standard Deviation = 0.47
Figure 3: Qair = 14.6 L/min; Average Diameter = 4.9 mm; Standard Deviation = 1.26
Residence-Time Distribution
The residence-time distributions for the liquid feed flow rates used in this work are presented in Figures 4 and 5. The airflow rate was kept constant at 14.6 L/min throughout the experimental runs carried out. It must be emphasized that in this work the flotation tank fluid dynamics was assumed to be a series of “N” well-mixed tanks. The mean residence time and the number of tanks were calculated using Equations 3 and 6. For both cases studied, it was concluded that the flotation tank could be assumed to be a well-mixed tank.
Flotation Kinetics
Similarly to other cases reported in the literature, such as the studies of Santos (1996) and Rajinder
and Maslyah (1990), the flotation process was assumed to be a first-order chemical reaction. With this result, Equation (8) can be rewritten as
dC
k C
dt (11)
When the batch operation mode is used, the kinetic constant can be obtained from Equation (12):
C
ln k t
Ca § · ¨ ¸
© ¹ (12)
0.0 0.2 0.4 0.6 0.8 1.0
0.0 1.0 2.0 3.0 4.0
T
E
T
Experimental
N = 1
Figure 4: Residence-Time Distribution (Qair = 14.6 L/min; Qa = 0.95 L/min; and tC= 63 min,
V
T2 = 0.72)0.0 0.2 0.4 0.6 0.8 1.0
0.0 1.0 2.0 3.0 4.0 5.0 6.0
T
E
T
Experimental
N = 1
Figure 5: Residence-Time Distribution (Qair = 14.6 L/min; Qa = 3.0 L/min; and tC = 19 min, V2T = 0.99)
k = 0.71min -1
k = 0.34min -1
k = 0.19min -1
0.0 1.0 2.0 3.0 4.0 5.0
0 5 10 15
Time (min)
-l
n
(C
/Ca
)
Qair = 6.3 L/min
Qair = 11.2 L/min
Qair = 14.6 L/min
Continuous Flotation
As discussed above, the flotation tank was assumed to be a well-mixed tank. Assuming the flotation process to be a first-order chemical reaction, the material balance of the flocculated milk yields the equation below, which is a particular case of Equation (9) when N=n=1.
T a a
0 0 F
dC t
V Q C C t k C t
dt
t t , C t C
ª º
° ¬ ¼
° ® ° °¯
T
V
(13)
The analytical solution of Equation (13) is given by
0
1 k t t a
a F
C
C t e
1 k
C C 1 k
1 k
W
W
ª º
« »
« »
W
¬ ¼
ª W º « W »
¬ ¼
(14)
whereW is the mean residence time (tc).
For the initial batch, the behavior of the concentration is given by the solution of Equation 10 assuming the flotation process to be a first-order
chemical reaction.
k t a
C t C e (15)
Figure 7 contains the results of an experimental run carried out continuously with an airflow rate of 14.6 L/min and a waste feed flow rate of 0.95 L/min. It can be observed that operating under these conditions the experimental setup could remove 95 % of the suspended matter of the waste.
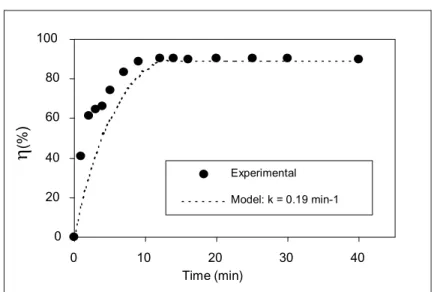
The experimental data obtained show good agreement with the simulation results (Equations 14 and 15). A flotation kinetic constant of 0.71 min-1, obtained in batch mode, was used for model simulation. Figures 8 and 9 contain the results of experimental runs carried out with an airflow rate of 6.3 L/min, using a feed flow rate of 0.95 and 3.0 L/min, respectively. In these experiments, the simulation results are also in good agreement with the experimental data.
It can also be observed that the efficiency of the flotation process is lower with an airflow rate of 6.3 L/min than with an airflow rate of 14.6 L/min. The most probable reason for this result is that an increase in the airflow rate leads to an increase in the number of efficient collisions. On the other hand, an increase in the waste feed flow rate, keeping the airflow rate constant, reduces the efficiency of the flotation process because the mean residence time of the particles inside the tank is reduced.
0 20 40 60 80 100
0 10 20 30 40 50
Time (min)
K
(%
)
Experimental
Model: k = 0.71 min-1
Figure 7: Continuous Flotation: Qair = 14.6 L/min and Qa = 0.95 L/min (t0 = 10 min;
0 20 40 60 80 100
0 10 20 30 40
Time (min)
K
(%
)
Experimental
Model: k = 0.19 min-1
Figure 8: Continuous Flotation: Qar = 6.3 L/min and Qa = 0.95 L/min (t0 = 10 min;
Ca = 1000 ppm;W = 63 min)
0 20 40 60 80 100
0 25 50 75 100
Time (min)
K
(%
)
Experimental
Model: k=0.19 min-1
Figure 9: Continuous Flotation: Qar = 6.3 L/min and Qa = 3.0 L/min (t0 = 10 min;
Ca = 1000 ppm;W = 19 min)
CONCLUSIONS
This work presents the use of flotation processes as an alternative tool for wastewater treatment. The studies were performed with a synthetic dairy waste at its isoelectric point and the flotation technique obtained good results.
Using a waste feed flow rate of 0.95 L/min and an airflow rate of 14.6 L/min process efficiencies higher than 90% could be achieved. Experimental data were well fitted to the simulation results of a well-mixed tank and the hypothesis of first-order chemical reaction like kinetics.
ACKOWLEDGEMENTS
The authors thank CNEN and CAPES for providing scholarships, and the Water Pollution Control Laboratory at PEQ/COPPE/UFRJ for providing the chemicals and equipment used in the COD analysis.
NOMENCLATURE
Ca Feed concentration [M/L3] C Tank concentration [M/L3] Ci ith Tank concentration [M/L3]
CF Concentration at the end of a batch run [M/ L3]
Cimp Tracer concentration during a pulse test [M/L3]
Df Average diameter of the flocks [L]
E(T) Residence-time distribution function with dimensionless variables [-] k Flotation kinetic constant [T-1] N Number of tanks in series [-] n Reaction order [-] Qa Waste feed flow [L3/T] Qair Air inlet flow [L3/T]
t Time [T]
t0 Time when operation of the experimental setup
is shifted from batch to continuous mode [T] tc Mean residence time [T]
Vi ithTank volume [L3]
VT Total tank volume [L3]
HL Liquid porosity [-]
* Gamma function [-] K Process efficiency [-] U Flock density [M/L3] Vt2 Residence time variance [T2]
VT2 Residence time variance with dimensionless
time [-]
T Dimensionless time (t/tc) [-]
REFERENCES
Fogler, H.S., Elements of Chemical Reaction Engineering. Prentice-Hall, New Jersey (1970).
França, S.C.A., Equações Constitutivas para a Sedimentação de Suspensões Floculentas. Ph.D. diss., COPPE/Universidade Federal do Rio de Janeiro (2000).
Kasapgil, B., Anderson, G.K. and Ince, O, An Investigation into the Pre-Treatment of Dairy Wastewater Prior to Aerobic Biological Treatment. Water Science and Technology, 29, No. 9, 205 (1994).
Puget, F.P., Melo, M.V. and Massarani, G., Wastewater Treatment by Flotation. Brazilian Journal of Chemical Engineering, 17, No 4-7, 407 (2000).
Puget, F.P. and Massarani, G., Caracterização de Ejetor para Geração de Bolhas para o Tratamento de Efluentes por Flotação. Anais do XXVII ENEMP – Congresso Brasileiro de Sistemas Particulados, p. 289 (1999).
Puget, F.P., Análise do Desempenho de Hidrociclone Flotante: Um estudo de caso. Master’s thesis, COPPE/Universidade Federal do Rio de Janeiro (1998).
Rajinder, P. and Maslyah, J., Oil Recovery from Oil in Water Emulsions Using a Flotation Column. The Canadian Journal of Chemical Engineering, 68, 959 (1990).


